Races in Junction City, Kansas (KS) Detailed Stats
Data:
Races - White alone (%)
Races - White alone (% change since 2000)
Races - Black alone (%)
Races - Black alone (% change since 2000)
Races - American Indian alone (%)
Races - American Indian alone (% change since 2000)
Races - Asian alone (%)
Races - Asian alone (% change since 2000)
Races - Hispanic (%)
Races - Hispanic (% change since 2000)
Races - Native Hawaiian and Other Pacific Islander alone (%)
Races - Native Hawaiian and Other Pacific Islander alone (% change since 2000)
Races - Two or more races(%)
Races - Two or more races(% change since 2000)
Races - Other race alone (%)
Races - Other race alone (% change since 2000)
Racial diversity
Place of birth - Born in state of residence (%)
Place of birth - Born in state of residence (%) - White
Place of birth - Born in state of residence (%) - Black or African American
Place of birth - Born in state of residence (%) - Asian
Place of birth - Born in state of residence (%) - Hispanic or Latino
Place of birth - Born in state of residence (%) - American Indian and Alaska Native
Place of birth - Born in state of residence (%) - Multirace
Place of birth - Born in state of residence (%) - Other Race
Place of birth - Born in other state (%)
Place of birth - Born in other state (%) - White
Place of birth - Born in other state (%) - Black or African American
Place of birth - Born in other state (%) - Asian
Place of birth - Born in other state (%) - Hispanic or Latino
Place of birth - Born in other state (%) - American Indian and Alaska Native
Place of birth - Born in other state (%) - Multirace
Place of birth - Born in other state (%) - Other Race
Place of birth - Native, outside of US (%)
Place of birth - Native, outside of US (%) - White
Place of birth - Native, outside of US (%) - Black or African American
Place of birth - Native, outside of US (%) - Asian
Place of birth - Native, outside of US (%) - Hispanic or Latino
Place of birth - Native, outside of US (%) - American Indian and Alaska Native
Place of birth - Native, outside of US (%) - Multirace
Place of birth - Native, outside of US (%) - Other Race
Place of birth - Foreign born (%)
Place of birth - Foreign born (%) - White
Place of birth - Foreign born (%) - Black or African American
Place of birth - Foreign born (%) - Asian
Place of birth - Foreign born (%) - Hispanic or Latino
Place of birth - Foreign born (%) - American Indian and Alaska Native
Place of birth - Foreign born (%) - Multirace
Place of birth - Foreign born (%) - Other Race
Residents speaking English at home (%)
Residents speaking English at home - Born in the United States (%)
Residents speaking English at home - Native, born elsewhere (%)
Residents speaking English at home - Foreign born (%)
Residents speaking Spanish at home (%)
Residents speaking Spanish at home - Born in the United States (%)
Residents speaking Spanish at home - Native, born elsewhere (%)
Residents speaking Spanish at home - Foreign born (%)
Residents speaking other language at home (%)
Residents speaking other language at home - Born in the United States (%)
Residents speaking other language at home - Native, born elsewhere (%)
Residents speaking other language at home - Foreign born (%)
Marital status - Never married (%)
Marital status - Now married (%)
Marital status - Separated (%)
Marital status - Widowed (%)
Marital status - Divorced (%)
Ancestries Reported - Arab (%)
Ancestries Reported - Czech (%)
Ancestries Reported - Danish (%)
Ancestries Reported - Dutch (%)
Ancestries Reported - English (%)
Ancestries Reported - French (%)
Ancestries Reported - French Canadian (%)
Ancestries Reported - German (%)
Ancestries Reported - Greek (%)
Ancestries Reported - Hungarian (%)
Ancestries Reported - Irish (%)
Ancestries Reported - Italian (%)
Ancestries Reported - Lithuanian (%)
Ancestries Reported - Norwegian (%)
Ancestries Reported - Polish (%)
Ancestries Reported - Portuguese (%)
Ancestries Reported - Russian (%)
Ancestries Reported - Scotch-Irish (%)
Ancestries Reported - Scottish (%)
Ancestries Reported - Slovak (%)
Ancestries Reported - Subsaharan African (%)
Ancestries Reported - Swedish (%)
Ancestries Reported - Swiss (%)
Ancestries Reported - Ukrainian (%)
Ancestries Reported - United States (%)
Ancestries Reported - Welsh (%)
Ancestries Reported - West Indian (%)
Ancestries Reported - Other (%)
Geographical mobility - Same house 1 year ago (%)
Geographical mobility - Same house 1 year ago (%) - White
Geographical mobility - Same house 1 year ago (%) - Black or African American
Geographical mobility - Same house 1 year ago (%) - Asian
Geographical mobility - Same house 1 year ago (%) - Hispanic or Latino
Geographical mobility - Same house 1 year ago (%) - American Indian and Alaska Native
Geographical mobility - Same house 1 year ago (%) - Multirace
Geographical mobility - Same house 1 year ago (%) - Other Race
Geographical mobility - Moved within same county (%)
Geographical mobility - Moved within same county (%) - White
Geographical mobility - Moved within same county (%) - Black or African American
Geographical mobility - Moved within same county (%) - Asian
Geographical mobility - Moved within same county (%) - Hispanic or Latino
Geographical mobility - Moved within same county (%) - American Indian and Alaska Native
Geographical mobility - Moved within same county (%) - Multirace
Geographical mobility - Moved within same county (%) - Other Race
Geographical mobility - Moved from different county within same state (%)
Geographical mobility - Moved from different county within same state (%) - White
Geographical mobility - Moved from different county within same state (%) - Black or African American
Geographical mobility - Moved from different county within same state (%) - Asian
Geographical mobility - Moved from different county within same state (%) - Hispanic or Latino
Geographical mobility - Moved from different county within same state (%) - American Indian and Alaska Native
Geographical mobility - Moved from different county within same state (%) - Multirace
Geographical mobility - Moved from different county within same state (%) - Other Race
Geographical mobility - Moved from different state (%)
Geographical mobility - Moved from different state (%) - White
Geographical mobility - Moved from different state (%) - Black or African American
Geographical mobility - Moved from different state (%) - Asian
Geographical mobility - Moved from different state (%) - Hispanic or Latino
Geographical mobility - Moved from different state (%) - American Indian and Alaska Native
Geographical mobility - Moved from different state (%) - Multirace
Geographical mobility - Moved from different state (%) - Other Race
Geographical mobility - Moved from abroad (%)
Geographical mobility - Moved from abroad (%) - White
Geographical mobility - Moved from abroad (%) - Black or African American
Geographical mobility - Moved from abroad (%) - Asian
Geographical mobility - Moved from abroad (%) - Hispanic or Latino
Geographical mobility - Moved from abroad (%) - American Indian and Alaska Native
Geographical mobility - Moved from abroad (%) - Multirace
Geographical mobility - Moved from abroad (%) - Other Race
Place of birth for the foreign-born population - Ireland (%)
Place of birth for the foreign-born population - Denmark (%)
Place of birth for the foreign-born population - Norway (%)
Place of birth for the foreign-born population - Sweden (%)
Place of birth for the foreign-born population - United Kingdom (%)
Place of birth for the foreign-born population - England (%)
Place of birth for the foreign-born population - Scotland (%)
Place of birth for the foreign-born population - Other Northern Europe (%)
Place of birth for the foreign-born population - Austria (%)
Place of birth for the foreign-born population - Belgium (%)
Place of birth for the foreign-born population - France (%)
Place of birth for the foreign-born population - Germany (%)
Place of birth for the foreign-born population - Netherlands (%)
Place of birth for the foreign-born population - Switzerland (%)
Place of birth for the foreign-born population - Other Western Europe (%)
Place of birth for the foreign-born population - Greece (%)
Place of birth for the foreign-born population - Italy (%)
Place of birth for the foreign-born population - Portugal (%)
Place of birth for the foreign-born population - Spain (%)
Place of birth for the foreign-born population - Other Southern Europe (%)
Place of birth for the foreign-born population - Albania (%)
Place of birth for the foreign-born population - Belarus (%)
Place of birth for the foreign-born population - Bosnia and Herzegovina (%)
Place of birth for the foreign-born population - Bulgaria (%)
Place of birth for the foreign-born population - Croatia (%)
Place of birth for the foreign-born population - Czechoslovakia (%)
Place of birth for the foreign-born population - Hungary (%)
Place of birth for the foreign-born population - Latvia (%)
Place of birth for the foreign-born population - Lithuania (%)
Place of birth for the foreign-born population - North Macedonia (Macedonia) (%)
Place of birth for the foreign-born population - Moldova (%)
Place of birth for the foreign-born population - Poland (%)
Place of birth for the foreign-born population - Romania (%)
Place of birth for the foreign-born population - Russia (%)
Place of birth for the foreign-born population - Serbia (%)
Place of birth for the foreign-born population - Ukraine (%)
Place of birth for the foreign-born population - Other Eastern Europe (%)
Place of birth for the foreign-born population - China (%)
Place of birth for the foreign-born population - Hong Kong (%)
Place of birth for the foreign-born population - Taiwan (%)
Place of birth for the foreign-born population - Japan (%)
Place of birth for the foreign-born population - Korea (%)
Place of birth for the foreign-born population - Other Eastern Asia (%)
Place of birth for the foreign-born population - Afghanistan (%)
Place of birth for the foreign-born population - Bangladesh (%)
Place of birth for the foreign-born population - India (%)
Place of birth for the foreign-born population - Iran (%)
Place of birth for the foreign-born population - Kazakhstan (%)
Place of birth for the foreign-born population - Nepal (%)
Place of birth for the foreign-born population - Pakistan (%)
Place of birth for the foreign-born population - Sri Lanka (%)
Place of birth for the foreign-born population - Uzbekistan (%)
Place of birth for the foreign-born population - Other South Central Asia (%)
Place of birth for the foreign-born population - Burma (%)
Place of birth for the foreign-born population - Cambodia (%)
Place of birth for the foreign-born population - Indonesia (%)
Place of birth for the foreign-born population - Laos (%)
Place of birth for the foreign-born population - Malaysia (%)
Place of birth for the foreign-born population - Philippines (%)
Place of birth for the foreign-born population - Singapore (%)
Place of birth for the foreign-born population - Thailand (%)
Place of birth for the foreign-born population - Vietnam (%)
Place of birth for the foreign-born population - Other South Eastern Asia (%)
Place of birth for the foreign-born population - Armenia (%)
Place of birth for the foreign-born population - Iraq (%)
Place of birth for the foreign-born population - Israel (%)
Place of birth for the foreign-born population - Jordan (%)
Place of birth for the foreign-born population - Kuwait (%)
Place of birth for the foreign-born population - Lebanon (%)
Place of birth for the foreign-born population - Saudi Arabia (%)
Place of birth for the foreign-born population - Syria (%)
Place of birth for the foreign-born population - Turkey (%)
Place of birth for the foreign-born population - Yemen (%)
Place of birth for the foreign-born population - Other Western Asia (%)
Place of birth for the foreign-born population - Eritrea (%)
Place of birth for the foreign-born population - Ethiopia (%)
Place of birth for the foreign-born population - Kenya (%)
Place of birth for the foreign-born population - Somalia (%)
Place of birth for the foreign-born population - Uganda (%)
Place of birth for the foreign-born population - Zimbabwe (%)
Place of birth for the foreign-born population - Other Eastern Africa (%)
Place of birth for the foreign-born population - Cameroon (%)
Place of birth for the foreign-born population - Congo (%)
Place of birth for the foreign-born population - Democratic Republic of Congo (Zaire) (%)
Place of birth for the foreign-born population - Other Middle Africa (%)
Place of birth for the foreign-born population - Egypt (%)
Place of birth for the foreign-born population - Morocco (%)
Place of birth for the foreign-born population - Sudan (%)
Place of birth for the foreign-born population - Other Northern Africa (%)
Place of birth for the foreign-born population - South Africa (%)
Place of birth for the foreign-born population - Other Southern Africa (%)
Place of birth for the foreign-born population - Cabo Verde (%)
Place of birth for the foreign-born population - Ghana (%)
Place of birth for the foreign-born population - Liberia (%)
Place of birth for the foreign-born population - Nigeria (%)
Place of birth for the foreign-born population - Senegal (%)
Place of birth for the foreign-born population - Sierra Leone (%)
Place of birth for the foreign-born population - Other Western Africa (%)
Place of birth for the foreign-born population - Australia (%)
Place of birth for the foreign-born population - New Zealand (%)
Place of birth for the foreign-born population - Fiji (%)
Place of birth for the foreign-born population - Micronesia (%)
Place of birth for the foreign-born population - Bahamas (%)
Place of birth for the foreign-born population - Barbados (%)
Place of birth for the foreign-born population - Cuba (%)
Place of birth for the foreign-born population - Dominica (%)
Place of birth for the foreign-born population - Dominican Republic (%)
Place of birth for the foreign-born population - Grenada (%)
Place of birth for the foreign-born population - Haiti (%)
Place of birth for the foreign-born population - Jamaica (%)
Place of birth for the foreign-born population - St. Vincent and the Grenadines (%)
Place of birth for the foreign-born population - Trinidad and Tobago (%)
Place of birth for the foreign-born population - West Indies (%)
Place of birth for the foreign-born population - Other Caribbean (%)
Place of birth for the foreign-born population - Belize (%)
Place of birth for the foreign-born population - Costa Rica (%)
Place of birth for the foreign-born population - El Salvador (%)
Place of birth for the foreign-born population - Guatemala (%)
Place of birth for the foreign-born population - Honduras (%)
Place of birth for the foreign-born population - Mexico (%)
Place of birth for the foreign-born population - Nicaragua (%)
Place of birth for the foreign-born population - Panama (%)
Place of birth for the foreign-born population - Other Central America (%)
Place of birth for the foreign-born population - Argentina (%)
Place of birth for the foreign-born population - Bolivia (%)
Place of birth for the foreign-born population - Brazil (%)
Place of birth for the foreign-born population - Chile (%)
Place of birth for the foreign-born population - Colombia (%)
Place of birth for the foreign-born population - Ecuador (%)
Place of birth for the foreign-born population - Guyana (%)
Place of birth for the foreign-born population - Peru (%)
Place of birth for the foreign-born population - Uruguay (%)
Place of birth for the foreign-born population - Venezuela (%)
Place of birth for the foreign-born population - Other South America (%)
Place of birth for the foreign-born population - Canada (%)
Place of birth for the foreign-born population - Other Northern America (%)
Place of birth for the foreign-born population - Other (%)
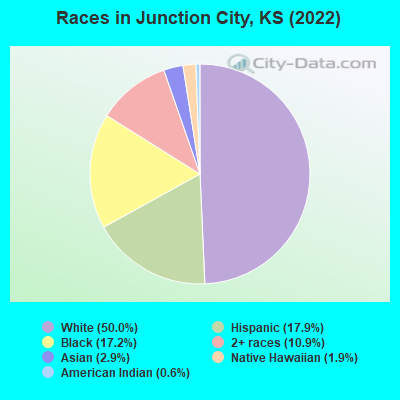
According to 2022 data, the most numerous races in Junction City, KS are White alone (11,370 residents), Hispanic (4,070 residents), and Black alone (3,920 residents). 84.4% of Junction City residents speak English at home. 7.8% of Junction City, KS residents are foreign-born (3.0% born in Latin America, 2.1% born in Asia, 1.6% born in Europe), which is 10.6% greater than the foreign-born rate of 7.0% across the entire state of Kansas.
Race distribution in Junction City
2000 2022
2,233,997 83.1% White alone 188,252 7.0% Hispanic 151,407 5.6% Black alone 46,301 1.7% Asian alone 42,508 1.6% Two or more races 22,322 0.8% American Indian alone 2,477 0.09% Other race alone 1,154 0.04% Native Hawaiian and Other
2,147,943 73.1% White alone 381,746 13.0% Hispanic 147,666 5.0% Black alone 145,362 4.9% Two or more races 85,085 2.9% Asian alone 13,263 0.5% Other race alone 12,065 0.4% American Indian alone 4,020 0.1% Native Hawaiian and Other
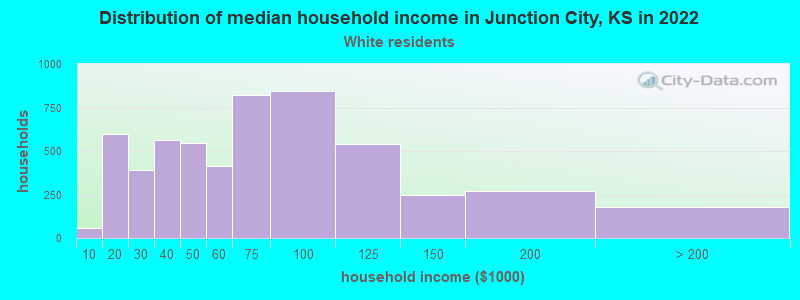
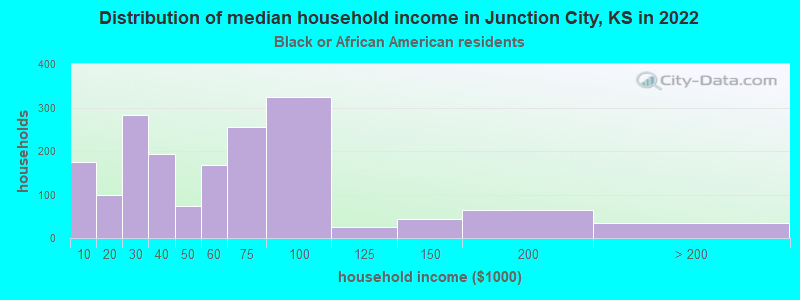
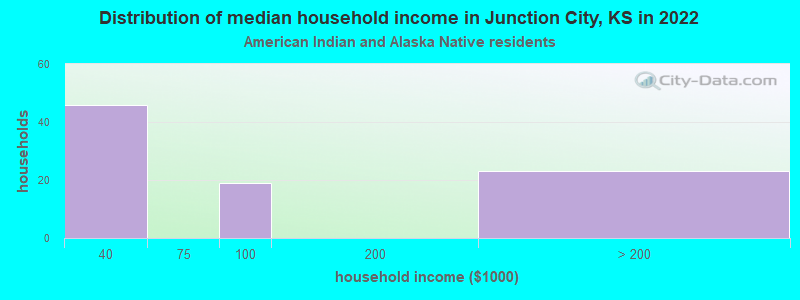
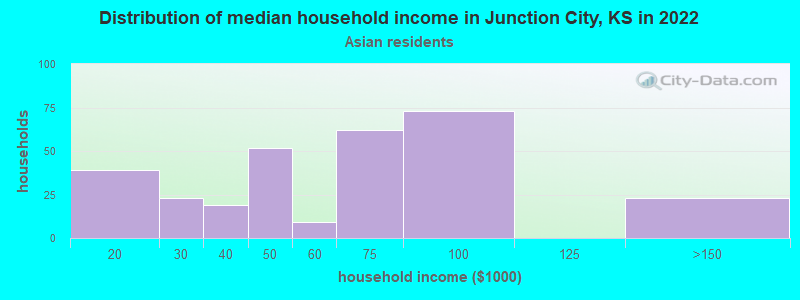
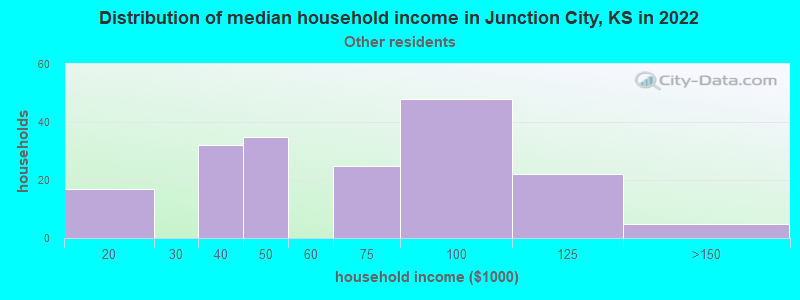
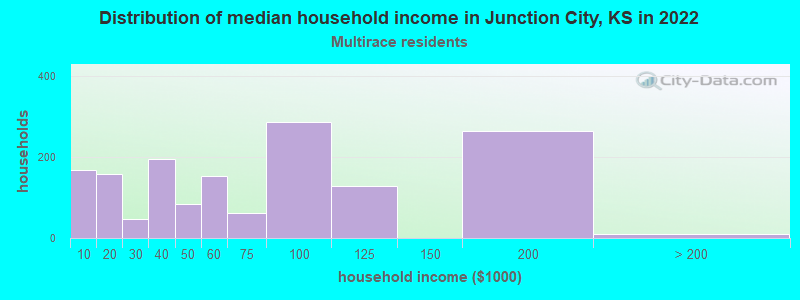
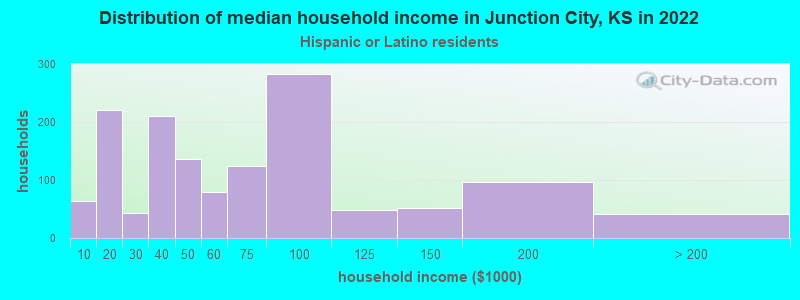
Income and house value in Junction City Median household income in 2022 $63,945 White non-Hispanic householders$52,295 Black householders$73,832 Asian householders$65,424 Some other race householders$58,431 Two or more races householders$54,934 Hispanic or Latino race householdersMedian 2022 house value $185,505 White Non-Hispanic householders$177,927 Black or African American householders$191,679 American Indian or Alaska Native householders $165,579 Asian householders$210,482 Native Hawaiian and other Pacific Islander householders$145,092 Some other race householders$238,546 Two or more races householders$158,282 Hispanic or Latino householders
Median age by race in Junction City
31.0 Median age for White residents29.9 31.9 29.1 Median age for Black or African American residents28.8 29.5 29.6 Median age for American Indian / Alaska Native residents31.4 22.6 50.3 Median age for Asian residents27.4 53.0 15.9 Median age for Native Hawaiian / Pacific Islander residents16.8 29.1 22.9 Median age for Other race residents16.0 35.0 23.5 Median age for Two or more races residents18.4 30.0 31.6 Median age for White alone residents31.3 32.0 25.7 Median age for Hispanic or Latino residents23.9 28.5
Owner/renter occupied households by race in Junction City
House owners and renters - White residents 3,085 56.3% Owner occupied2,394 43.7% Renter occupiedHouse owners and renters - Black or African American residents 595 35.3% Owner occupied1,092 64.7% Renter occupiedHouse owners and renters - American Indian / Alaska Native residents 55 63.8% Owner occupied31 36.2% Renter occupiedHouse owners and renters - Asian residents 221 66.5% Owner occupied111 33.5% Renter occupiedHouse owners and renters - Native Hawaiian / Pacific Islander residents 39 100.0% Renter occupiedHouse owners and renters - Other race residents 96 54.3% Owner occupied81 45.7% Renter occupiedHouse owners and renters - Two or more races residents 745 48.5% Owner occupied792 51.5% Renter occupiedHouse owners and renters - White alone residents 2,961 58.5% Owner occupied2,097 41.5% Renter occupiedHouse owners and renters - Hispanic or Latino residents 467 33.8% Owner occupied916 66.2% Renter occupied
Language usage in Junction City
English speakers - Total 84.4% of residents of Junction City speak English at home.
9.6% of residents speak Spanish at home 1,283 64.2% Speak English very well714 35.8% Speak English less than very well5.8% of residents speak other language at home 706 58.1% Speak English very well509 41.9% Speak English less than very well
English speakers - Born in the United States 88.7% of residents of Junction City speak English at home.
8.2% of residents speak Spanish at home 673 78.6% Speak English very well183 21.4% Speak English less than very well3.0% of residents speak other language at home 164 53.1% Speak English very well145 46.9% Speak English less than very well
English speakers - Native, born elsewhere 60.9% of residents of Junction City speak English at home.
35.5% of residents speak Spanish at home 244 55.0% Speak English very well200 45.0% Speak English less than very well3.3% of residents speak other language at home 41 100.0% Speak English very well
English speakers - Foreign-born 22.6% of residents of Junction City speak English at home.
33.1% of residents speak Spanish at home 237 40.9% Speak English very well343 59.1% Speak English less than very well44.2% of residents speak other language at home 425 54.9% Speak English very well349 45.1% Speak English less than very well
White (Caucasian) - Speak only English Native:
95.0% (10,626)Foreign-born:
76.3% (219)
White (Caucasian) - Speak another language Native:
4.0% (449)Foreign-born:
41.8% (120)
Black or African American - Speak only English Native:
95.4% (3,431)Foreign-born:
21.1% (37)
Black or African American - Speak another language Native:
4.7% (170)Foreign-born:
79.0% (140)
Asian - Speak only English Native:
100.0% (281)Foreign-born:
16.7% (68)
Asian - Speak another language Native:
7.1% (20)Foreign-born:
83.3% (340)
Native Hawaiian / Pacific Islander - Speak another language Native:
19.2% (71)Foreign-born:
85.0% (150)
Other race - Speak another language Native:
72.4% (664)Foreign-born:
96.6% (126)
Two or more races - Speak only English Native:
81.3% (2,477)Foreign-born:
2.6% (21)
Two or more races - Speak another language Native:
18.4% (561)Foreign-born:
98.2% (769)
White alone - Speak only English Native:
96.9% (9,832)Foreign-born:
49.1% (180)
White alone - Speak another language Native:
2.8% (287)Foreign-born:
49.8% (182)
Hispanic or Latino - Speak only English Native:
58.3% (1,732)Foreign-born:
11.7% (79)
Hispanic or Latino - Speak another language Native:
41.8% (1,242)Foreign-born:
89.3% (605)
Foreign-born residents in Junction City 1,782 residents are foreign born (3.0% Latin America , 2.1% Asia , 1.6% Europe ).
This city:
7.8%Kansas:
7.1%
Marital status for residents in Junction City Marital status - White (Caucasian) population 15 years and over
Males 27.4% Never married59.7% Now married2.1% Separated0.8% Widowed10.0% DivorcedFemales 20.1% Never married52.5% Now married2.1% Separated8.9% Widowed16.4% DivorcedWomen who gave birth in the past 12 months Now married:
87.6% (141)Unmarried:
12.4% (20)
Women who did not give birth in the past 12 months Now married:
52.7% (1,527)Unmarried:
47.3% (1,373)
Marital status - Black or African American population 15 years and over
Males 41.5% Never married44.4% Now married1.5% Separated0.0% Widowed12.6% DivorcedFemales 32.4% Never married41.1% Now married5.9% Separated3.3% Widowed17.3% DivorcedWomen who gave birth in the past 12 months Now married:
100.0% (47)Unmarried:
0.0% (0)
Women who did not give birth in the past 12 months Now married:
40.4% (375)Unmarried:
59.6% (554)
Marital status - American Indian / Alaska Native population 15 years and over
Males 52.2% Never married23.1% Now married0.0% Separated9.7% Widowed14.9% DivorcedFemales 0.0% Never married76.7% Now married0.0% Separated23.3% Widowed0.0% DivorcedWomen who did not give birth in the past 12 months Now married:
100.0% (37)Unmarried:
0.0% (0)
Marital status - Asian population 15 years and over
Males 47.6% Never married36.5% Now married9.1% Separated0.0% Widowed6.7% DivorcedFemales 13.1% Never married62.0% Now married0.0% Separated13.9% Widowed10.9% DivorcedWomen who did not give birth in the past 12 months Now married:
50.0% (91)Unmarried:
50.0% (91)
Marital status - Native Hawaiian / Pacific Islander population 15 years and over
Males 73.6% Never married26.4% Now married0.0% Separated0.0% Widowed0.0% DivorcedFemales 31.0% Never married69.0% Now married0.0% Separated0.0% Widowed0.0% DivorcedWomen who did not give birth in the past 12 months Now married:
55.0% (23)Unmarried:
45.0% (19)
Marital status - Other race population 15 years and over
Males 26.8% Never married50.4% Now married10.1% Separated0.0% Widowed12.7% DivorcedFemales 18.5% Never married75.6% Now married0.0% Separated0.0% Widowed5.9% DivorcedWomen who gave birth in the past 12 months Now married:
100.0% (33)Unmarried:
0.0% (0)
Women who did not give birth in the past 12 months Now married:
75.5% (148)Unmarried:
24.5% (48)
Marital status - Two or more races population 15 years and over
Males 41.2% Never married52.4% Now married0.0% Separated0.0% Widowed6.4% DivorcedFemales 21.6% Never married52.9% Now married4.7% Separated9.2% Widowed11.6% DivorcedWomen who gave birth in the past 12 months Now married:
61.5% (131)Unmarried:
38.5% (82)
Women who did not give birth in the past 12 months Now married:
62.4% (536)Unmarried:
37.6% (323)
Marital status - White alone, not Hispanic / Latino population 15 years and over
Males 28.1% Never married59.1% Now married2.1% Separated0.9% Widowed9.9% DivorcedFemales 18.3% Never married52.0% Now married2.4% Separated9.6% Widowed17.8% DivorcedWomen who gave birth in the past 12 months Now married:
87.3% (142)Unmarried:
12.7% (21)
Women who did not give birth in the past 12 months Now married:
53.1% (1,395)Unmarried:
46.9% (1,233)
Marital status - Hispanic or Latino population 15 years and over
Males 28.1% Never married58.6% Now married3.1% Separated0.0% Widowed10.2% DivorcedFemales 25.0% Never married56.9% Now married1.3% Separated4.1% Widowed12.6% DivorcedWomen who gave birth in the past 12 months Now married:
70.8% (120)Unmarried:
29.2% (50)
Women who did not give birth in the past 12 months Now married:
58.3% (503)Unmarried:
41.7% (359)
Ancestries in Junction City
1,717 15.5% German586 5.3% English557 5.0% American230 2.1% Scottish207 1.9% European172 1.6% Irish171 1.5% West Indian157 1.4% Swedish115 1.0% Scandinavian111 1.0% French109 1.0% Italian91 0.8% Czech91 0.8% African75 0.7% Norwegian60 0.5% Jamaican56 0.5% Ghanaian40 0.4% Russian39 0.4% French Canadian39 0.4% Lithuanian36 0.3% Polish36 0.3% Scotch-Irish36 0.3% Ethiopian20 0.2% Belgian13 0.1% British13 0.1% Canadian13 0.1% German Russian11 0.10% Nigerian10 0.09% Swiss9 0.08% Pennsylvania German7 0.06% Dutch7 0.06% Romanian6 0.05% Northern European4 0.04% Welsh
Geographical mobility in Junction City Same house 1 year ago 9,535 76.9% White (Caucasian)2,535 62.9% Black or African American195 79.7% American Indian / Alaska Native620 89.8% Asian175 58.2% Native Hawaiian / Pacific Islander905 89.1% Other race2,967 66.8% Two or more races8,744 77.2% White alone, not Hispanic / Latino3,031 77.2% Hispanic or LatinoMoved within same county 1,162 9.4% White / Caucasian553 13.7% Black or African American9 3.6% American Indian / Alaska Native27 4.0% Asian88 29.1% Native Hawaiian / Pacific Islander51 5.0% Other race419 9.4% Two or more races1,062 9.4% White alone, not Hispanic / Latino304 7.8% Hispanic or LatinoMoved within same state 490 4.0% White / Caucasian476 11.8% Black or African American37 5.4% Asian10 1.0% Other race76 1.7% Two or more races486 4.3% White alone, not Hispanic / Latino42 1.1% Hispanic or LatinoMoved from different state 1,002 8.1% White / Caucasian327 8.1% Black or African American54 22.2% American Indian / Alaska Native12 3.9% Native Hawaiian / Pacific Islander31 3.1% Other race647 14.6% Two or more races863 7.6% White alone, not Hispanic / Latino289 7.4% Hispanic or LatinoMoved from abroad 139 1.1% White85 2.1% Black or African American17 5.5% Native Hawaiian / Pacific Islander409 9.2% Two or more races115 1.0% White alone, not Hispanic / Latino264 6.7% Hispanic or Latino
Children Nativity (place of birth) in Junction City
Children under 6 years - Living with two parents Both parents native 1,502 100.0% Native0 0.0% Foreign-bornBoth parents foreign-born 79 70.5% Native33 29.5% Foreign-bornOne native, one foreign-born parent 41 100.0% NativeChildren under 6 years - Living with one parent Native parent 686 100.0% NativeChildren 6 to 17 years - Living with two parents Both parents native 1,583 100.0% NativeBoth parents foreign-born 34 36.3% Native59 63.7% Foreign-bornOne native, one foreign-born parent 152 100.0% NativeChildren 6 to 17 years - Living with one parent Native parent 1,741 100.0% NativeForeign-born parent 193 50.2% Native192 49.8% Foreign-born
Grandparents responsible for own grandchildren in Junction City
Grandparents (30 to 59 years) White / Caucasian 30 56.8% Responsible for grandchildren23 43.2% Not responsible for grandchildrenBlack or African American 93 94.9% Responsible for grandchildren5 5.1% Not responsible for grandchildrenAsian 45 100.0% Not responsible for grandchildrenTwo or more races 19 100.0% Not responsible for grandchildrenWhite alone, not Hispanic / Latino 31 56.2% Responsible for grandchildren24 43.8% Not responsible for grandchildrenHispanic or Latino 18 100.0% Not responsible for grandchildrenGrandparents (60 years and over) White / Caucasian 10 13.4% Responsible for grandchildren64 86.6% Not responsible for grandchildrenBlack or African American 5 100.0% Not responsible for grandchildrenAsian 27 100.0% Responsible for grandchildrenWhite alone, not Hispanic / Latino 10 12.7% Responsible for grandchildren70 87.3% Not responsible for grandchildren