Races in Johnson City, New York (NY) Detailed Stats
Data:
Races - White alone (%)
Races - White alone (% change since 2000)
Races - Black alone (%)
Races - Black alone (% change since 2000)
Races - American Indian alone (%)
Races - American Indian alone (% change since 2000)
Races - Asian alone (%)
Races - Asian alone (% change since 2000)
Races - Hispanic (%)
Races - Hispanic (% change since 2000)
Races - Native Hawaiian and Other Pacific Islander alone (%)
Races - Native Hawaiian and Other Pacific Islander alone (% change since 2000)
Races - Two or more races(%)
Races - Two or more races(% change since 2000)
Races - Other race alone (%)
Races - Other race alone (% change since 2000)
Racial diversity
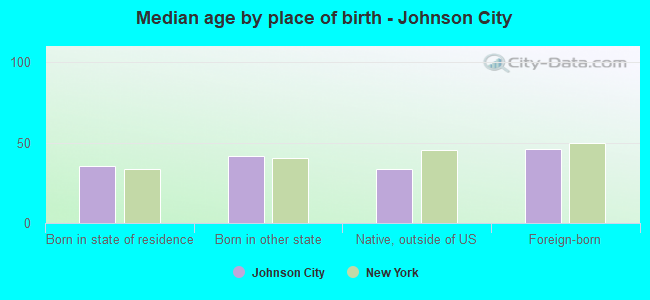
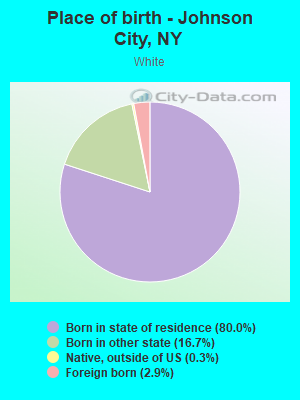
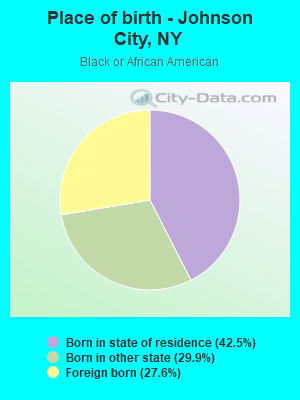
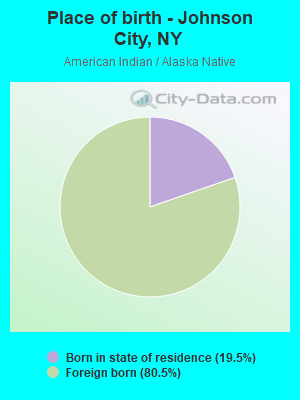
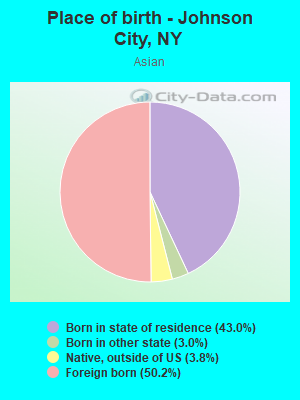
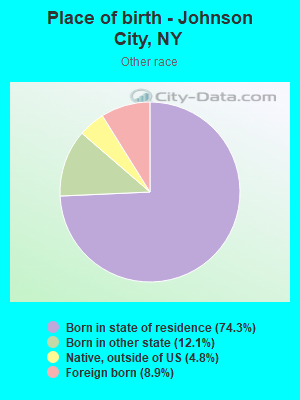
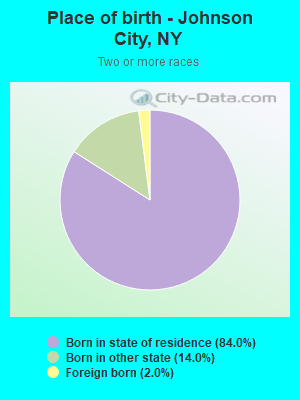
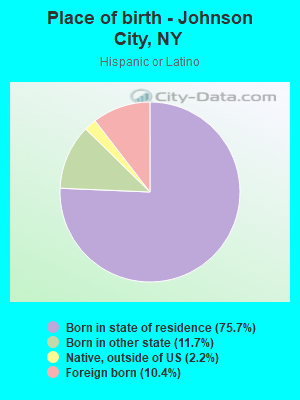
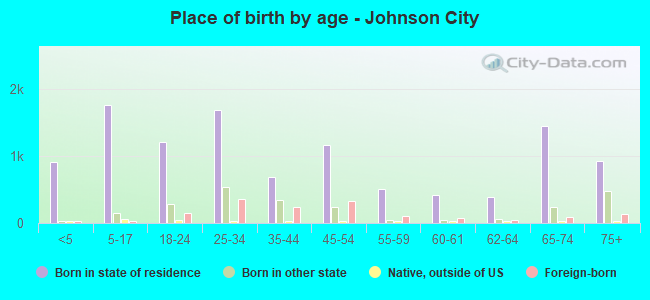
Place of birth - Born in state of residence (%)
Place of birth - Born in state of residence (%) - White
Place of birth - Born in state of residence (%) - Black or African American
Place of birth - Born in state of residence (%) - Asian
Place of birth - Born in state of residence (%) - Hispanic or Latino
Place of birth - Born in state of residence (%) - American Indian and Alaska Native
Place of birth - Born in state of residence (%) - Multirace
Place of birth - Born in state of residence (%) - Other Race
Place of birth - Born in other state (%)
Place of birth - Born in other state (%) - White
Place of birth - Born in other state (%) - Black or African American
Place of birth - Born in other state (%) - Asian
Place of birth - Born in other state (%) - Hispanic or Latino
Place of birth - Born in other state (%) - American Indian and Alaska Native
Place of birth - Born in other state (%) - Multirace
Place of birth - Born in other state (%) - Other Race
Place of birth - Native, outside of US (%)
Place of birth - Native, outside of US (%) - White
Place of birth - Native, outside of US (%) - Black or African American
Place of birth - Native, outside of US (%) - Asian
Place of birth - Native, outside of US (%) - Hispanic or Latino
Place of birth - Native, outside of US (%) - American Indian and Alaska Native
Place of birth - Native, outside of US (%) - Multirace
Place of birth - Native, outside of US (%) - Other Race
Place of birth - Foreign born (%)
Place of birth - Foreign born (%) - White
Place of birth - Foreign born (%) - Black or African American
Place of birth - Foreign born (%) - Asian
Place of birth - Foreign born (%) - Hispanic or Latino
Place of birth - Foreign born (%) - American Indian and Alaska Native
Place of birth - Foreign born (%) - Multirace
Place of birth - Foreign born (%) - Other Race
Residents speaking English at home (%)
Residents speaking English at home - Born in the United States (%)
Residents speaking English at home - Native, born elsewhere (%)
Residents speaking English at home - Foreign born (%)
Residents speaking Spanish at home (%)
Residents speaking Spanish at home - Born in the United States (%)
Residents speaking Spanish at home - Native, born elsewhere (%)
Residents speaking Spanish at home - Foreign born (%)
Residents speaking other language at home (%)
Residents speaking other language at home - Born in the United States (%)
Residents speaking other language at home - Native, born elsewhere (%)
Residents speaking other language at home - Foreign born (%)
Marital status - Never married (%)
Marital status - Now married (%)
Marital status - Separated (%)
Marital status - Widowed (%)
Marital status - Divorced (%)
Ancestries Reported - Arab (%)
Ancestries Reported - Czech (%)
Ancestries Reported - Danish (%)
Ancestries Reported - Dutch (%)
Ancestries Reported - English (%)
Ancestries Reported - French (%)
Ancestries Reported - French Canadian (%)
Ancestries Reported - German (%)
Ancestries Reported - Greek (%)
Ancestries Reported - Hungarian (%)
Ancestries Reported - Irish (%)
Ancestries Reported - Italian (%)
Ancestries Reported - Lithuanian (%)
Ancestries Reported - Norwegian (%)
Ancestries Reported - Polish (%)
Ancestries Reported - Portuguese (%)
Ancestries Reported - Russian (%)
Ancestries Reported - Scotch-Irish (%)
Ancestries Reported - Scottish (%)
Ancestries Reported - Slovak (%)
Ancestries Reported - Subsaharan African (%)
Ancestries Reported - Swedish (%)
Ancestries Reported - Swiss (%)
Ancestries Reported - Ukrainian (%)
Ancestries Reported - United States (%)
Ancestries Reported - Welsh (%)
Ancestries Reported - West Indian (%)
Ancestries Reported - Other (%)
Geographical mobility - Same house 1 year ago (%)
Geographical mobility - Same house 1 year ago (%) - White
Geographical mobility - Same house 1 year ago (%) - Black or African American
Geographical mobility - Same house 1 year ago (%) - Asian
Geographical mobility - Same house 1 year ago (%) - Hispanic or Latino
Geographical mobility - Same house 1 year ago (%) - American Indian and Alaska Native
Geographical mobility - Same house 1 year ago (%) - Multirace
Geographical mobility - Same house 1 year ago (%) - Other Race
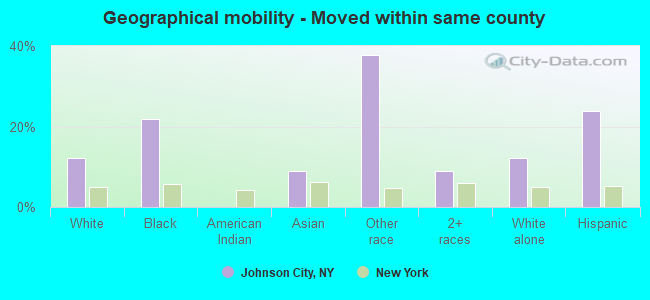
Geographical mobility - Moved within same county (%)
Geographical mobility - Moved within same county (%) - White
Geographical mobility - Moved within same county (%) - Black or African American
Geographical mobility - Moved within same county (%) - Asian
Geographical mobility - Moved within same county (%) - Hispanic or Latino
Geographical mobility - Moved within same county (%) - American Indian and Alaska Native
Geographical mobility - Moved within same county (%) - Multirace
Geographical mobility - Moved within same county (%) - Other Race
Geographical mobility - Moved from different county within same state (%)
Geographical mobility - Moved from different county within same state (%) - White
Geographical mobility - Moved from different county within same state (%) - Black or African American
Geographical mobility - Moved from different county within same state (%) - Asian
Geographical mobility - Moved from different county within same state (%) - Hispanic or Latino
Geographical mobility - Moved from different county within same state (%) - American Indian and Alaska Native
Geographical mobility - Moved from different county within same state (%) - Multirace
Geographical mobility - Moved from different county within same state (%) - Other Race
Geographical mobility - Moved from different state (%)
Geographical mobility - Moved from different state (%) - White
Geographical mobility - Moved from different state (%) - Black or African American
Geographical mobility - Moved from different state (%) - Asian
Geographical mobility - Moved from different state (%) - Hispanic or Latino
Geographical mobility - Moved from different state (%) - American Indian and Alaska Native
Geographical mobility - Moved from different state (%) - Multirace
Geographical mobility - Moved from different state (%) - Other Race
Geographical mobility - Moved from abroad (%)
Geographical mobility - Moved from abroad (%) - White
Geographical mobility - Moved from abroad (%) - Black or African American
Geographical mobility - Moved from abroad (%) - Asian
Geographical mobility - Moved from abroad (%) - Hispanic or Latino
Geographical mobility - Moved from abroad (%) - American Indian and Alaska Native
Geographical mobility - Moved from abroad (%) - Multirace
Geographical mobility - Moved from abroad (%) - Other Race
Place of birth for the foreign-born population - Ireland (%)
Place of birth for the foreign-born population - Denmark (%)
Place of birth for the foreign-born population - Norway (%)
Place of birth for the foreign-born population - Sweden (%)
Place of birth for the foreign-born population - United Kingdom (%)
Place of birth for the foreign-born population - England (%)
Place of birth for the foreign-born population - Scotland (%)
Place of birth for the foreign-born population - Other Northern Europe (%)
Place of birth for the foreign-born population - Austria (%)
Place of birth for the foreign-born population - Belgium (%)
Place of birth for the foreign-born population - France (%)
Place of birth for the foreign-born population - Germany (%)
Place of birth for the foreign-born population - Netherlands (%)
Place of birth for the foreign-born population - Switzerland (%)
Place of birth for the foreign-born population - Other Western Europe (%)
Place of birth for the foreign-born population - Greece (%)
Place of birth for the foreign-born population - Italy (%)
Place of birth for the foreign-born population - Portugal (%)
Place of birth for the foreign-born population - Spain (%)
Place of birth for the foreign-born population - Other Southern Europe (%)
Place of birth for the foreign-born population - Albania (%)
Place of birth for the foreign-born population - Belarus (%)
Place of birth for the foreign-born population - Bosnia and Herzegovina (%)
Place of birth for the foreign-born population - Bulgaria (%)
Place of birth for the foreign-born population - Croatia (%)
Place of birth for the foreign-born population - Czechoslovakia (%)
Place of birth for the foreign-born population - Hungary (%)
Place of birth for the foreign-born population - Latvia (%)
Place of birth for the foreign-born population - Lithuania (%)
Place of birth for the foreign-born population - North Macedonia (Macedonia) (%)
Place of birth for the foreign-born population - Moldova (%)
Place of birth for the foreign-born population - Poland (%)
Place of birth for the foreign-born population - Romania (%)
Place of birth for the foreign-born population - Russia (%)
Place of birth for the foreign-born population - Serbia (%)
Place of birth for the foreign-born population - Ukraine (%)
Place of birth for the foreign-born population - Other Eastern Europe (%)
Place of birth for the foreign-born population - China (%)
Place of birth for the foreign-born population - Hong Kong (%)
Place of birth for the foreign-born population - Taiwan (%)
Place of birth for the foreign-born population - Japan (%)
Place of birth for the foreign-born population - Korea (%)
Place of birth for the foreign-born population - Other Eastern Asia (%)
Place of birth for the foreign-born population - Afghanistan (%)
Place of birth for the foreign-born population - Bangladesh (%)
Place of birth for the foreign-born population - India (%)
Place of birth for the foreign-born population - Iran (%)
Place of birth for the foreign-born population - Kazakhstan (%)
Place of birth for the foreign-born population - Nepal (%)
Place of birth for the foreign-born population - Pakistan (%)
Place of birth for the foreign-born population - Sri Lanka (%)
Place of birth for the foreign-born population - Uzbekistan (%)
Place of birth for the foreign-born population - Other South Central Asia (%)
Place of birth for the foreign-born population - Burma (%)
Place of birth for the foreign-born population - Cambodia (%)
Place of birth for the foreign-born population - Indonesia (%)
Place of birth for the foreign-born population - Laos (%)
Place of birth for the foreign-born population - Malaysia (%)
Place of birth for the foreign-born population - Philippines (%)
Place of birth for the foreign-born population - Singapore (%)
Place of birth for the foreign-born population - Thailand (%)
Place of birth for the foreign-born population - Vietnam (%)
Place of birth for the foreign-born population - Other South Eastern Asia (%)
Place of birth for the foreign-born population - Armenia (%)
Place of birth for the foreign-born population - Iraq (%)
Place of birth for the foreign-born population - Israel (%)
Place of birth for the foreign-born population - Jordan (%)
Place of birth for the foreign-born population - Kuwait (%)
Place of birth for the foreign-born population - Lebanon (%)
Place of birth for the foreign-born population - Saudi Arabia (%)
Place of birth for the foreign-born population - Syria (%)
Place of birth for the foreign-born population - Turkey (%)
Place of birth for the foreign-born population - Yemen (%)
Place of birth for the foreign-born population - Other Western Asia (%)
Place of birth for the foreign-born population - Eritrea (%)
Place of birth for the foreign-born population - Ethiopia (%)
Place of birth for the foreign-born population - Kenya (%)
Place of birth for the foreign-born population - Somalia (%)
Place of birth for the foreign-born population - Uganda (%)
Place of birth for the foreign-born population - Zimbabwe (%)
Place of birth for the foreign-born population - Other Eastern Africa (%)
Place of birth for the foreign-born population - Cameroon (%)
Place of birth for the foreign-born population - Congo (%)
Place of birth for the foreign-born population - Democratic Republic of Congo (Zaire) (%)
Place of birth for the foreign-born population - Other Middle Africa (%)
Place of birth for the foreign-born population - Egypt (%)
Place of birth for the foreign-born population - Morocco (%)
Place of birth for the foreign-born population - Sudan (%)
Place of birth for the foreign-born population - Other Northern Africa (%)
Place of birth for the foreign-born population - South Africa (%)
Place of birth for the foreign-born population - Other Southern Africa (%)
Place of birth for the foreign-born population - Cabo Verde (%)
Place of birth for the foreign-born population - Ghana (%)
Place of birth for the foreign-born population - Liberia (%)
Place of birth for the foreign-born population - Nigeria (%)
Place of birth for the foreign-born population - Senegal (%)
Place of birth for the foreign-born population - Sierra Leone (%)
Place of birth for the foreign-born population - Other Western Africa (%)
Place of birth for the foreign-born population - Australia (%)
Place of birth for the foreign-born population - New Zealand (%)
Place of birth for the foreign-born population - Fiji (%)
Place of birth for the foreign-born population - Micronesia (%)
Place of birth for the foreign-born population - Bahamas (%)
Place of birth for the foreign-born population - Barbados (%)
Place of birth for the foreign-born population - Cuba (%)
Place of birth for the foreign-born population - Dominica (%)
Place of birth for the foreign-born population - Dominican Republic (%)
Place of birth for the foreign-born population - Grenada (%)
Place of birth for the foreign-born population - Haiti (%)
Place of birth for the foreign-born population - Jamaica (%)
Place of birth for the foreign-born population - St. Vincent and the Grenadines (%)
Place of birth for the foreign-born population - Trinidad and Tobago (%)
Place of birth for the foreign-born population - West Indies (%)
Place of birth for the foreign-born population - Other Caribbean (%)
Place of birth for the foreign-born population - Belize (%)
Place of birth for the foreign-born population - Costa Rica (%)
Place of birth for the foreign-born population - El Salvador (%)
Place of birth for the foreign-born population - Guatemala (%)
Place of birth for the foreign-born population - Honduras (%)
Place of birth for the foreign-born population - Mexico (%)
Place of birth for the foreign-born population - Nicaragua (%)
Place of birth for the foreign-born population - Panama (%)
Place of birth for the foreign-born population - Other Central America (%)
Place of birth for the foreign-born population - Argentina (%)
Place of birth for the foreign-born population - Bolivia (%)
Place of birth for the foreign-born population - Brazil (%)
Place of birth for the foreign-born population - Chile (%)
Place of birth for the foreign-born population - Colombia (%)
Place of birth for the foreign-born population - Ecuador (%)
Place of birth for the foreign-born population - Guyana (%)
Place of birth for the foreign-born population - Peru (%)
Place of birth for the foreign-born population - Uruguay (%)
Place of birth for the foreign-born population - Venezuela (%)
Place of birth for the foreign-born population - Other South America (%)
Place of birth for the foreign-born population - Canada (%)
Place of birth for the foreign-born population - Other Northern America (%)
Place of birth for the foreign-born population - Other (%)
According to 2022 data, the most numerous races in Johnson City, NY are White alone (10,747 residents), Hispanic (859 residents), and Black alone (1,105 residents). 84.7% of Johnson City residents speak English at home. 10.5% of Johnson City, NY residents are foreign-born (5.3% born in Asia, 2.6% born in Europe, 1.4% born in Latin America), which is 110.4% less than the foreign-born rate of 22.0% across the entire state of New York.
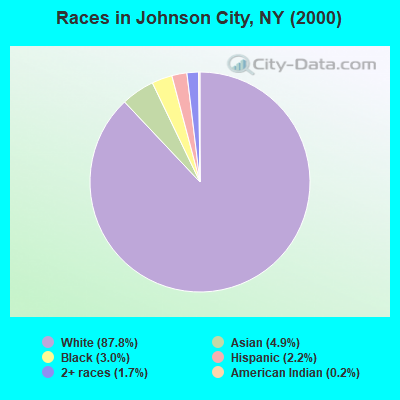
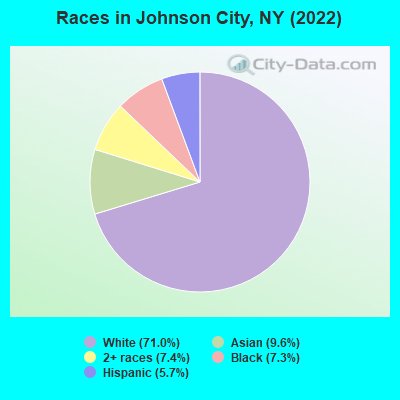
Race distribution in Johnson City
2000 2022
11,760,981 62.0% White alone 2,867,583 15.1% Hispanic 2,812,623 14.8% Black alone 1,035,926 5.5% Asian alone 366,116 1.9% Two or more races 75,499 0.4% Other race alone 52,499 0.3% American Indian alone 5,230 0.03% Native Hawaiian and Other
10,408,933 52.9% White alone 3,867,299 19.7% Hispanic 2,633,840 13.4% Black alone 1,776,286 9.0% Asian alone 732,670 3.7% Two or more races 216,110 1.1% Other race alone 35,082 0.2% American Indian alone 6,931 0.04% Native Hawaiian and Other
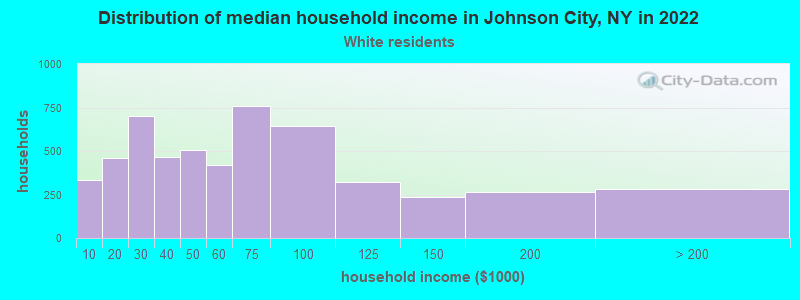
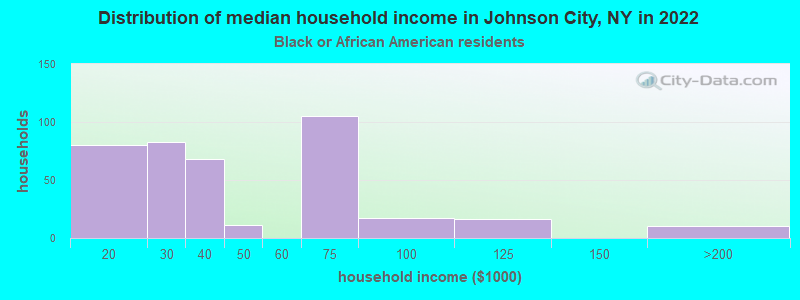
Income and house value in Johnson City Median household income in 2022 $54,519 White non-Hispanic householders$33,526 Black householders$72,667 Asian householders$64,457 Some other race householders$33,037 Two or more races householdersMedian 2022 house value $110,600 White Non-Hispanic householders$132,720 Black or African American householders $115,024 Asian householders$89,718 Two or more races householders
Median age by race in Johnson City
47.4 Median age for White residents44.2 50.0 29.8 Median age for Black or African American residents35.4 28.0 -703,989,703.3 Median age for American Indian / Alaska Native residents-665,450,121.0 -1,169,515,668.3 29.7 Median age for Asian residents25.4 33.6 -487,992,314.6 Median age for Native Hawaiian / Pacific Islander residents-477,502,295.2 -497,387,669.3 16.0 Median age for Other race residents4.9 34.4 15.6 Median age for Two or more races residents17.5 13.3 48.2 Median age for White alone residents44.5 50.6 16.9 Median age for Hispanic or Latino residents10.9 27.5
Owner/renter occupied households by race in Johnson City
House owners and renters - White residents 3,024 55.8% Owner occupied2,394 44.2% Renter occupiedHouse owners and renters - Black or African American residents 42 10.1% Owner occupied376 89.9% Renter occupiedHouse owners and renters - American Indian / Alaska Native residents 14 77.8% Owner occupied4 22.2% Renter occupiedHouse owners and renters - Asian residents 172 37.9% Owner occupied283 62.1% Renter occupiedHouse owners and renters - Other race residents 36 39.0% Owner occupied56 61.0% Renter occupiedHouse owners and renters - Two or more races residents 139 31.7% Owner occupied300 68.3% Renter occupiedHouse owners and renters - White alone residents 3,030 56.3% Owner occupied2,354 43.7% Renter occupiedHouse owners and renters - Hispanic or Latino residents 43 20.8% Owner occupied164 79.2% Renter occupied
Language usage in Johnson City
English speakers - Total 84.7% of residents of Johnson City speak English at home.
2.1% of residents speak Spanish at home 220 74.6% Speak English very well75 25.4% Speak English less than very well12.2% of residents speak other language at home 1,099 63.2% Speak English very well639 36.8% Speak English less than very well
English speakers - Born in the United States 87.5% of residents of Johnson City speak English at home.
3.2% of residents speak Spanish at home 78 100.0% Speak English very well7.8% of residents speak other language at home 177 94.1% Speak English very well11 5.9% Speak English less than very well
English speakers - Native, born elsewhere 9.6% of residents of Johnson City speak English at home.
29.8% of residents speak Spanish at home 28 100.0% Speak English very well118.1% of residents speak other language at home 90 81.1% Speak English very well21 18.9% Speak English less than very well
English speakers - Foreign-born 11.9% of residents of Johnson City speak English at home.
4.3% of residents speak Spanish at home 11 16.9% Speak English very well54 83.1% Speak English less than very well84.3% of residents speak other language at home 722 56.9% Speak English very well548 43.1% Speak English less than very well
White (Caucasian) - Speak only English Native:
99.3% (10,027)Foreign-born:
10.5% (33)
White (Caucasian) - Speak another language Native:
0.9% (88)Foreign-born:
89.2% (279)
Black or African American - Speak only English Native:
72.9% (528)Foreign-born:
16.3% (53)
Black or African American - Speak another language Native:
36.7% (266)Foreign-born:
85.8% (279)
Asian - Speak only English Native:
44.1% (293)Foreign-born:
12.3% (96)
Asian - Speak another language Native:
48.2% (320)Foreign-born:
87.5% (685)
Other race - Speak another language Native:
64.6% (211)Foreign-born:
66.3% (24)
Two or more races - Speak another language Native:
0.9% (11)Foreign-born:
100.0% (59)
White alone - Speak only English Native:
99.5% (9,938)Foreign-born:
9.6% (30)
White alone - Speak another language Native:
0.7% (73)Foreign-born:
89.9% (281)
Hispanic or Latino - Speak only English Native:
60.1% (394)Foreign-born:
13.3% (12)
Hispanic or Latino - Speak another language Native:
33.0% (217)Foreign-born:
71.0% (64)
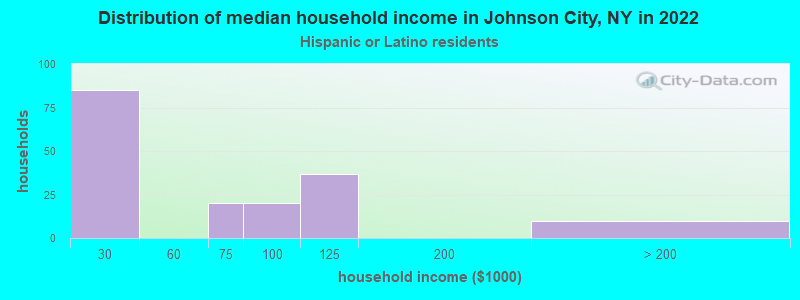
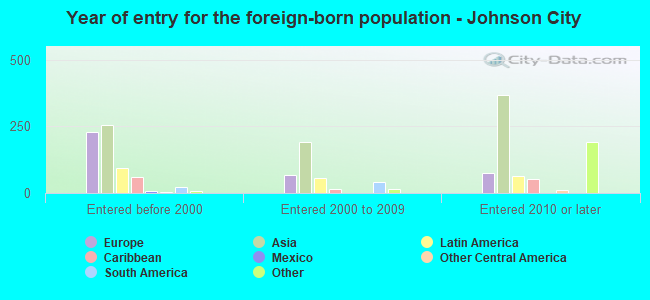
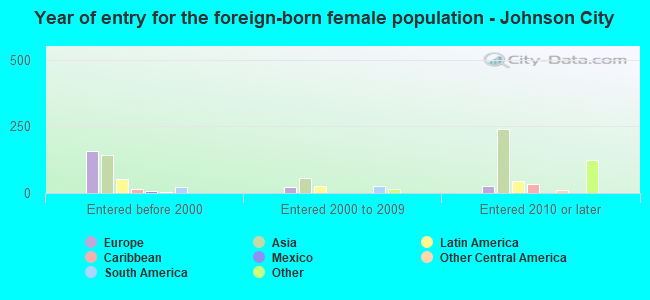
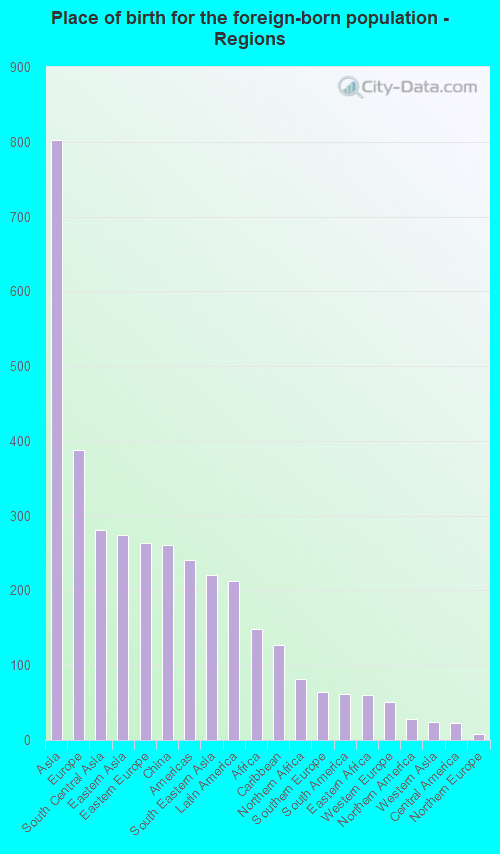
Foreign-born residents in Johnson City 1,582 residents are foreign born (5.3% Asia , 2.6% Europe , 1.4% Latin America ).
This city:
10.5%New York:
22.6%
Marital status for residents in Johnson City Marital status - White (Caucasian) population 15 years and over
Males 46.4% Never married40.1% Now married0.1% Separated4.8% Widowed8.6% DivorcedFemales 34.5% Never married37.9% Now married1.8% Separated15.1% Widowed10.6% DivorcedWomen who gave birth in the past 12 months Now married:
36.7% (39)Unmarried:
63.3% (67)
Women who did not give birth in the past 12 months Now married:
32.4% (696)Unmarried:
67.6% (1,454)
Marital status - Black or African American population 15 years and over
Males 42.1% Never married26.9% Now married0.0% Separated1.8% Widowed29.2% DivorcedFemales 83.1% Never married15.2% Now married0.0% Separated1.7% Widowed0.0% DivorcedWomen who gave birth in the past 12 months Now married:
100.0% (33)Unmarried:
0.0% (0)
Women who did not give birth in the past 12 months Now married:
10.8% (34)Unmarried:
89.2% (278)
Marital status - American Indian / Alaska Native population 15 years and over
Males 0.0% Never married100.0% Now married0.0% Separated0.0% Widowed0.0% DivorcedFemales 0.0% Never married100.0% Now married0.0% Separated0.0% Widowed0.0% DivorcedMarital status - Asian population 15 years and over
Males 54.6% Never married40.5% Now married2.8% Separated0.0% Widowed2.0% DivorcedFemales 51.9% Never married41.4% Now married3.2% Separated3.6% Widowed0.0% DivorcedWomen who gave birth in the past 12 months Now married:
100.0% (29)Unmarried:
0.0% (0)
Women who did not give birth in the past 12 months Now married:
30.4% (113)Unmarried:
69.6% (260)
Marital status - Other race population 15 years and over
Males 67.3% Never married32.7% Now married0.0% Separated0.0% Widowed0.0% DivorcedFemales 74.6% Never married25.4% Now married0.0% Separated0.0% Widowed0.0% DivorcedWomen who did not give birth in the past 12 months Now married:
22.4% (31)Unmarried:
77.6% (107)
Marital status - Two or more races population 15 years and over
Males 80.9% Never married12.1% Now married0.0% Separated1.8% Widowed5.3% DivorcedFemales 55.2% Never married21.5% Now married0.0% Separated5.8% Widowed17.5% DivorcedWomen who gave birth in the past 12 months Now married:
0.0% (0)Unmarried:
100.0% (46)
Women who did not give birth in the past 12 months Now married:
23.1% (29)Unmarried:
76.9% (96)
Marital status - White alone, not Hispanic / Latino population 15 years and over
Males 46.4% Never married39.9% Now married0.1% Separated4.9% Widowed8.7% DivorcedFemales 33.8% Never married38.2% Now married1.8% Separated15.3% Widowed10.8% DivorcedWomen who gave birth in the past 12 months Now married:
36.7% (39)Unmarried:
63.3% (68)
Women who did not give birth in the past 12 months Now married:
32.9% (691)Unmarried:
67.1% (1,410)
Marital status - Hispanic or Latino population 15 years and over
Males 57.1% Never married42.9% Now married0.0% Separated0.0% Widowed0.0% DivorcedFemales 64.0% Never married28.3% Now married0.0% Separated4.8% Widowed2.9% DivorcedWomen who did not give birth in the past 12 months Now married:
26.3% (55)Unmarried:
73.7% (153)
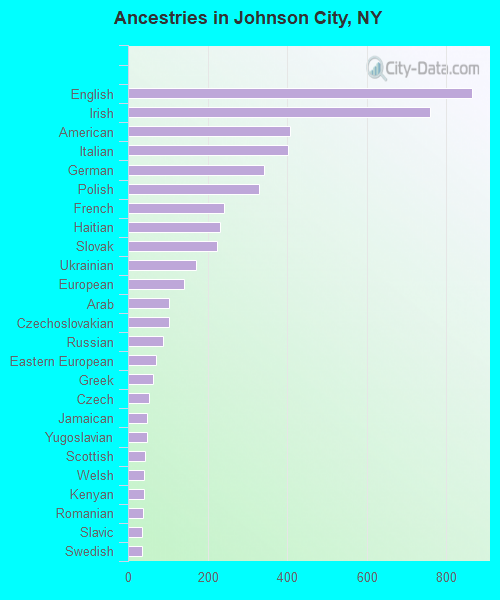
Ancestries in Johnson City
864 12.4% English759 10.9% Irish407 5.8% American401 5.7% Italian341 4.9% German330 4.7% Polish240 3.4% French232 3.3% Haitian223 3.2% Slovak171 2.5% Ukrainian141 2.0% European104 1.5% Arab102 1.5% Czechoslovakian88 1.3% Russian70 1.0% Eastern European63 0.9% Greek53 0.8% Czech49 0.7% Jamaican49 0.7% Yugoslavian42 0.6% Scottish40 0.6% Welsh39 0.6% Kenyan38 0.5% Romanian36 0.5% Slavic36 0.5% Swedish31 0.4% African29 0.4% Serbian24 0.3% French Canadian24 0.3% Swiss18 0.3% Bulgarian17 0.2% Scotch-Irish14 0.2% British13 0.2% Turkish12 0.2% Dutch11 0.2% Armenian11 0.2% Sudanese11 0.2% Iranian8 0.1% Norwegian7 0.1% Nigerian7 0.1% Lebanese6 0.09% Albanian
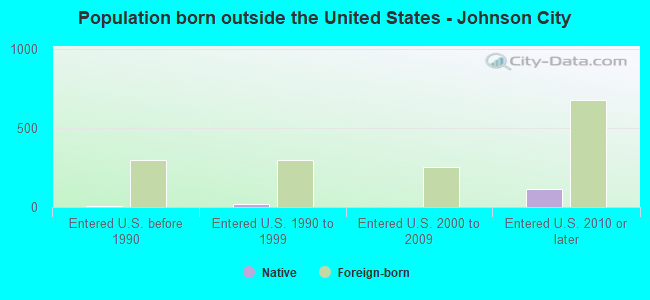
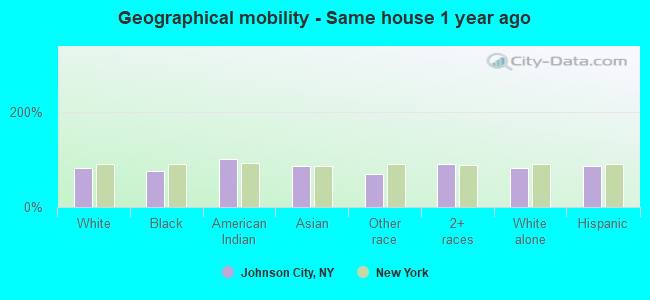
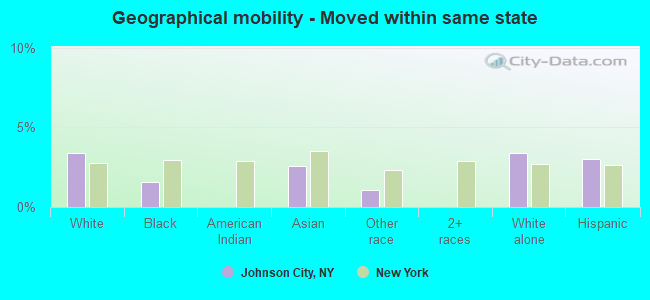
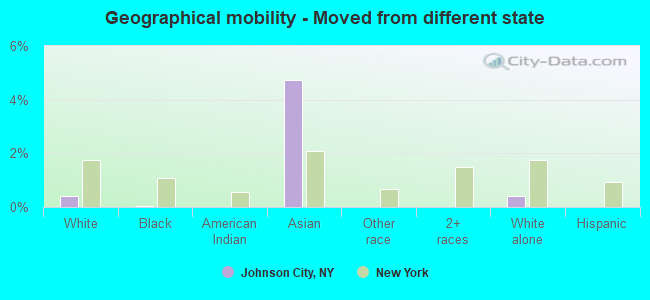
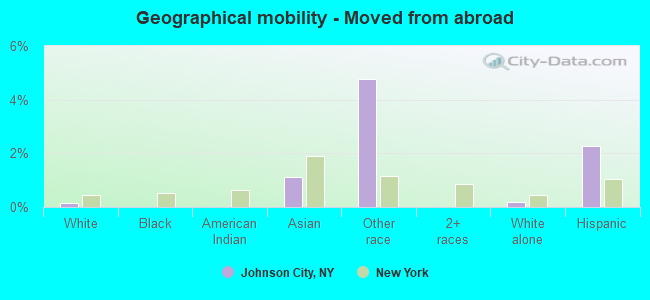
Geographical mobility in Johnson City Same house 1 year ago 8,871 82.0% White (Caucasian)838 75.9% Black or African American18 100.0% American Indian / Alaska Native1,198 84.7% Asian278 70.1% Other race1,204 89.8% Two or more races8,771 82.1% White alone, not Hispanic / Latino710 85.1% Hispanic or LatinoMoved within same county 1,304 12.1% White / Caucasian240 21.8% Black or African American126 8.9% Asian150 37.8% Other race121 9.0% Two or more races1,298 12.2% White alone, not Hispanic / Latino198 23.7% Hispanic or LatinoMoved within same state 365 3.4% White / Caucasian17 1.6% Black or African American36 2.6% Asian4 1.0% Other race360 3.4% White alone, not Hispanic / Latino25 3.0% Hispanic or LatinoMoved from different state 45 0.4% White / Caucasian0 0.0% Black or African American67 4.7% Asian45 0.4% White alone, not Hispanic / LatinoMoved from abroad 18 0.2% White16 1.1% Asian19 4.8% Other race20 0.2% White alone, not Hispanic / Latino19 2.3% Hispanic or Latino
Children Nativity (place of birth) in Johnson City
Children under 6 years - Living with two parents Both parents native 276 100.0% NativeBoth parents foreign-born 97 100.0% NativeOne native, one foreign-born parent 62 100.0% NativeChildren under 6 years - Living with one parent Native parent 652 100.0% NativeForeign-born parent 62 100.0% NativeChildren 6 to 17 years - Living with two parents Both parents native 601 100.0% NativeBoth parents foreign-born 139 93.8% Native9 6.2% Foreign-bornOne native, one foreign-born parent 47 100.0% NativeChildren 6 to 17 years - Living with one parent Native parent 691 100.0% NativeForeign-born parent 112 50.4% Native111 49.6% Foreign-born
Grandparents responsible for own grandchildren in Johnson City
Grandparents (30 to 59 years) White / Caucasian 3 2.6% Responsible for grandchildren99 97.4% Not responsible for grandchildrenAsian 9 100.0% Responsible for grandchildrenWhite alone, not Hispanic / Latino 3 2.7% Responsible for grandchildren99 97.3% Not responsible for grandchildrenGrandparents (60 years and over) White / Caucasian 45 49.7% Responsible for grandchildren46 50.3% Not responsible for grandchildrenAsian 23 100.0% Not responsible for grandchildrenWhite alone, not Hispanic / Latino 45 48.6% Responsible for grandchildren48 51.4% Not responsible for grandchildren