Races in Jenks, Oklahoma (OK) Detailed Stats
Data:
Races - White alone (%)
Races - White alone (% change since 2000)
Races - Black alone (%)
Races - Black alone (% change since 2000)
Races - American Indian alone (%)
Races - American Indian alone (% change since 2000)
Races - Asian alone (%)
Races - Asian alone (% change since 2000)
Races - Hispanic (%)
Races - Hispanic (% change since 2000)
Races - Native Hawaiian and Other Pacific Islander alone (%)
Races - Native Hawaiian and Other Pacific Islander alone (% change since 2000)
Races - Two or more races(%)
Races - Two or more races(% change since 2000)
Races - Other race alone (%)
Races - Other race alone (% change since 2000)
Racial diversity
Place of birth - Born in state of residence (%)
Place of birth - Born in state of residence (%) - White
Place of birth - Born in state of residence (%) - Black or African American
Place of birth - Born in state of residence (%) - Asian
Place of birth - Born in state of residence (%) - Hispanic or Latino
Place of birth - Born in state of residence (%) - American Indian and Alaska Native
Place of birth - Born in state of residence (%) - Multirace
Place of birth - Born in state of residence (%) - Other Race
Place of birth - Born in other state (%)
Place of birth - Born in other state (%) - White
Place of birth - Born in other state (%) - Black or African American
Place of birth - Born in other state (%) - Asian
Place of birth - Born in other state (%) - Hispanic or Latino
Place of birth - Born in other state (%) - American Indian and Alaska Native
Place of birth - Born in other state (%) - Multirace
Place of birth - Born in other state (%) - Other Race
Place of birth - Native, outside of US (%)
Place of birth - Native, outside of US (%) - White
Place of birth - Native, outside of US (%) - Black or African American
Place of birth - Native, outside of US (%) - Asian
Place of birth - Native, outside of US (%) - Hispanic or Latino
Place of birth - Native, outside of US (%) - American Indian and Alaska Native
Place of birth - Native, outside of US (%) - Multirace
Place of birth - Native, outside of US (%) - Other Race
Place of birth - Foreign born (%)
Place of birth - Foreign born (%) - White
Place of birth - Foreign born (%) - Black or African American
Place of birth - Foreign born (%) - Asian
Place of birth - Foreign born (%) - Hispanic or Latino
Place of birth - Foreign born (%) - American Indian and Alaska Native
Place of birth - Foreign born (%) - Multirace
Place of birth - Foreign born (%) - Other Race
Residents speaking English at home (%)
Residents speaking English at home - Born in the United States (%)
Residents speaking English at home - Native, born elsewhere (%)
Residents speaking English at home - Foreign born (%)
Residents speaking Spanish at home (%)
Residents speaking Spanish at home - Born in the United States (%)
Residents speaking Spanish at home - Native, born elsewhere (%)
Residents speaking Spanish at home - Foreign born (%)
Residents speaking other language at home (%)
Residents speaking other language at home - Born in the United States (%)
Residents speaking other language at home - Native, born elsewhere (%)
Residents speaking other language at home - Foreign born (%)
Marital status - Never married (%)
Marital status - Now married (%)
Marital status - Separated (%)
Marital status - Widowed (%)
Marital status - Divorced (%)
Ancestries Reported - Arab (%)
Ancestries Reported - Czech (%)
Ancestries Reported - Danish (%)
Ancestries Reported - Dutch (%)
Ancestries Reported - English (%)
Ancestries Reported - French (%)
Ancestries Reported - French Canadian (%)
Ancestries Reported - German (%)
Ancestries Reported - Greek (%)
Ancestries Reported - Hungarian (%)
Ancestries Reported - Irish (%)
Ancestries Reported - Italian (%)
Ancestries Reported - Lithuanian (%)
Ancestries Reported - Norwegian (%)
Ancestries Reported - Polish (%)
Ancestries Reported - Portuguese (%)
Ancestries Reported - Russian (%)
Ancestries Reported - Scotch-Irish (%)
Ancestries Reported - Scottish (%)
Ancestries Reported - Slovak (%)
Ancestries Reported - Subsaharan African (%)
Ancestries Reported - Swedish (%)
Ancestries Reported - Swiss (%)
Ancestries Reported - Ukrainian (%)
Ancestries Reported - United States (%)
Ancestries Reported - Welsh (%)
Ancestries Reported - West Indian (%)
Ancestries Reported - Other (%)
Geographical mobility - Same house 1 year ago (%)
Geographical mobility - Same house 1 year ago (%) - White
Geographical mobility - Same house 1 year ago (%) - Black or African American
Geographical mobility - Same house 1 year ago (%) - Asian
Geographical mobility - Same house 1 year ago (%) - Hispanic or Latino
Geographical mobility - Same house 1 year ago (%) - American Indian and Alaska Native
Geographical mobility - Same house 1 year ago (%) - Multirace
Geographical mobility - Same house 1 year ago (%) - Other Race
Geographical mobility - Moved within same county (%)
Geographical mobility - Moved within same county (%) - White
Geographical mobility - Moved within same county (%) - Black or African American
Geographical mobility - Moved within same county (%) - Asian
Geographical mobility - Moved within same county (%) - Hispanic or Latino
Geographical mobility - Moved within same county (%) - American Indian and Alaska Native
Geographical mobility - Moved within same county (%) - Multirace
Geographical mobility - Moved within same county (%) - Other Race
Geographical mobility - Moved from different county within same state (%)
Geographical mobility - Moved from different county within same state (%) - White
Geographical mobility - Moved from different county within same state (%) - Black or African American
Geographical mobility - Moved from different county within same state (%) - Asian
Geographical mobility - Moved from different county within same state (%) - Hispanic or Latino
Geographical mobility - Moved from different county within same state (%) - American Indian and Alaska Native
Geographical mobility - Moved from different county within same state (%) - Multirace
Geographical mobility - Moved from different county within same state (%) - Other Race
Geographical mobility - Moved from different state (%)
Geographical mobility - Moved from different state (%) - White
Geographical mobility - Moved from different state (%) - Black or African American
Geographical mobility - Moved from different state (%) - Asian
Geographical mobility - Moved from different state (%) - Hispanic or Latino
Geographical mobility - Moved from different state (%) - American Indian and Alaska Native
Geographical mobility - Moved from different state (%) - Multirace
Geographical mobility - Moved from different state (%) - Other Race
Geographical mobility - Moved from abroad (%)
Geographical mobility - Moved from abroad (%) - White
Geographical mobility - Moved from abroad (%) - Black or African American
Geographical mobility - Moved from abroad (%) - Asian
Geographical mobility - Moved from abroad (%) - Hispanic or Latino
Geographical mobility - Moved from abroad (%) - American Indian and Alaska Native
Geographical mobility - Moved from abroad (%) - Multirace
Geographical mobility - Moved from abroad (%) - Other Race
Place of birth for the foreign-born population - Ireland (%)
Place of birth for the foreign-born population - Denmark (%)
Place of birth for the foreign-born population - Norway (%)
Place of birth for the foreign-born population - Sweden (%)
Place of birth for the foreign-born population - United Kingdom (%)
Place of birth for the foreign-born population - England (%)
Place of birth for the foreign-born population - Scotland (%)
Place of birth for the foreign-born population - Other Northern Europe (%)
Place of birth for the foreign-born population - Austria (%)
Place of birth for the foreign-born population - Belgium (%)
Place of birth for the foreign-born population - France (%)
Place of birth for the foreign-born population - Germany (%)
Place of birth for the foreign-born population - Netherlands (%)
Place of birth for the foreign-born population - Switzerland (%)
Place of birth for the foreign-born population - Other Western Europe (%)
Place of birth for the foreign-born population - Greece (%)
Place of birth for the foreign-born population - Italy (%)
Place of birth for the foreign-born population - Portugal (%)
Place of birth for the foreign-born population - Spain (%)
Place of birth for the foreign-born population - Other Southern Europe (%)
Place of birth for the foreign-born population - Albania (%)
Place of birth for the foreign-born population - Belarus (%)
Place of birth for the foreign-born population - Bosnia and Herzegovina (%)
Place of birth for the foreign-born population - Bulgaria (%)
Place of birth for the foreign-born population - Croatia (%)
Place of birth for the foreign-born population - Czechoslovakia (%)
Place of birth for the foreign-born population - Hungary (%)
Place of birth for the foreign-born population - Latvia (%)
Place of birth for the foreign-born population - Lithuania (%)
Place of birth for the foreign-born population - North Macedonia (Macedonia) (%)
Place of birth for the foreign-born population - Moldova (%)
Place of birth for the foreign-born population - Poland (%)
Place of birth for the foreign-born population - Romania (%)
Place of birth for the foreign-born population - Russia (%)
Place of birth for the foreign-born population - Serbia (%)
Place of birth for the foreign-born population - Ukraine (%)
Place of birth for the foreign-born population - Other Eastern Europe (%)
Place of birth for the foreign-born population - China (%)
Place of birth for the foreign-born population - Hong Kong (%)
Place of birth for the foreign-born population - Taiwan (%)
Place of birth for the foreign-born population - Japan (%)
Place of birth for the foreign-born population - Korea (%)
Place of birth for the foreign-born population - Other Eastern Asia (%)
Place of birth for the foreign-born population - Afghanistan (%)
Place of birth for the foreign-born population - Bangladesh (%)
Place of birth for the foreign-born population - India (%)
Place of birth for the foreign-born population - Iran (%)
Place of birth for the foreign-born population - Kazakhstan (%)
Place of birth for the foreign-born population - Nepal (%)
Place of birth for the foreign-born population - Pakistan (%)
Place of birth for the foreign-born population - Sri Lanka (%)
Place of birth for the foreign-born population - Uzbekistan (%)
Place of birth for the foreign-born population - Other South Central Asia (%)
Place of birth for the foreign-born population - Burma (%)
Place of birth for the foreign-born population - Cambodia (%)
Place of birth for the foreign-born population - Indonesia (%)
Place of birth for the foreign-born population - Laos (%)
Place of birth for the foreign-born population - Malaysia (%)
Place of birth for the foreign-born population - Philippines (%)
Place of birth for the foreign-born population - Singapore (%)
Place of birth for the foreign-born population - Thailand (%)
Place of birth for the foreign-born population - Vietnam (%)
Place of birth for the foreign-born population - Other South Eastern Asia (%)
Place of birth for the foreign-born population - Armenia (%)
Place of birth for the foreign-born population - Iraq (%)
Place of birth for the foreign-born population - Israel (%)
Place of birth for the foreign-born population - Jordan (%)
Place of birth for the foreign-born population - Kuwait (%)
Place of birth for the foreign-born population - Lebanon (%)
Place of birth for the foreign-born population - Saudi Arabia (%)
Place of birth for the foreign-born population - Syria (%)
Place of birth for the foreign-born population - Turkey (%)
Place of birth for the foreign-born population - Yemen (%)
Place of birth for the foreign-born population - Other Western Asia (%)
Place of birth for the foreign-born population - Eritrea (%)
Place of birth for the foreign-born population - Ethiopia (%)
Place of birth for the foreign-born population - Kenya (%)
Place of birth for the foreign-born population - Somalia (%)
Place of birth for the foreign-born population - Uganda (%)
Place of birth for the foreign-born population - Zimbabwe (%)
Place of birth for the foreign-born population - Other Eastern Africa (%)
Place of birth for the foreign-born population - Cameroon (%)
Place of birth for the foreign-born population - Congo (%)
Place of birth for the foreign-born population - Democratic Republic of Congo (Zaire) (%)
Place of birth for the foreign-born population - Other Middle Africa (%)
Place of birth for the foreign-born population - Egypt (%)
Place of birth for the foreign-born population - Morocco (%)
Place of birth for the foreign-born population - Sudan (%)
Place of birth for the foreign-born population - Other Northern Africa (%)
Place of birth for the foreign-born population - South Africa (%)
Place of birth for the foreign-born population - Other Southern Africa (%)
Place of birth for the foreign-born population - Cabo Verde (%)
Place of birth for the foreign-born population - Ghana (%)
Place of birth for the foreign-born population - Liberia (%)
Place of birth for the foreign-born population - Nigeria (%)
Place of birth for the foreign-born population - Senegal (%)
Place of birth for the foreign-born population - Sierra Leone (%)
Place of birth for the foreign-born population - Other Western Africa (%)
Place of birth for the foreign-born population - Australia (%)
Place of birth for the foreign-born population - New Zealand (%)
Place of birth for the foreign-born population - Fiji (%)
Place of birth for the foreign-born population - Micronesia (%)
Place of birth for the foreign-born population - Bahamas (%)
Place of birth for the foreign-born population - Barbados (%)
Place of birth for the foreign-born population - Cuba (%)
Place of birth for the foreign-born population - Dominica (%)
Place of birth for the foreign-born population - Dominican Republic (%)
Place of birth for the foreign-born population - Grenada (%)
Place of birth for the foreign-born population - Haiti (%)
Place of birth for the foreign-born population - Jamaica (%)
Place of birth for the foreign-born population - St. Vincent and the Grenadines (%)
Place of birth for the foreign-born population - Trinidad and Tobago (%)
Place of birth for the foreign-born population - West Indies (%)
Place of birth for the foreign-born population - Other Caribbean (%)
Place of birth for the foreign-born population - Belize (%)
Place of birth for the foreign-born population - Costa Rica (%)
Place of birth for the foreign-born population - El Salvador (%)
Place of birth for the foreign-born population - Guatemala (%)
Place of birth for the foreign-born population - Honduras (%)
Place of birth for the foreign-born population - Mexico (%)
Place of birth for the foreign-born population - Nicaragua (%)
Place of birth for the foreign-born population - Panama (%)
Place of birth for the foreign-born population - Other Central America (%)
Place of birth for the foreign-born population - Argentina (%)
Place of birth for the foreign-born population - Bolivia (%)
Place of birth for the foreign-born population - Brazil (%)
Place of birth for the foreign-born population - Chile (%)
Place of birth for the foreign-born population - Colombia (%)
Place of birth for the foreign-born population - Ecuador (%)
Place of birth for the foreign-born population - Guyana (%)
Place of birth for the foreign-born population - Peru (%)
Place of birth for the foreign-born population - Uruguay (%)
Place of birth for the foreign-born population - Venezuela (%)
Place of birth for the foreign-born population - Other South America (%)
Place of birth for the foreign-born population - Canada (%)
Place of birth for the foreign-born population - Other Northern America (%)
Place of birth for the foreign-born population - Other (%)
Latest news about races in Jenks, OK collected exclusively by city-data.com from local newspapers, TV, and radio stations
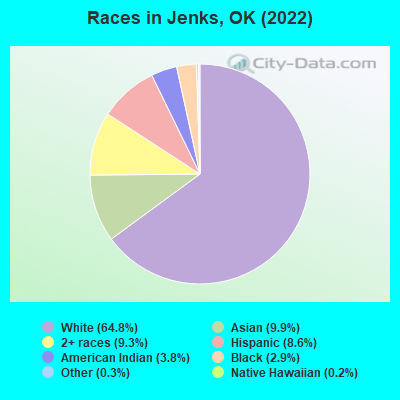
According to 2022 data, the most numerous races in Jenks, OK are White alone (16,975 residents), Hispanic (2,265 residents), and Two or more races (2,443 residents). 86.9% of Jenks residents speak English at home. 8.5% of Jenks, OK residents are foreign-born (6.2% born in Asia, 1.3% born in Latin America), which is 29.3% greater than the foreign-born rate of 6.0% across the entire state of Oklahoma.
Race distribution in Jenks
2000 2022
2,556,368 74.1% White alone 266,158 7.7% American Indian alone 257,981 7.5% Black alone 179,304 5.2% Hispanic 140,249 4.1% Two or more races 46,172 1.3% Asian alone 2,322 0.07% Other race alone 2,100 0.06% Native Hawaiian and Other
2,517,403 62.6% White alone 486,692 12.1% Hispanic 364,453 9.1% Two or more races 273,650 6.8% American Indian alone 268,543 6.7% Black alone 92,672 2.3% Asian alone 10,786 0.3% Other race alone 5,601 0.1% Native Hawaiian and Other
Income and house value in Jenks Median household income in 2022 $105,516 White non-Hispanic householders$49,962 Black householders$74,203 American Indian and Alaska Native householders$87,246 Asian householders$63,452 Some other race householders$104,900 Two or more races householders$107,994 Hispanic or Latino race householdersMedian 2022 house value $310,550 White Non-Hispanic householders$392,182 Black or African American householders$283,823 American Indian or Alaska Native householders $798,889 Asian householders$261,454 Some other race householders$296,605 Two or more races householders$286,147 Hispanic or Latino householders
Median age by race in Jenks
38.9 Median age for White residents38.0 40.0 24.2 Median age for Black or African American residents37.3 21.4 28.5 Median age for American Indian / Alaska Native residents23.6 33.4 25.2 Median age for Asian residents26.0 24.3 14.6 Median age for Native Hawaiian / Pacific Islander residents-662,177,328.2 -442,328,041.9 19.3 Median age for Other race residents11.6 25.0 24.4 Median age for Two or more races residents24.7 24.7 38.1 Median age for White alone residents37.3 39.3 22.1 Median age for Hispanic or Latino residents29.8 18.3
Owner/renter occupied households by race in Jenks
House owners and renters - White residents 5,281 80.8% Owner occupied1,256 19.2% Renter occupiedHouse owners and renters - Black or African American residents 152 47.7% Owner occupied167 52.3% Renter occupiedHouse owners and renters - American Indian / Alaska Native residents 362 90.9% Owner occupied36 9.1% Renter occupiedHouse owners and renters - Asian residents 480 85.7% Owner occupied80 14.3% Renter occupiedHouse owners and renters - Other race residents 46 87.9% Owner occupied6 12.1% Renter occupiedHouse owners and renters - Two or more races residents 623 62.2% Owner occupied378 37.8% Renter occupiedHouse owners and renters - White alone residents 5,288 80.3% Owner occupied1,300 19.7% Renter occupiedHouse owners and renters - Hispanic or Latino residents 309 73.2% Owner occupied113 26.8% Renter occupied
Language usage in Jenks
English speakers - Total 86.9% of residents of Jenks speak English at home.
4.9% of residents speak Spanish at home 799 67.1% Speak English very well392 32.9% Speak English less than very well8.1% of residents speak other language at home 1,036 52.7% Speak English very well930 47.3% Speak English less than very well
English speakers - Born in the United States 94.3% of residents of Jenks speak English at home.
3.1% of residents speak Spanish at home 248 100.0% Speak English very well2.4% of residents speak other language at home 172 92.5% Speak English very well14 7.5% Speak English less than very well
English speakers - Native, born elsewhere 35.0% of residents of Jenks speak English at home.
55.8% of residents speak Spanish at home 166 54.2% Speak English very well140 45.8% Speak English less than very well4.2% of residents speak other language at home 23 100.0% Speak English very well
English speakers - Foreign-born 22.5% of residents of Jenks speak English at home.
13.1% of residents speak Spanish at home 147 48.0% Speak English very well159 52.0% Speak English less than very well63.3% of residents speak other language at home 678 46.0% Speak English very well797 54.0% Speak English less than very well
White (Caucasian) - Speak only English Native:
99.1% (15,560)Foreign-born:
81.3% (187)
White (Caucasian) - Speak another language Native:
1.8% (277)Foreign-born:
42.2% (97)
Black or African American - Speak only English Native:
96.2% (686)Foreign-born:
31.1% (18)
Black or African American - Speak another language Native:
3.7% (26)Foreign-born:
71.2% (41)
Asian - Speak only English Native:
68.3% (468)Foreign-born:
20.7% (326)
Asian - Speak another language Native:
34.6% (237)Foreign-born:
79.9% (1,259)
Other race - Speak another language Native:
18.6% (56)Foreign-born:
100.0% (68)
Two or more races - Speak another language Native:
19.8% (723)Foreign-born:
100.0% (217)
White alone - Speak only English Native:
98.6% (15,469)Foreign-born:
74.4% (171)
White alone - Speak another language Native:
1.5% (229)Foreign-born:
32.2% (74)
Hispanic or Latino - Speak only English Native:
55.2% (937)Foreign-born:
9.5% (34)
Hispanic or Latino - Speak another language Native:
45.3% (769)Foreign-born:
89.8% (320)
Foreign-born residents in Jenks 2,222 residents are foreign born (6.2% Asia , 1.3% Latin America ).
This city:
8.5%Oklahoma:
6.1%
Marital status for residents in Jenks Marital status - White (Caucasian) population 15 years and over
Males 25.3% Never married65.8% Now married0.5% Separated2.5% Widowed5.9% DivorcedFemales 16.4% Never married63.9% Now married0.9% Separated5.4% Widowed13.5% DivorcedWomen who gave birth in the past 12 months Now married:
87.7% (173)Unmarried:
12.3% (24)
Women who did not give birth in the past 12 months Now married:
62.8% (2,225)Unmarried:
37.2% (1,319)
Marital status - Black or African American population 15 years and over
Males 68.3% Never married26.7% Now married0.0% Separated4.9% Widowed0.0% DivorcedFemales 47.2% Never married34.5% Now married0.0% Separated0.0% Widowed18.3% DivorcedWomen who did not give birth in the past 12 months Now married:
34.4% (88)Unmarried:
65.6% (167)
Marital status - American Indian / Alaska Native population 15 years and over
Males 39.6% Never married60.4% Now married0.0% Separated0.0% Widowed0.0% DivorcedFemales 19.2% Never married49.5% Now married4.9% Separated21.6% Widowed4.9% DivorcedWomen who gave birth in the past 12 months Now married:
0.0% (0)Unmarried:
100.0% (11)
Women who did not give birth in the past 12 months Now married:
63.0% (125)Unmarried:
37.0% (74)
Marital status - Asian population 15 years and over
Males 35.2% Never married63.4% Now married0.0% Separated0.0% Widowed1.4% DivorcedFemales 23.1% Never married65.1% Now married0.0% Separated7.5% Widowed4.3% DivorcedWomen who gave birth in the past 12 months Now married:
100.0% (63)Unmarried:
0.0% (0)
Women who did not give birth in the past 12 months Now married:
68.4% (547)Unmarried:
31.6% (253)
Marital status - Native Hawaiian / Pacific Islander population 15 years and over
Males 0.0% Never married100.0% Now married0.0% Separated0.0% Widowed0.0% DivorcedFemales 100.0% Never married0.0% Now married0.0% Separated0.0% Widowed0.0% DivorcedWomen who did not give birth in the past 12 months Now married:
0.0% (0)Unmarried:
100.0% (8)
Marital status - Other race population 15 years and over
Males 32.5% Never married67.5% Now married0.0% Separated0.0% Widowed0.0% DivorcedFemales 23.0% Never married72.0% Now married0.0% Separated0.0% Widowed5.0% DivorcedWomen who gave birth in the past 12 months Now married:
100.0% (24)Unmarried:
0.0% (0)
Women who did not give birth in the past 12 months Now married:
65.9% (71)Unmarried:
34.1% (37)
Marital status - Two or more races population 15 years and over
Males 39.7% Never married47.6% Now married3.7% Separated6.5% Widowed2.5% DivorcedFemales 35.5% Never married52.2% Now married1.4% Separated4.1% Widowed6.8% DivorcedWomen who gave birth in the past 12 months Now married:
84.6% (14)Unmarried:
15.4% (3)
Women who did not give birth in the past 12 months Now married:
48.2% (457)Unmarried:
51.8% (492)
Marital status - White alone, not Hispanic / Latino population 15 years and over
Males 24.8% Never married65.9% Now married0.6% Separated2.7% Widowed6.1% DivorcedFemales 16.2% Never married63.8% Now married0.9% Separated5.5% Widowed13.6% DivorcedWomen who gave birth in the past 12 months Now married:
92.0% (182)Unmarried:
8.0% (16)
Women who did not give birth in the past 12 months Now married:
62.8% (2,299)Unmarried:
37.2% (1,365)
Marital status - Hispanic or Latino population 15 years and over
Males 40.4% Never married51.1% Now married0.0% Separated8.6% Widowed0.0% DivorcedFemales 35.1% Never married63.8% Now married0.0% Separated0.2% Widowed0.9% DivorcedWomen who gave birth in the past 12 months Now married:
70.7% (31)Unmarried:
29.3% (13)
Women who did not give birth in the past 12 months Now married:
53.3% (224)Unmarried:
46.7% (196)
Ancestries in Jenks
1,779 15.2% English1,229 10.5% German1,064 9.1% American799 6.8% Irish451 3.9% European172 1.5% Scottish164 1.4% Swedish100 0.9% Italian91 0.8% French76 0.7% Lebanese75 0.6% Dutch71 0.6% British68 0.6% Welsh67 0.6% Polish59 0.5% Czech55 0.5% Scotch-Irish51 0.4% Russian40 0.3% Greek35 0.3% Scandinavian30 0.3% French Canadian29 0.2% Northern European28 0.2% Syrian25 0.2% Lithuanian23 0.2% Danish21 0.2% Norwegian20 0.2% Ukrainian19 0.2% West Indian16 0.1% Hungarian12 0.1% British West Indian11 0.09% Zimbabwean10 0.09% Canadian10 0.09% Eastern European8 0.07% African7 0.06% Pennsylvania German3 0.03% Cajun
Geographical mobility in Jenks Same house 1 year ago 14,955 89.9% White (Caucasian)535 66.9% Black or African American936 88.8% American Indian / Alaska Native1,984 78.1% Asian37 100.0% Native Hawaiian / Pacific Islander285 68.0% Other race3,109 73.7% Two or more races15,057 89.5% White alone, not Hispanic / Latino1,739 78.7% Hispanic or LatinoMoved within same county 1,163 7.0% White / Caucasian158 19.8% Black or African American38 3.6% American Indian / Alaska Native233 9.2% Asian25 5.9% Other race677 16.0% Two or more races1,208 7.2% White alone, not Hispanic / Latino319 14.4% Hispanic or LatinoMoved within same state 381 2.3% White / Caucasian52 6.6% Black or African American117 11.1% American Indian / Alaska Native151 6.0% Asian98 23.3% Other race297 7.0% Two or more races370 2.2% White alone, not Hispanic / Latino86 3.9% Hispanic or LatinoMoved from different state 201 1.2% White / Caucasian15 1.9% Black or African American61 2.4% Asian27 0.6% Two or more races217 1.3% White alone, not Hispanic / LatinoMoved from abroad 12 0.1% White37 1.5% Asian20 0.1% White alone, not Hispanic / Latino
Children Nativity (place of birth) in Jenks
Children under 6 years - Living with two parents Both parents native 1,683 100.0% NativeBoth parents foreign-born 305 100.0% NativeOne native, one foreign-born parent 133 100.0% NativeChildren under 6 years - Living with one parent Native parent 304 100.0% NativeForeign-born parent 14 100.0% NativeChildren 6 to 17 years - Living with two parents Both parents native 3,820 99.8% Native7 0.2% Foreign-bornBoth parents foreign-born 293 45.8% Native346 54.2% Foreign-bornOne native, one foreign-born parent 142 76.5% Native44 23.5% Foreign-bornChildren 6 to 17 years - Living with one parent Native parent 944 100.0% NativeForeign-born parent 78 50.3% Native77 49.7% Foreign-born
Grandparents responsible for own grandchildren in Jenks
Grandparents (30 to 59 years) White / Caucasian 23 39.1% Responsible for grandchildren35 60.9% Not responsible for grandchildrenAmerican Indian / Alaska Native 7 100.0% Responsible for grandchildrenAsian 168 100.0% Not responsible for grandchildrenTwo or more races 24 100.0% Not responsible for grandchildrenWhite alone, not Hispanic / Latino 24 51.6% Responsible for grandchildren22 48.4% Not responsible for grandchildrenHispanic or Latino 25 100.0% Not responsible for grandchildrenGrandparents (60 years and over) White / Caucasian 26 70.4% Responsible for grandchildren11 29.6% Not responsible for grandchildrenAsian 47 100.0% Not responsible for grandchildrenTwo or more races 8 100.0% Not responsible for grandchildrenWhite alone, not Hispanic / Latino 24 76.7% Responsible for grandchildren7 23.3% Not responsible for grandchildrenHispanic or Latino 10 32.9% Responsible for grandchildren21 67.1% Not responsible for grandchildren