Races in Jenison, Michigan (MI) Detailed Stats
Data:
Races - White alone (%)
Races - White alone (% change since 2000)
Races - Black alone (%)
Races - Black alone (% change since 2000)
Races - American Indian alone (%)
Races - American Indian alone (% change since 2000)
Races - Asian alone (%)
Races - Asian alone (% change since 2000)
Races - Hispanic (%)
Races - Hispanic (% change since 2000)
Races - Native Hawaiian and Other Pacific Islander alone (%)
Races - Native Hawaiian and Other Pacific Islander alone (% change since 2000)
Races - Two or more races(%)
Races - Two or more races(% change since 2000)
Races - Other race alone (%)
Races - Other race alone (% change since 2000)
Racial diversity
Place of birth - Born in state of residence (%)
Place of birth - Born in state of residence (%) - White
Place of birth - Born in state of residence (%) - Black or African American
Place of birth - Born in state of residence (%) - Asian
Place of birth - Born in state of residence (%) - Hispanic or Latino
Place of birth - Born in state of residence (%) - American Indian and Alaska Native
Place of birth - Born in state of residence (%) - Multirace
Place of birth - Born in state of residence (%) - Other Race
Place of birth - Born in other state (%)
Place of birth - Born in other state (%) - White
Place of birth - Born in other state (%) - Black or African American
Place of birth - Born in other state (%) - Asian
Place of birth - Born in other state (%) - Hispanic or Latino
Place of birth - Born in other state (%) - American Indian and Alaska Native
Place of birth - Born in other state (%) - Multirace
Place of birth - Born in other state (%) - Other Race
Place of birth - Native, outside of US (%)
Place of birth - Native, outside of US (%) - White
Place of birth - Native, outside of US (%) - Black or African American
Place of birth - Native, outside of US (%) - Asian
Place of birth - Native, outside of US (%) - Hispanic or Latino
Place of birth - Native, outside of US (%) - American Indian and Alaska Native
Place of birth - Native, outside of US (%) - Multirace
Place of birth - Native, outside of US (%) - Other Race
Place of birth - Foreign born (%)
Place of birth - Foreign born (%) - White
Place of birth - Foreign born (%) - Black or African American
Place of birth - Foreign born (%) - Asian
Place of birth - Foreign born (%) - Hispanic or Latino
Place of birth - Foreign born (%) - American Indian and Alaska Native
Place of birth - Foreign born (%) - Multirace
Place of birth - Foreign born (%) - Other Race
Residents speaking English at home (%)
Residents speaking English at home - Born in the United States (%)
Residents speaking English at home - Native, born elsewhere (%)
Residents speaking English at home - Foreign born (%)
Residents speaking Spanish at home (%)
Residents speaking Spanish at home - Born in the United States (%)
Residents speaking Spanish at home - Native, born elsewhere (%)
Residents speaking Spanish at home - Foreign born (%)
Residents speaking other language at home (%)
Residents speaking other language at home - Born in the United States (%)
Residents speaking other language at home - Native, born elsewhere (%)
Residents speaking other language at home - Foreign born (%)
Marital status - Never married (%)
Marital status - Now married (%)
Marital status - Separated (%)
Marital status - Widowed (%)
Marital status - Divorced (%)
Ancestries Reported - Arab (%)
Ancestries Reported - Czech (%)
Ancestries Reported - Danish (%)
Ancestries Reported - Dutch (%)
Ancestries Reported - English (%)
Ancestries Reported - French (%)
Ancestries Reported - French Canadian (%)
Ancestries Reported - German (%)
Ancestries Reported - Greek (%)
Ancestries Reported - Hungarian (%)
Ancestries Reported - Irish (%)
Ancestries Reported - Italian (%)
Ancestries Reported - Lithuanian (%)
Ancestries Reported - Norwegian (%)
Ancestries Reported - Polish (%)
Ancestries Reported - Portuguese (%)
Ancestries Reported - Russian (%)
Ancestries Reported - Scotch-Irish (%)
Ancestries Reported - Scottish (%)
Ancestries Reported - Slovak (%)
Ancestries Reported - Subsaharan African (%)
Ancestries Reported - Swedish (%)
Ancestries Reported - Swiss (%)
Ancestries Reported - Ukrainian (%)
Ancestries Reported - United States (%)
Ancestries Reported - Welsh (%)
Ancestries Reported - West Indian (%)
Ancestries Reported - Other (%)
Geographical mobility - Same house 1 year ago (%)
Geographical mobility - Same house 1 year ago (%) - White
Geographical mobility - Same house 1 year ago (%) - Black or African American
Geographical mobility - Same house 1 year ago (%) - Asian
Geographical mobility - Same house 1 year ago (%) - Hispanic or Latino
Geographical mobility - Same house 1 year ago (%) - American Indian and Alaska Native
Geographical mobility - Same house 1 year ago (%) - Multirace
Geographical mobility - Same house 1 year ago (%) - Other Race
Geographical mobility - Moved within same county (%)
Geographical mobility - Moved within same county (%) - White
Geographical mobility - Moved within same county (%) - Black or African American
Geographical mobility - Moved within same county (%) - Asian
Geographical mobility - Moved within same county (%) - Hispanic or Latino
Geographical mobility - Moved within same county (%) - American Indian and Alaska Native
Geographical mobility - Moved within same county (%) - Multirace
Geographical mobility - Moved within same county (%) - Other Race
Geographical mobility - Moved from different county within same state (%)
Geographical mobility - Moved from different county within same state (%) - White
Geographical mobility - Moved from different county within same state (%) - Black or African American
Geographical mobility - Moved from different county within same state (%) - Asian
Geographical mobility - Moved from different county within same state (%) - Hispanic or Latino
Geographical mobility - Moved from different county within same state (%) - American Indian and Alaska Native
Geographical mobility - Moved from different county within same state (%) - Multirace
Geographical mobility - Moved from different county within same state (%) - Other Race
Geographical mobility - Moved from different state (%)
Geographical mobility - Moved from different state (%) - White
Geographical mobility - Moved from different state (%) - Black or African American
Geographical mobility - Moved from different state (%) - Asian
Geographical mobility - Moved from different state (%) - Hispanic or Latino
Geographical mobility - Moved from different state (%) - American Indian and Alaska Native
Geographical mobility - Moved from different state (%) - Multirace
Geographical mobility - Moved from different state (%) - Other Race
Geographical mobility - Moved from abroad (%)
Geographical mobility - Moved from abroad (%) - White
Geographical mobility - Moved from abroad (%) - Black or African American
Geographical mobility - Moved from abroad (%) - Asian
Geographical mobility - Moved from abroad (%) - Hispanic or Latino
Geographical mobility - Moved from abroad (%) - American Indian and Alaska Native
Geographical mobility - Moved from abroad (%) - Multirace
Geographical mobility - Moved from abroad (%) - Other Race
Place of birth for the foreign-born population - Ireland (%)
Place of birth for the foreign-born population - Denmark (%)
Place of birth for the foreign-born population - Norway (%)
Place of birth for the foreign-born population - Sweden (%)
Place of birth for the foreign-born population - United Kingdom (%)
Place of birth for the foreign-born population - England (%)
Place of birth for the foreign-born population - Scotland (%)
Place of birth for the foreign-born population - Other Northern Europe (%)
Place of birth for the foreign-born population - Austria (%)
Place of birth for the foreign-born population - Belgium (%)
Place of birth for the foreign-born population - France (%)
Place of birth for the foreign-born population - Germany (%)
Place of birth for the foreign-born population - Netherlands (%)
Place of birth for the foreign-born population - Switzerland (%)
Place of birth for the foreign-born population - Other Western Europe (%)
Place of birth for the foreign-born population - Greece (%)
Place of birth for the foreign-born population - Italy (%)
Place of birth for the foreign-born population - Portugal (%)
Place of birth for the foreign-born population - Spain (%)
Place of birth for the foreign-born population - Other Southern Europe (%)
Place of birth for the foreign-born population - Albania (%)
Place of birth for the foreign-born population - Belarus (%)
Place of birth for the foreign-born population - Bosnia and Herzegovina (%)
Place of birth for the foreign-born population - Bulgaria (%)
Place of birth for the foreign-born population - Croatia (%)
Place of birth for the foreign-born population - Czechoslovakia (%)
Place of birth for the foreign-born population - Hungary (%)
Place of birth for the foreign-born population - Latvia (%)
Place of birth for the foreign-born population - Lithuania (%)
Place of birth for the foreign-born population - North Macedonia (Macedonia) (%)
Place of birth for the foreign-born population - Moldova (%)
Place of birth for the foreign-born population - Poland (%)
Place of birth for the foreign-born population - Romania (%)
Place of birth for the foreign-born population - Russia (%)
Place of birth for the foreign-born population - Serbia (%)
Place of birth for the foreign-born population - Ukraine (%)
Place of birth for the foreign-born population - Other Eastern Europe (%)
Place of birth for the foreign-born population - China (%)
Place of birth for the foreign-born population - Hong Kong (%)
Place of birth for the foreign-born population - Taiwan (%)
Place of birth for the foreign-born population - Japan (%)
Place of birth for the foreign-born population - Korea (%)
Place of birth for the foreign-born population - Other Eastern Asia (%)
Place of birth for the foreign-born population - Afghanistan (%)
Place of birth for the foreign-born population - Bangladesh (%)
Place of birth for the foreign-born population - India (%)
Place of birth for the foreign-born population - Iran (%)
Place of birth for the foreign-born population - Kazakhstan (%)
Place of birth for the foreign-born population - Nepal (%)
Place of birth for the foreign-born population - Pakistan (%)
Place of birth for the foreign-born population - Sri Lanka (%)
Place of birth for the foreign-born population - Uzbekistan (%)
Place of birth for the foreign-born population - Other South Central Asia (%)
Place of birth for the foreign-born population - Burma (%)
Place of birth for the foreign-born population - Cambodia (%)
Place of birth for the foreign-born population - Indonesia (%)
Place of birth for the foreign-born population - Laos (%)
Place of birth for the foreign-born population - Malaysia (%)
Place of birth for the foreign-born population - Philippines (%)
Place of birth for the foreign-born population - Singapore (%)
Place of birth for the foreign-born population - Thailand (%)
Place of birth for the foreign-born population - Vietnam (%)
Place of birth for the foreign-born population - Other South Eastern Asia (%)
Place of birth for the foreign-born population - Armenia (%)
Place of birth for the foreign-born population - Iraq (%)
Place of birth for the foreign-born population - Israel (%)
Place of birth for the foreign-born population - Jordan (%)
Place of birth for the foreign-born population - Kuwait (%)
Place of birth for the foreign-born population - Lebanon (%)
Place of birth for the foreign-born population - Saudi Arabia (%)
Place of birth for the foreign-born population - Syria (%)
Place of birth for the foreign-born population - Turkey (%)
Place of birth for the foreign-born population - Yemen (%)
Place of birth for the foreign-born population - Other Western Asia (%)
Place of birth for the foreign-born population - Eritrea (%)
Place of birth for the foreign-born population - Ethiopia (%)
Place of birth for the foreign-born population - Kenya (%)
Place of birth for the foreign-born population - Somalia (%)
Place of birth for the foreign-born population - Uganda (%)
Place of birth for the foreign-born population - Zimbabwe (%)
Place of birth for the foreign-born population - Other Eastern Africa (%)
Place of birth for the foreign-born population - Cameroon (%)
Place of birth for the foreign-born population - Congo (%)
Place of birth for the foreign-born population - Democratic Republic of Congo (Zaire) (%)
Place of birth for the foreign-born population - Other Middle Africa (%)
Place of birth for the foreign-born population - Egypt (%)
Place of birth for the foreign-born population - Morocco (%)
Place of birth for the foreign-born population - Sudan (%)
Place of birth for the foreign-born population - Other Northern Africa (%)
Place of birth for the foreign-born population - South Africa (%)
Place of birth for the foreign-born population - Other Southern Africa (%)
Place of birth for the foreign-born population - Cabo Verde (%)
Place of birth for the foreign-born population - Ghana (%)
Place of birth for the foreign-born population - Liberia (%)
Place of birth for the foreign-born population - Nigeria (%)
Place of birth for the foreign-born population - Senegal (%)
Place of birth for the foreign-born population - Sierra Leone (%)
Place of birth for the foreign-born population - Other Western Africa (%)
Place of birth for the foreign-born population - Australia (%)
Place of birth for the foreign-born population - New Zealand (%)
Place of birth for the foreign-born population - Fiji (%)
Place of birth for the foreign-born population - Micronesia (%)
Place of birth for the foreign-born population - Bahamas (%)
Place of birth for the foreign-born population - Barbados (%)
Place of birth for the foreign-born population - Cuba (%)
Place of birth for the foreign-born population - Dominica (%)
Place of birth for the foreign-born population - Dominican Republic (%)
Place of birth for the foreign-born population - Grenada (%)
Place of birth for the foreign-born population - Haiti (%)
Place of birth for the foreign-born population - Jamaica (%)
Place of birth for the foreign-born population - St. Vincent and the Grenadines (%)
Place of birth for the foreign-born population - Trinidad and Tobago (%)
Place of birth for the foreign-born population - West Indies (%)
Place of birth for the foreign-born population - Other Caribbean (%)
Place of birth for the foreign-born population - Belize (%)
Place of birth for the foreign-born population - Costa Rica (%)
Place of birth for the foreign-born population - El Salvador (%)
Place of birth for the foreign-born population - Guatemala (%)
Place of birth for the foreign-born population - Honduras (%)
Place of birth for the foreign-born population - Mexico (%)
Place of birth for the foreign-born population - Nicaragua (%)
Place of birth for the foreign-born population - Panama (%)
Place of birth for the foreign-born population - Other Central America (%)
Place of birth for the foreign-born population - Argentina (%)
Place of birth for the foreign-born population - Bolivia (%)
Place of birth for the foreign-born population - Brazil (%)
Place of birth for the foreign-born population - Chile (%)
Place of birth for the foreign-born population - Colombia (%)
Place of birth for the foreign-born population - Ecuador (%)
Place of birth for the foreign-born population - Guyana (%)
Place of birth for the foreign-born population - Peru (%)
Place of birth for the foreign-born population - Uruguay (%)
Place of birth for the foreign-born population - Venezuela (%)
Place of birth for the foreign-born population - Other South America (%)
Place of birth for the foreign-born population - Canada (%)
Place of birth for the foreign-born population - Other Northern America (%)
Place of birth for the foreign-born population - Other (%)
Latest news about races in Jenison, MI collected exclusively by city-data.com from local newspapers, TV, and radio stations
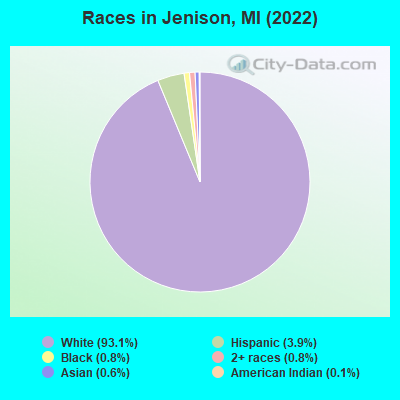
According to 2022 data, the most numerous races in Jenison, MI are White alone (16,377 residents), Black alone (147 residents), and Hispanic (681 residents). 97.2% of Jenison residents speak English at home. 2.1% of Jenison, MI residents are foreign-born (0.8% born in Europe, 0.5% born in Latin America, 0.3% born in North America, 0.3% born in Africa, 0.2% born in Asia), which is 180.7% less than the foreign-born rate of 6.0% across the entire state of Michigan.
Race distribution in Jenison
2000 2022
7,806,691 78.6% White alone 1,402,047 14.1% Black alone 323,877 3.3% Hispanic 175,311 1.8% Asian alone 163,487 1.6% Two or more races 53,421 0.5% American Indian alone 11,465 0.1% Other race alone 2,145 0.02% Native Hawaiian and Other
7,289,051 72.6% White alone 1,310,464 13.1% Black alone 572,405 5.7% Hispanic 450,031 4.5% Two or more races 335,732 3.3% Asian alone 45,217 0.5% Other race alone 29,011 0.3% American Indian alone 2,207 0.02% Native Hawaiian and Other
Income and house value in Jenison Median household income in 2022 $81,590 White non-Hispanic householders$52,993 Two or more races householders$84,983 Hispanic or Latino race householdersMedian 2022 house value $278,156 White Non-Hispanic householders$230,947 Black or African American householders $175,316 Asian householders$230,947 Some other race householders$302,758 Hispanic or Latino householders
Median age by race in Jenison
40.4 Median age for White residents38.5 42.5 9.6 Median age for Black or African American residents9.6 13.6 14.0 Median age for American Indian / Alaska Native residents-1,330,864,196.2 31.4 30.5 Median age for Asian residents27.9 32.4 -670,531,400.3 Median age for Native Hawaiian / Pacific Islander residents-666,666,666.0 -666,666,666.0 33.5 Median age for Other race residents26.1 43.2 10.5 Median age for Two or more races residents10.7 9.7 40.7 Median age for White alone residents38.8 43.1 14.7 Median age for Hispanic or Latino residents14.4 23.7
Owner/renter occupied households by race in Jenison
House owners and renters - White residents 5,575 83.4% Owner occupied1,110 16.6% Renter occupiedHouse owners and renters - Asian residents 25 100.0% Owner occupiedHouse owners and renters - Other race residents 10 100.0% Owner occupiedHouse owners and renters - Two or more races residents 18 76.3% Owner occupied6 23.7% Renter occupiedHouse owners and renters - White alone residents 5,522 83.3% Owner occupied1,106 16.7% Renter occupiedHouse owners and renters - Hispanic or Latino residents 135 100.0% Owner occupied
Language usage in Jenison
English speakers - Total 97.2% of residents of Jenison speak English at home.
1.2% of residents speak Spanish at home 158 77.5% Speak English very well46 22.5% Speak English less than very well0.9% of residents speak other language at home 150 100.0% Speak English very well
English speakers - Born in the United States 94.5% of residents of Jenison speak English at home.
5.7% of residents speak Spanish at home 97 86.6% Speak English very well15 13.4% Speak English less than very well0.8% of residents speak other language at home 16 100.0% Speak English very well
English speakers - Native, born elsewhere 70.5% of residents of Jenison speak English at home.
12.6% of residents speak Spanish at home 12 100.0% Speak English very well
English speakers - Foreign-born 33.8% of residents of Jenison speak English at home.
16.8% of residents speak Spanish at home 53 82.8% Speak English very well11 17.2% Speak English less than very well26.2% of residents speak other language at home 100 100.0% Speak English very well
White (Caucasian) - Speak only English Native:
99.4% (15,096)Foreign-born:
70.3% (106)
White (Caucasian) - Speak another language Native:
0.9% (132)Foreign-born:
20.1% (30)
Black or African American - Speak only English Native:
100.0% (80)Foreign-born:
93.1% (41)
American Indian / Alaska Native - Speak another language Native:
22.5% (7)Foreign-born:
100.0% (65)
Asian - Speak only English Native:
96.5% (72)Foreign-born:
12.8% (6)
Other race - Speak another language Native:
39.9% (30)Foreign-born:
100.0% (22)
White alone - Speak only English Native:
99.2% (15,031)Foreign-born:
57.3% (89)
White alone - Speak another language Native:
0.7% (108)Foreign-born:
30.2% (47)
Hispanic or Latino - Speak only English Native:
78.6% (344)Foreign-born:
19.3% (19)
Hispanic or Latino - Speak another language Native:
22.7% (99)Foreign-born:
68.3% (69)
Foreign-born residents in Jenison 376 residents are foreign born (0.8% Europe , 0.5% Latin America , 0.3% North America , 0.3% Africa , 0.2% Asia ).
This city:
2.1%Michigan:
6.9%
Marital status for residents in Jenison Marital status - White (Caucasian) population 15 years and over
Males 22.0% Never married67.1% Now married0.0% Separated3.9% Widowed7.0% DivorcedFemales 12.8% Never married64.7% Now married0.6% Separated14.4% Widowed7.4% DivorcedWomen who gave birth in the past 12 months Now married:
96.5% (270)Unmarried:
3.5% (10)
Women who did not give birth in the past 12 months Now married:
65.2% (1,822)Unmarried:
34.8% (972)
Marital status - Black or African American population 15 years and over
Males 100.0% Never married0.0% Now married0.0% Separated0.0% Widowed0.0% DivorcedFemales 100.0% Never married0.0% Now married0.0% Separated0.0% Widowed0.0% DivorcedWomen who did not give birth in the past 12 months Now married:
0.0% (0)Unmarried:
100.0% (22)
Marital status - Asian population 15 years and over
Males 0.0% Never married100.0% Now married0.0% Separated0.0% Widowed0.0% DivorcedFemales 78.0% Never married22.0% Now married0.0% Separated0.0% Widowed0.0% DivorcedWomen who did not give birth in the past 12 months Now married:
22.0% (16)Unmarried:
78.0% (55)
Marital status - Other race population 15 years and over
Males 32.3% Never married38.7% Now married0.0% Separated29.0% Widowed0.0% DivorcedFemales 70.3% Never married29.7% Now married0.0% Separated0.0% Widowed0.0% DivorcedWomen who did not give birth in the past 12 months Now married:
29.7% (13)Unmarried:
70.3% (31)
Marital status - Two or more races population 15 years and over
Males 79.4% Never married20.6% Now married0.0% Separated0.0% Widowed0.0% DivorcedFemales 59.1% Never married40.9% Now married0.0% Separated0.0% Widowed0.0% DivorcedWomen who gave birth in the past 12 months Now married:
100.0% (10)Unmarried:
0.0% (0)
Women who did not give birth in the past 12 months Now married:
27.8% (12)Unmarried:
72.2% (32)
Marital status - White alone, not Hispanic / Latino population 15 years and over
Males 22.2% Never married67.2% Now married0.0% Separated3.4% Widowed7.2% DivorcedFemales 12.9% Never married64.5% Now married0.6% Separated14.5% Widowed7.5% DivorcedWomen who gave birth in the past 12 months Now married:
96.3% (260)Unmarried:
3.7% (10)
Women who did not give birth in the past 12 months Now married:
64.7% (1,816)Unmarried:
35.3% (991)
Marital status - Hispanic or Latino population 15 years and over
Males 18.1% Never married54.9% Now married0.0% Separated26.9% Widowed0.0% DivorcedFemales 23.0% Never married71.2% Now married0.0% Separated5.8% Widowed0.0% DivorcedWomen who gave birth in the past 12 months Now married:
100.0% (17)Unmarried:
0.0% (0)
Women who did not give birth in the past 12 months Now married:
71.9% (84)Unmarried:
28.1% (33)
Ancestries in Jenison
4,324 51.5% Dutch622 7.4% German586 7.0% American559 6.7% English301 3.6% Irish211 2.5% European198 2.4% Polish98 1.2% Italian62 0.7% Swedish55 0.7% Norwegian49 0.6% Ethiopian30 0.4% French27 0.3% Scottish26 0.3% Canadian22 0.3% Scandinavian21 0.3% Eastern European18 0.2% French Canadian18 0.2% Welsh16 0.2% Slavic14 0.2% Lebanese11 0.1% British11 0.1% Greek9 0.1% Scotch-Irish8 0.10% Hungarian6 0.07% Northern European2 0.02% Austrian
Children Nativity (place of birth) in Jenison
Children under 6 years - Living with two parents Both parents native 1,231 100.0% NativeOne native, one foreign-born parent 44 100.0% NativeChildren under 6 years - Living with one parent Native parent 110 100.0% NativeChildren 6 to 17 years - Living with two parents Both parents native 2,048 97.7% Native49 2.3% Foreign-bornOne native, one foreign-born parent 106 76.4% Native33 23.6% Foreign-bornChildren 6 to 17 years - Living with one parent Native parent 435 100.0% NativeForeign-born parent 6 45.8% Native7 54.2% Foreign-born
Grandparents responsible for own grandchildren in Jenison
Grandparents (30 to 59 years) White / Caucasian 12 15.0% Responsible for grandchildren65 85.0% Not responsible for grandchildrenWhite alone, not Hispanic / Latino 12 13.8% Responsible for grandchildren72 86.2% Not responsible for grandchildrenGrandparents (60 years and over) White / Caucasian 23 5.6% Responsible for grandchildren380 94.4% Not responsible for grandchildrenWhite alone, not Hispanic / Latino 27 6.6% Responsible for grandchildren376 93.4% Not responsible for grandchildren