Races in Jefferson, Virginia (VA) Detailed Stats
Ancestries, Foreign-born residents, place of birth

Recent posts about races in Jefferson, Virginia on our local forum with over 2,400,000 registered users:
 | Remove all the Confederate stuff in Virginia, FFS (155 replies) |
| Why Hasn't Lee Highway Been Renamed Yet? (139 replies) |
| Why so many Asians in Annandale? (85 replies) |
| What's with the anti-Virginia setiment in MD? (63 replies) |
| Alexandria seeks to rename highay and move statue (90 replies) |
| Another post about moving to NoVA (21 replies) |
Latest news about races in Jefferson, VA collected exclusively by city-data.com from local newspapers, TV, and radio stations
37.8% of Jefferson, VA residents are foreign-born (17.1% born in Asia, 17.0% born in Latin America), which is 68.3% greater than the foreign-born rate of 12.0% across the entire state of Virginia.
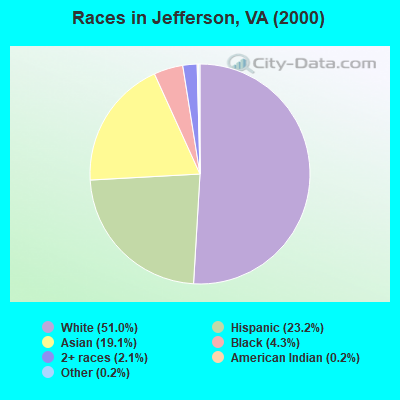
Race distribution in Jefferson

- 13,98151.0%White alone
- 6,35123.2%Hispanic
- 5,22819.1%Asian alone
- 1,1804.3%Black alone
- 5722.1%Two or more races
- 480.2%Other race alone
- 550.2%American Indian alone
- 70.03%Native Hawaiian and Other
Pacific Islander alone
2000
2022
-
- 4,965,63770.2%White alone
- 1,376,37819.4%Black alone
- 329,5404.7%Hispanic
- 259,2773.7%Asian alone
- 114,0221.6%Two or more races
- 18,5960.3%American Indian alone
- 11,6850.2%Other race alone
- 3,3800.05%Native Hawaiian and Other
Pacific Islander alone

-
- 5,095,13058.7%White alone
- 1,594,78518.4%Black alone
- 905,75010.4%Hispanic
- 602,8816.9%Asian alone
- 406,0474.7%Two or more races
- 60,4190.7%Other race alone
- 11,7380.1%American Indian alone
- 6,8690.08%Native Hawaiian and Other
Pacific Islander alone

Income and house value in Jefferson
- Median household income in 2022
- $130,471White non-Hispanic householders
- $86,359Black householders
- $41,894American Indian and Alaska Native householders
- $114,848Asian householders
- over $200,000Native Hawaiian and other Pacific Islander householders
- $90,474Some other race householders
- $107,368Two or more races householders
- $94,264Hispanic or Latino race householders
- Median 2022 house value
- $603,211White Non-Hispanic householders
- $541,015Black or African American householders
- $580,083Asian householders
- $525,388Some other race householders
- $553,517Two or more races householders
- $536,952Hispanic or Latino householders
Household income for White non-Hispanic householders

Household income for Black householders

Household income for American Indian and Alaska Native householders

Household income for Asian householders

Household income for Native Hawaiian and other Pacific Islander householders

Household income for Two or more races householders

Household income for Hispanic or Latino race householders

Foreign-born residents in Jefferson
10,378 residents are foreign born (17.1% Asia, 17.0% Latin America).
| This city: | 37.8% |
| Virginia: | 8.1% |
Ancestries in Jefferson

- 13,40746.2%Other
- 2,99110.3%German
- 2,5678.8%Irish
- 2,4318.4%English
- 1,2924.4%United States
- 1,0443.6%Italian
- 6482.2%Scottish
- 6222.1%Polish
- 5762.0%French
- 4511.6%Arab
- 3851.3%Scotch-Irish
- 3371.2%Russian
- 2720.9%Dutch
- 2460.8%Swedish
- 2330.8%Norwegian
- 2160.7%Welsh
- 1820.6%French Canadian
- 1820.6%Subsaharan African
- 1630.6%Hungarian
- 1550.5%Greek
- 1160.4%Ukrainian
- 990.3%Portuguese
- 960.3%Czech
- 840.3%West Indian
- 820.3%Danish
- 620.2%Slovak
- 520.2%Swiss
- 440.2%Lithuanian

Zip codes: 22042.