Races in Jefferson City, Missouri (MO) Detailed Stats
Data:
Races - White alone (%)
Races - White alone (% change since 2000)
Races - Black alone (%)
Races - Black alone (% change since 2000)
Races - American Indian alone (%)
Races - American Indian alone (% change since 2000)
Races - Asian alone (%)
Races - Asian alone (% change since 2000)
Races - Hispanic (%)
Races - Hispanic (% change since 2000)
Races - Native Hawaiian and Other Pacific Islander alone (%)
Races - Native Hawaiian and Other Pacific Islander alone (% change since 2000)
Races - Two or more races(%)
Races - Two or more races(% change since 2000)
Races - Other race alone (%)
Races - Other race alone (% change since 2000)
Racial diversity
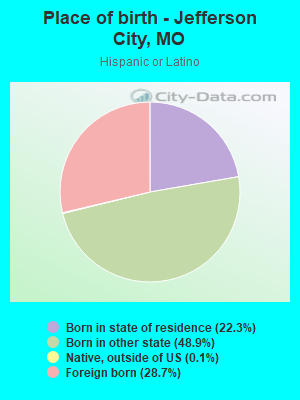
Place of birth - Born in state of residence (%)
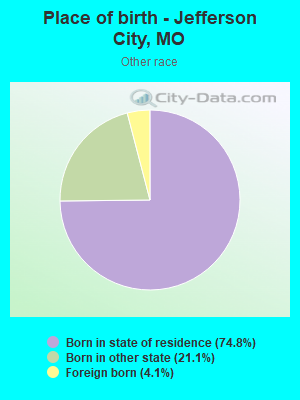
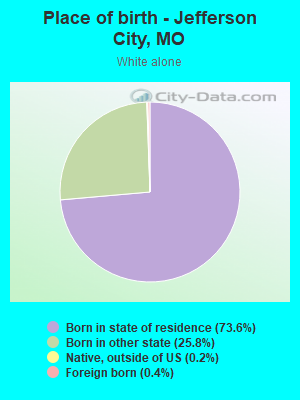
Place of birth - Born in state of residence (%) - White
Place of birth - Born in state of residence (%) - Black or African American
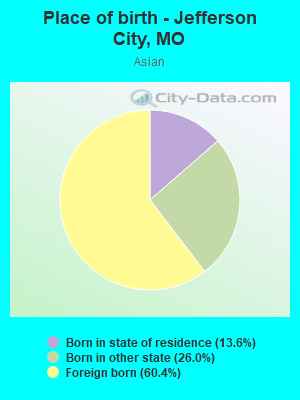
Place of birth - Born in state of residence (%) - Asian
Place of birth - Born in state of residence (%) - Hispanic or Latino
Place of birth - Born in state of residence (%) - American Indian and Alaska Native
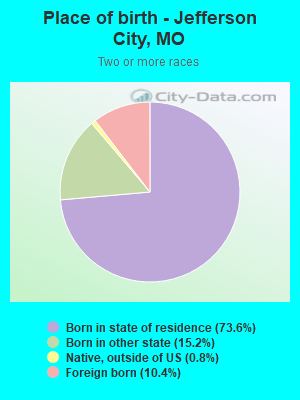
Place of birth - Born in state of residence (%) - Multirace
Place of birth - Born in state of residence (%) - Other Race
Place of birth - Born in other state (%)
Place of birth - Born in other state (%) - White
Place of birth - Born in other state (%) - Black or African American
Place of birth - Born in other state (%) - Asian
Place of birth - Born in other state (%) - Hispanic or Latino
Place of birth - Born in other state (%) - American Indian and Alaska Native
Place of birth - Born in other state (%) - Multirace
Place of birth - Born in other state (%) - Other Race
Place of birth - Native, outside of US (%)
Place of birth - Native, outside of US (%) - White
Place of birth - Native, outside of US (%) - Black or African American
Place of birth - Native, outside of US (%) - Asian
Place of birth - Native, outside of US (%) - Hispanic or Latino
Place of birth - Native, outside of US (%) - American Indian and Alaska Native
Place of birth - Native, outside of US (%) - Multirace
Place of birth - Native, outside of US (%) - Other Race
Place of birth - Foreign born (%)
Place of birth - Foreign born (%) - White
Place of birth - Foreign born (%) - Black or African American
Place of birth - Foreign born (%) - Asian
Place of birth - Foreign born (%) - Hispanic or Latino
Place of birth - Foreign born (%) - American Indian and Alaska Native
Place of birth - Foreign born (%) - Multirace
Place of birth - Foreign born (%) - Other Race
Residents speaking English at home (%)
Residents speaking English at home - Born in the United States (%)
Residents speaking English at home - Native, born elsewhere (%)
Residents speaking English at home - Foreign born (%)
Residents speaking Spanish at home (%)
Residents speaking Spanish at home - Born in the United States (%)
Residents speaking Spanish at home - Native, born elsewhere (%)
Residents speaking Spanish at home - Foreign born (%)
Residents speaking other language at home (%)
Residents speaking other language at home - Born in the United States (%)
Residents speaking other language at home - Native, born elsewhere (%)
Residents speaking other language at home - Foreign born (%)
Marital status - Never married (%)
Marital status - Now married (%)
Marital status - Separated (%)
Marital status - Widowed (%)
Marital status - Divorced (%)
Ancestries Reported - Arab (%)
Ancestries Reported - Czech (%)
Ancestries Reported - Danish (%)
Ancestries Reported - Dutch (%)
Ancestries Reported - English (%)
Ancestries Reported - French (%)
Ancestries Reported - French Canadian (%)
Ancestries Reported - German (%)
Ancestries Reported - Greek (%)
Ancestries Reported - Hungarian (%)
Ancestries Reported - Irish (%)
Ancestries Reported - Italian (%)
Ancestries Reported - Lithuanian (%)
Ancestries Reported - Norwegian (%)
Ancestries Reported - Polish (%)
Ancestries Reported - Portuguese (%)
Ancestries Reported - Russian (%)
Ancestries Reported - Scotch-Irish (%)
Ancestries Reported - Scottish (%)
Ancestries Reported - Slovak (%)
Ancestries Reported - Subsaharan African (%)
Ancestries Reported - Swedish (%)
Ancestries Reported - Swiss (%)
Ancestries Reported - Ukrainian (%)
Ancestries Reported - United States (%)
Ancestries Reported - Welsh (%)
Ancestries Reported - West Indian (%)
Ancestries Reported - Other (%)
Geographical mobility - Same house 1 year ago (%)
Geographical mobility - Same house 1 year ago (%) - White
Geographical mobility - Same house 1 year ago (%) - Black or African American
Geographical mobility - Same house 1 year ago (%) - Asian
Geographical mobility - Same house 1 year ago (%) - Hispanic or Latino
Geographical mobility - Same house 1 year ago (%) - American Indian and Alaska Native
Geographical mobility - Same house 1 year ago (%) - Multirace
Geographical mobility - Same house 1 year ago (%) - Other Race
Geographical mobility - Moved within same county (%)
Geographical mobility - Moved within same county (%) - White
Geographical mobility - Moved within same county (%) - Black or African American
Geographical mobility - Moved within same county (%) - Asian
Geographical mobility - Moved within same county (%) - Hispanic or Latino
Geographical mobility - Moved within same county (%) - American Indian and Alaska Native
Geographical mobility - Moved within same county (%) - Multirace
Geographical mobility - Moved within same county (%) - Other Race
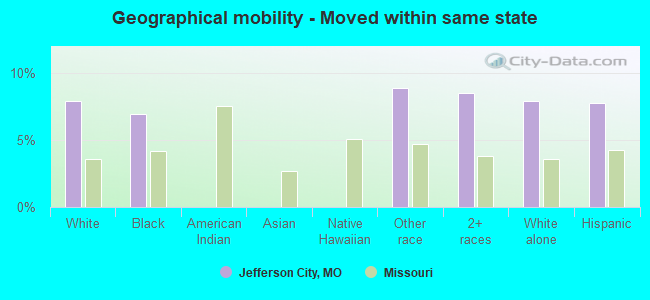
Geographical mobility - Moved from different county within same state (%)
Geographical mobility - Moved from different county within same state (%) - White
Geographical mobility - Moved from different county within same state (%) - Black or African American
Geographical mobility - Moved from different county within same state (%) - Asian
Geographical mobility - Moved from different county within same state (%) - Hispanic or Latino
Geographical mobility - Moved from different county within same state (%) - American Indian and Alaska Native
Geographical mobility - Moved from different county within same state (%) - Multirace
Geographical mobility - Moved from different county within same state (%) - Other Race
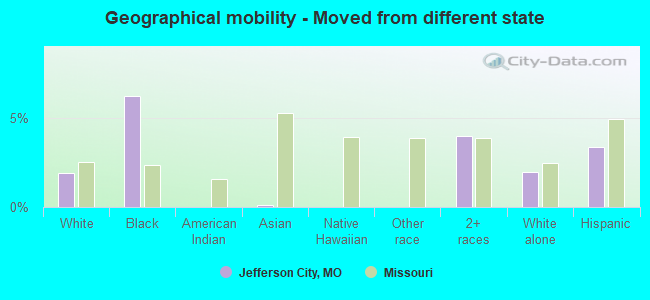
Geographical mobility - Moved from different state (%)
Geographical mobility - Moved from different state (%) - White
Geographical mobility - Moved from different state (%) - Black or African American
Geographical mobility - Moved from different state (%) - Asian
Geographical mobility - Moved from different state (%) - Hispanic or Latino
Geographical mobility - Moved from different state (%) - American Indian and Alaska Native
Geographical mobility - Moved from different state (%) - Multirace
Geographical mobility - Moved from different state (%) - Other Race
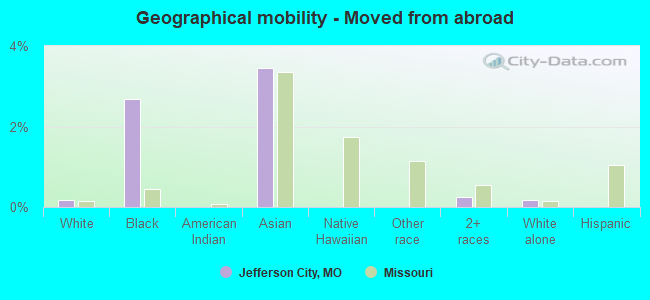
Geographical mobility - Moved from abroad (%)
Geographical mobility - Moved from abroad (%) - White
Geographical mobility - Moved from abroad (%) - Black or African American
Geographical mobility - Moved from abroad (%) - Asian
Geographical mobility - Moved from abroad (%) - Hispanic or Latino
Geographical mobility - Moved from abroad (%) - American Indian and Alaska Native
Geographical mobility - Moved from abroad (%) - Multirace
Geographical mobility - Moved from abroad (%) - Other Race
Place of birth for the foreign-born population - Ireland (%)
Place of birth for the foreign-born population - Denmark (%)
Place of birth for the foreign-born population - Norway (%)
Place of birth for the foreign-born population - Sweden (%)
Place of birth for the foreign-born population - United Kingdom (%)
Place of birth for the foreign-born population - England (%)
Place of birth for the foreign-born population - Scotland (%)
Place of birth for the foreign-born population - Other Northern Europe (%)
Place of birth for the foreign-born population - Austria (%)
Place of birth for the foreign-born population - Belgium (%)
Place of birth for the foreign-born population - France (%)
Place of birth for the foreign-born population - Germany (%)
Place of birth for the foreign-born population - Netherlands (%)
Place of birth for the foreign-born population - Switzerland (%)
Place of birth for the foreign-born population - Other Western Europe (%)
Place of birth for the foreign-born population - Greece (%)
Place of birth for the foreign-born population - Italy (%)
Place of birth for the foreign-born population - Portugal (%)
Place of birth for the foreign-born population - Spain (%)
Place of birth for the foreign-born population - Other Southern Europe (%)
Place of birth for the foreign-born population - Albania (%)
Place of birth for the foreign-born population - Belarus (%)
Place of birth for the foreign-born population - Bosnia and Herzegovina (%)
Place of birth for the foreign-born population - Bulgaria (%)
Place of birth for the foreign-born population - Croatia (%)
Place of birth for the foreign-born population - Czechoslovakia (%)
Place of birth for the foreign-born population - Hungary (%)
Place of birth for the foreign-born population - Latvia (%)
Place of birth for the foreign-born population - Lithuania (%)
Place of birth for the foreign-born population - North Macedonia (Macedonia) (%)
Place of birth for the foreign-born population - Moldova (%)
Place of birth for the foreign-born population - Poland (%)
Place of birth for the foreign-born population - Romania (%)
Place of birth for the foreign-born population - Russia (%)
Place of birth for the foreign-born population - Serbia (%)
Place of birth for the foreign-born population - Ukraine (%)
Place of birth for the foreign-born population - Other Eastern Europe (%)
Place of birth for the foreign-born population - China (%)
Place of birth for the foreign-born population - Hong Kong (%)
Place of birth for the foreign-born population - Taiwan (%)
Place of birth for the foreign-born population - Japan (%)
Place of birth for the foreign-born population - Korea (%)
Place of birth for the foreign-born population - Other Eastern Asia (%)
Place of birth for the foreign-born population - Afghanistan (%)
Place of birth for the foreign-born population - Bangladesh (%)
Place of birth for the foreign-born population - India (%)
Place of birth for the foreign-born population - Iran (%)
Place of birth for the foreign-born population - Kazakhstan (%)
Place of birth for the foreign-born population - Nepal (%)
Place of birth for the foreign-born population - Pakistan (%)
Place of birth for the foreign-born population - Sri Lanka (%)
Place of birth for the foreign-born population - Uzbekistan (%)
Place of birth for the foreign-born population - Other South Central Asia (%)
Place of birth for the foreign-born population - Burma (%)
Place of birth for the foreign-born population - Cambodia (%)
Place of birth for the foreign-born population - Indonesia (%)
Place of birth for the foreign-born population - Laos (%)
Place of birth for the foreign-born population - Malaysia (%)
Place of birth for the foreign-born population - Philippines (%)
Place of birth for the foreign-born population - Singapore (%)
Place of birth for the foreign-born population - Thailand (%)
Place of birth for the foreign-born population - Vietnam (%)
Place of birth for the foreign-born population - Other South Eastern Asia (%)
Place of birth for the foreign-born population - Armenia (%)
Place of birth for the foreign-born population - Iraq (%)
Place of birth for the foreign-born population - Israel (%)
Place of birth for the foreign-born population - Jordan (%)
Place of birth for the foreign-born population - Kuwait (%)
Place of birth for the foreign-born population - Lebanon (%)
Place of birth for the foreign-born population - Saudi Arabia (%)
Place of birth for the foreign-born population - Syria (%)
Place of birth for the foreign-born population - Turkey (%)
Place of birth for the foreign-born population - Yemen (%)
Place of birth for the foreign-born population - Other Western Asia (%)
Place of birth for the foreign-born population - Eritrea (%)
Place of birth for the foreign-born population - Ethiopia (%)
Place of birth for the foreign-born population - Kenya (%)
Place of birth for the foreign-born population - Somalia (%)
Place of birth for the foreign-born population - Uganda (%)
Place of birth for the foreign-born population - Zimbabwe (%)
Place of birth for the foreign-born population - Other Eastern Africa (%)
Place of birth for the foreign-born population - Cameroon (%)
Place of birth for the foreign-born population - Congo (%)
Place of birth for the foreign-born population - Democratic Republic of Congo (Zaire) (%)
Place of birth for the foreign-born population - Other Middle Africa (%)
Place of birth for the foreign-born population - Egypt (%)
Place of birth for the foreign-born population - Morocco (%)
Place of birth for the foreign-born population - Sudan (%)
Place of birth for the foreign-born population - Other Northern Africa (%)
Place of birth for the foreign-born population - South Africa (%)
Place of birth for the foreign-born population - Other Southern Africa (%)
Place of birth for the foreign-born population - Cabo Verde (%)
Place of birth for the foreign-born population - Ghana (%)
Place of birth for the foreign-born population - Liberia (%)
Place of birth for the foreign-born population - Nigeria (%)
Place of birth for the foreign-born population - Senegal (%)
Place of birth for the foreign-born population - Sierra Leone (%)
Place of birth for the foreign-born population - Other Western Africa (%)
Place of birth for the foreign-born population - Australia (%)
Place of birth for the foreign-born population - New Zealand (%)
Place of birth for the foreign-born population - Fiji (%)
Place of birth for the foreign-born population - Micronesia (%)
Place of birth for the foreign-born population - Bahamas (%)
Place of birth for the foreign-born population - Barbados (%)
Place of birth for the foreign-born population - Cuba (%)
Place of birth for the foreign-born population - Dominica (%)
Place of birth for the foreign-born population - Dominican Republic (%)
Place of birth for the foreign-born population - Grenada (%)
Place of birth for the foreign-born population - Haiti (%)
Place of birth for the foreign-born population - Jamaica (%)
Place of birth for the foreign-born population - St. Vincent and the Grenadines (%)
Place of birth for the foreign-born population - Trinidad and Tobago (%)
Place of birth for the foreign-born population - West Indies (%)
Place of birth for the foreign-born population - Other Caribbean (%)
Place of birth for the foreign-born population - Belize (%)
Place of birth for the foreign-born population - Costa Rica (%)
Place of birth for the foreign-born population - El Salvador (%)
Place of birth for the foreign-born population - Guatemala (%)
Place of birth for the foreign-born population - Honduras (%)
Place of birth for the foreign-born population - Mexico (%)
Place of birth for the foreign-born population - Nicaragua (%)
Place of birth for the foreign-born population - Panama (%)
Place of birth for the foreign-born population - Other Central America (%)
Place of birth for the foreign-born population - Argentina (%)
Place of birth for the foreign-born population - Bolivia (%)
Place of birth for the foreign-born population - Brazil (%)
Place of birth for the foreign-born population - Chile (%)
Place of birth for the foreign-born population - Colombia (%)
Place of birth for the foreign-born population - Ecuador (%)
Place of birth for the foreign-born population - Guyana (%)
Place of birth for the foreign-born population - Peru (%)
Place of birth for the foreign-born population - Uruguay (%)
Place of birth for the foreign-born population - Venezuela (%)
Place of birth for the foreign-born population - Other South America (%)
Place of birth for the foreign-born population - Canada (%)
Place of birth for the foreign-born population - Other Northern America (%)
Place of birth for the foreign-born population - Other (%)
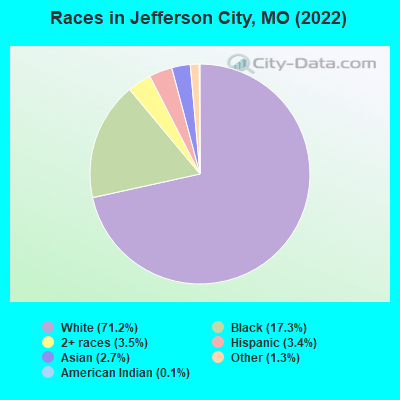
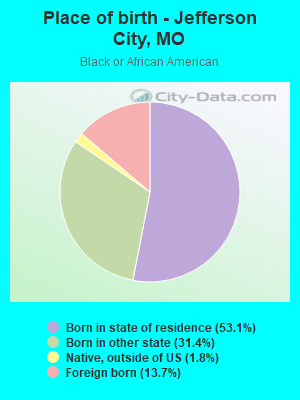
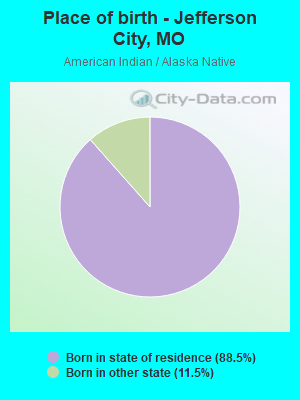
According to 2022 data, the most numerous races in Jefferson City, MO are White alone (30,482 residents), Black alone (7,390 residents), and Two or more races (1,500 residents). 94.0% of Jefferson City residents speak English at home. 4.1% of Jefferson City, MO residents are foreign-born (1.8% born in Asia, 1.3% born in Latin America, 0.8% born in Africa), which is 2.3% greater than the foreign-born rate of 4.0% across the entire state of Missouri.
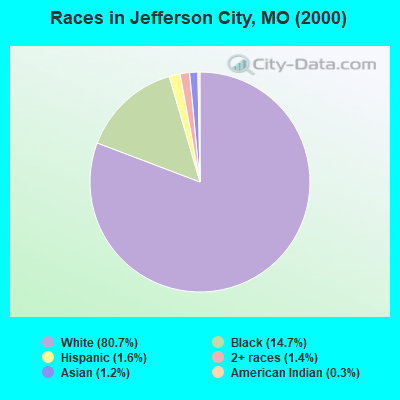
Race distribution in Jefferson City
2000 2022
4,686,474 83.8% White alone 625,667 11.2% Black alone 118,592 2.1% Hispanic 71,905 1.3% Two or more races 61,041 1.1% Asian alone 23,302 0.4% American Indian alone 5,291 0.09% Other race alone 2,939 0.05% Native Hawaiian and Other
4,733,411 76.6% White alone 656,739 10.6% Black alone 316,300 5.1% Two or more races 291,763 4.7% Hispanic 132,436 2.1% Asian alone 27,467 0.4% Other race alone 12,313 0.2% American Indian alone 7,528 0.1% Native Hawaiian and Other
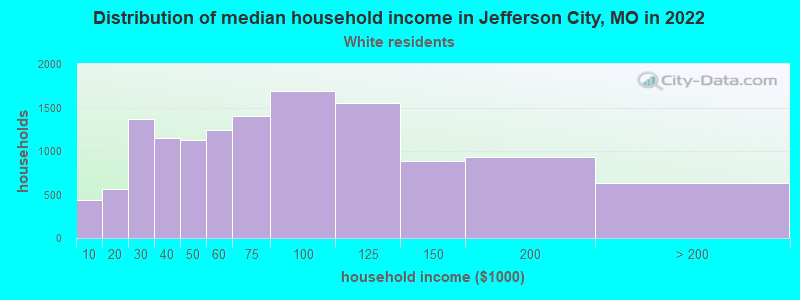
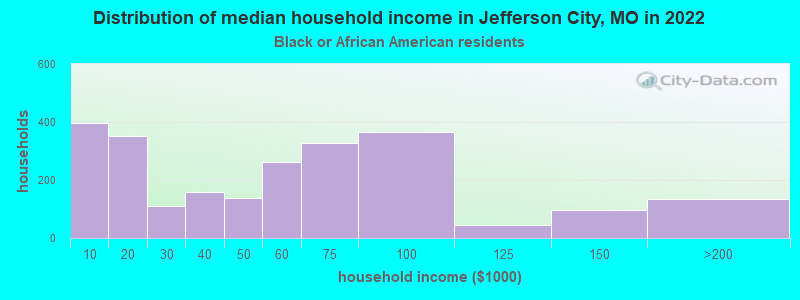
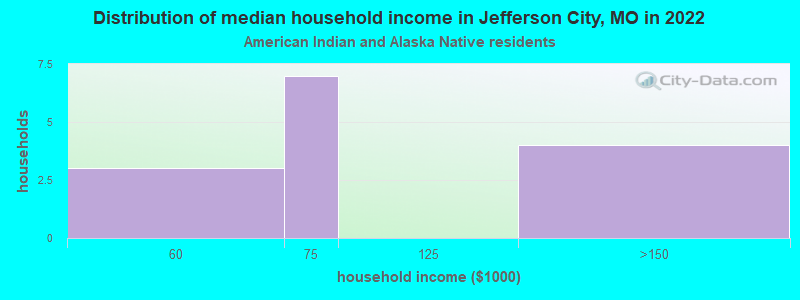
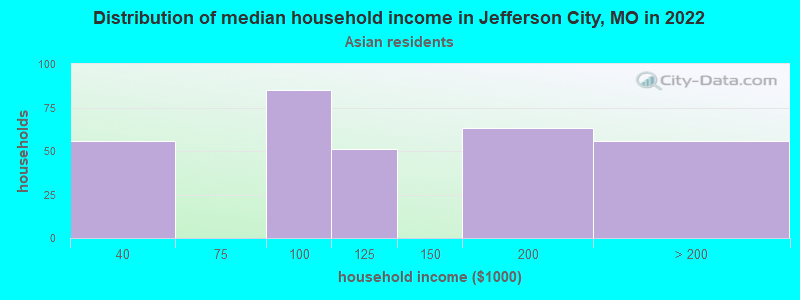
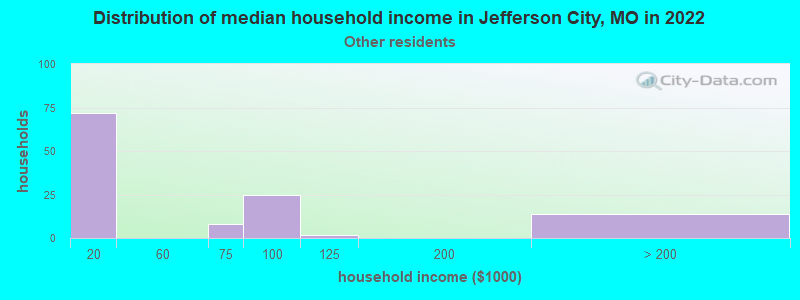
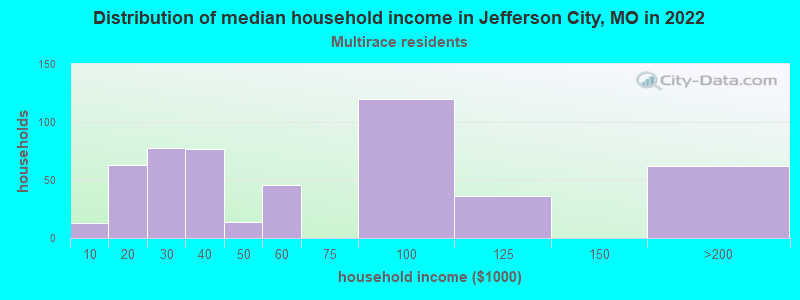
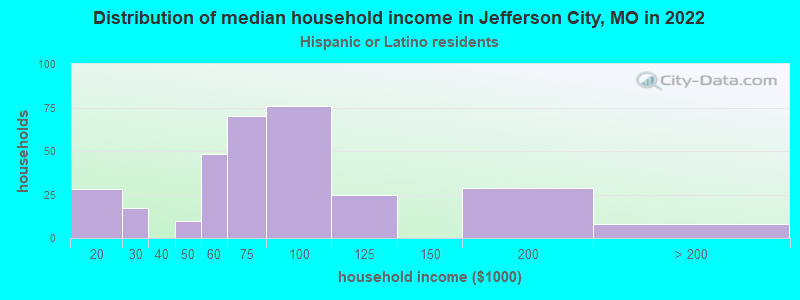
Income and house value in Jefferson City Median household income in 2022 $68,341 White non-Hispanic householders$56,349 Black householders$91,717 American Indian and Alaska Native householdersover $200,000 Asian householders$47,192 Two or more races householders$43,053 Hispanic or Latino race householdersMedian 2022 house value $205,033 White Non-Hispanic householders$170,067 Black or African American householders$223,446 American Indian or Alaska Native householders $287,791 Asian householders$118,964 Some other race householders$161,378 Two or more races householders$195,309 Hispanic or Latino householders
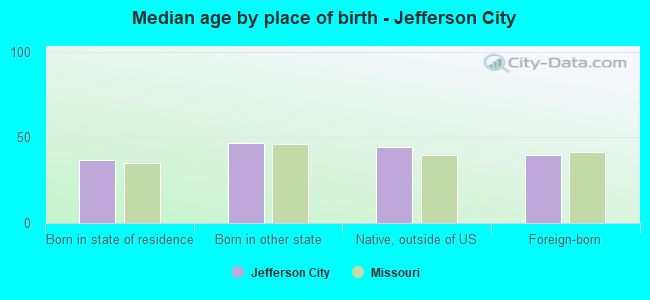
Median age by race in Jefferson City
43.7 Median age for White residents41.4 46.1 33.2 Median age for Black or African American residents33.0 34.6 37.5 Median age for American Indian / Alaska Native residents56.8 -576,856,648.8 35.4 Median age for Asian residents40.5 31.2 -666,666,666.0 Median age for Native Hawaiian / Pacific Islander residents-666,666,666.0 -666,666,666.0 29.6 Median age for Other race residents19.1 17.3 40.3 Median age for Two or more races residents45.2 36.3 44.2 Median age for White alone residents41.6 46.6 35.0 Median age for Hispanic or Latino residents31.6 42.4
Owner/renter occupied households by race in Jefferson City
House owners and renters - White residents 8,177 62.4% Owner occupied4,919 37.6% Renter occupiedHouse owners and renters - Black or African American residents 487 21.9% Owner occupied1,741 78.1% Renter occupiedHouse owners and renters - American Indian / Alaska Native residents 4 35.6% Owner occupied8 64.4% Renter occupiedHouse owners and renters - Asian residents 183 46.8% Owner occupied208 53.2% Renter occupiedHouse owners and renters - Other race residents 26 18.8% Owner occupied113 81.2% Renter occupiedHouse owners and renters - Two or more races residents 249 46.5% Owner occupied287 53.5% Renter occupiedHouse owners and renters - White alone residents 8,147 62.8% Owner occupied4,828 37.2% Renter occupiedHouse owners and renters - Hispanic or Latino residents 207 33.6% Owner occupied408 66.4% Renter occupied
Language usage in Jefferson City
English speakers - Total 94.0% of residents of Jefferson City speak English at home.
2.2% of residents speak Spanish at home 633 71.3% Speak English very well255 28.7% Speak English less than very well3.8% of residents speak other language at home 895 58.6% Speak English very well632 41.4% Speak English less than very well
English speakers - Born in the United States 95.0% of residents of Jefferson City speak English at home.
2.5% of residents speak Spanish at home 241 85.2% Speak English very well42 14.8% Speak English less than very well2.4% of residents speak other language at home 200 71.2% Speak English very well81 28.8% Speak English less than very well
All residents speak only English at home
English speakers - Foreign-born 23.3% of residents of Jefferson City speak English at home.
21.0% of residents speak Spanish at home 202 55.0% Speak English very well165 45.0% Speak English less than very well55.4% of residents speak other language at home 481 49.6% Speak English very well488 50.4% Speak English less than very well
White (Caucasian) - Speak only English Native:
98.7% (28,327)Foreign-born:
30.0% (66)
White (Caucasian) - Speak another language Native:
1.2% (347)Foreign-born:
93.2% (205)
Black or African American - Speak only English Native:
98.0% (6,235)Foreign-born:
57.5% (312)
Black or African American - Speak another language Native:
1.7% (111)Foreign-born:
42.9% (233)
Asian - Speak only English Native:
12.0% (45)Foreign-born:
5.6% (41)
Asian - Speak another language Native:
75.9% (288)Foreign-born:
94.5% (683)
Other race - Speak another language Native:
7.0% (29)Foreign-born:
94.9% (24)
Two or more races - Speak only English Native:
89.0% (1,516)Foreign-born:
4.0% (14)
Two or more races - Speak another language Native:
11.3% (193)Foreign-born:
99.1% (336)
White alone - Speak only English Native:
98.8% (28,126)Foreign-born:
59.0% (67)
White alone - Speak another language Native:
1.2% (351)Foreign-born:
36.1% (41)
Hispanic or Latino - Speak another language Native:
33.7% (314)Foreign-born:
99.4% (341)
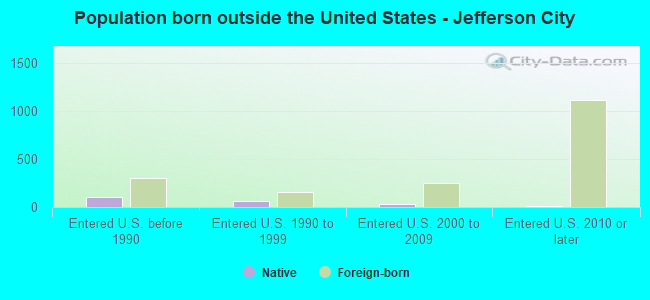
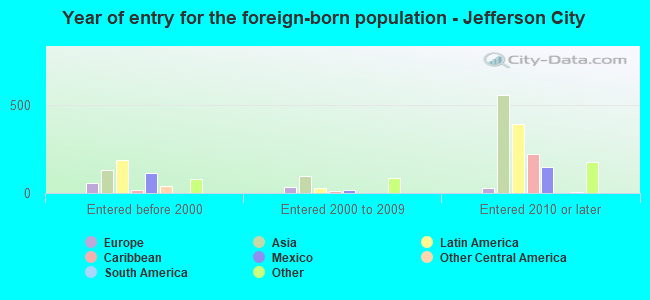
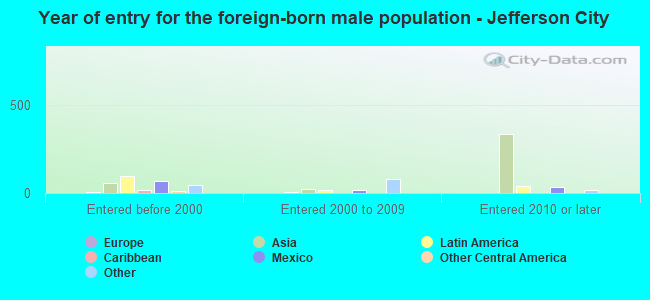
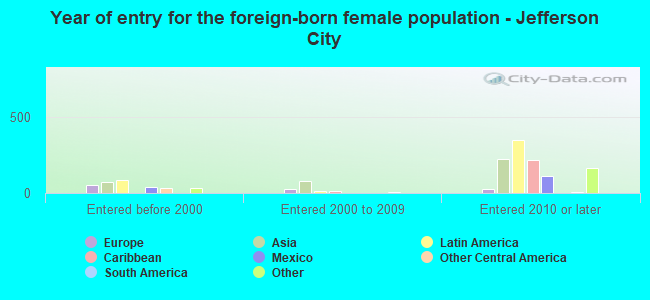
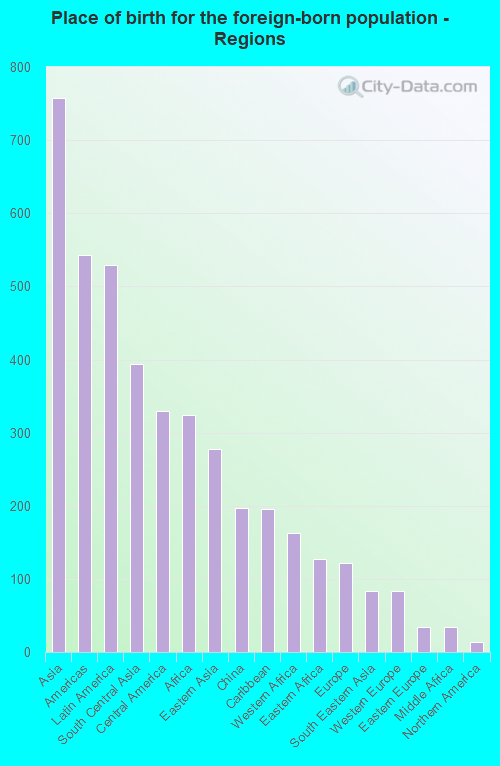
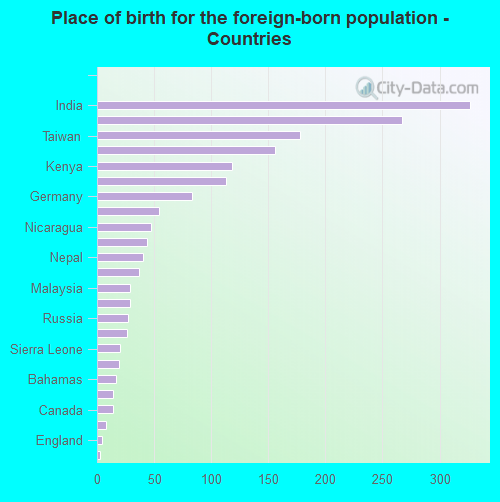
Foreign-born residents in Jefferson City 1,748 residents are foreign born (1.8% Asia , 1.3% Latin America , 0.8% Africa ).
This city:
4.1%Missouri:
4.2%
Marital status for residents in Jefferson City Marital status - White (Caucasian) population 15 years and over
Males 32.7% Never married48.3% Now married1.3% Separated3.5% Widowed14.1% DivorcedFemales 25.1% Never married45.1% Now married0.7% Separated9.6% Widowed19.4% DivorcedWomen who gave birth in the past 12 months Now married:
64.8% (240)Unmarried:
35.2% (130)
Women who did not give birth in the past 12 months Now married:
41.2% (2,229)Unmarried:
58.8% (3,180)
Marital status - Black or African American population 15 years and over
Males 58.7% Never married30.0% Now married0.1% Separated2.0% Widowed9.1% DivorcedFemales 56.9% Never married26.0% Now married4.3% Separated3.0% Widowed9.9% DivorcedWomen who gave birth in the past 12 months Now married:
73.5% (47)Unmarried:
26.5% (17)
Women who did not give birth in the past 12 months Now married:
31.1% (592)Unmarried:
68.9% (1,314)
Marital status - Asian population 15 years and over
Males 8.0% Never married90.5% Now married0.0% Separated0.0% Widowed1.5% DivorcedFemales 21.3% Never married78.7% Now married0.0% Separated0.0% Widowed0.0% DivorcedWomen who did not give birth in the past 12 months Now married:
73.2% (300)Unmarried:
26.8% (110)
Marital status - Other race population 15 years and over
Males 38.6% Never married40.1% Now married10.9% Separated0.0% Widowed10.4% DivorcedFemales 4.9% Never married81.5% Now married0.0% Separated6.2% Widowed7.4% DivorcedWomen who did not give birth in the past 12 months Now married:
84.6% (80)Unmarried:
15.4% (15)
Marital status - Two or more races population 15 years and over
Males 59.0% Never married25.0% Now married2.3% Separated5.3% Widowed8.3% DivorcedFemales 39.6% Never married35.3% Now married0.0% Separated8.9% Widowed16.3% DivorcedWomen who gave birth in the past 12 months Now married:
0.0% (0)Unmarried:
100.0% (22)
Women who did not give birth in the past 12 months Now married:
37.4% (200)Unmarried:
62.6% (336)
Marital status - White alone, not Hispanic / Latino population 15 years and over
Males 32.7% Never married48.0% Now married1.4% Separated3.6% Widowed14.4% DivorcedFemales 24.4% Never married45.1% Now married0.8% Separated9.9% Widowed19.8% DivorcedWomen who gave birth in the past 12 months Now married:
64.8% (244)Unmarried:
35.2% (132)
Women who did not give birth in the past 12 months Now married:
40.5% (2,133)Unmarried:
59.5% (3,128)
Marital status - Hispanic or Latino population 15 years and over
Males 47.5% Never married40.0% Now married6.6% Separated0.9% Widowed5.1% DivorcedFemales 44.1% Never married45.7% Now married0.0% Separated6.9% Widowed3.4% DivorcedWomen who did not give birth in the past 12 months Now married:
54.6% (253)Unmarried:
45.4% (210)
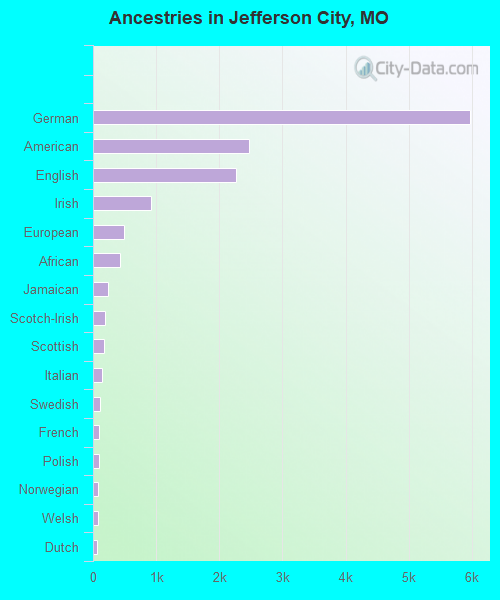
Ancestries in Jefferson City
5,973 26.8% German2,477 11.1% American2,263 10.2% English919 4.1% Irish492 2.2% European434 1.9% African233 1.0% Jamaican187 0.8% Scotch-Irish181 0.8% Scottish138 0.6% Italian116 0.5% Swedish102 0.5% French101 0.5% Polish83 0.4% Norwegian75 0.3% Welsh62 0.3% Dutch53 0.2% Ukrainian43 0.2% Nigerian39 0.2% Hungarian35 0.2% Croatian31 0.1% Iranian29 0.1% Swiss23 0.1% British West Indian21 0.09% Slovak21 0.09% Haitian20 0.09% Austrian16 0.07% Canadian16 0.07% Russian14 0.06% Palestinian14 0.06% British12 0.05% Czech10 0.04% Scandinavian9 0.04% Northern European6 0.03% Eastern European6 0.03% Moroccan4 0.02% French Canadian2 0.01% Danish
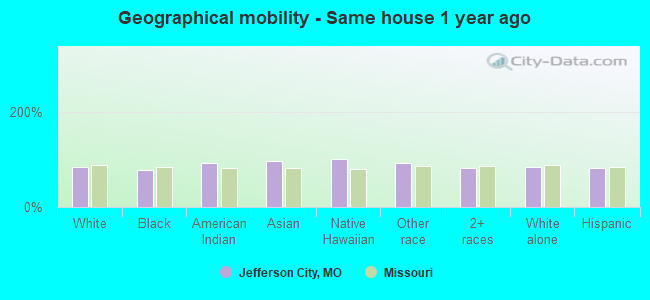
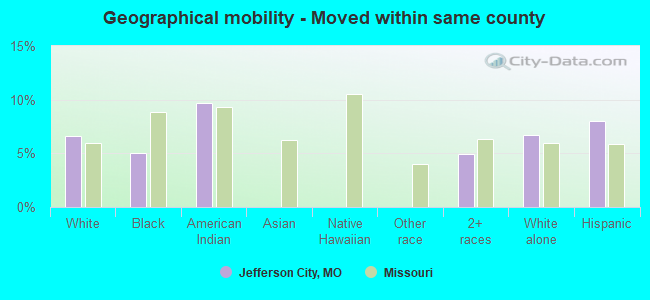
Geographical mobility in Jefferson City Same house 1 year ago 25,032 83.6% White (Caucasian)4,191 76.5% Black or African American47 91.9% American Indian / Alaska Native1,147 97.0% Asian5 100.0% Native Hawaiian / Pacific Islander577 93.4% Other race1,761 82.3% Two or more races24,716 83.5% White alone, not Hispanic / Latino1,193 80.9% Hispanic or LatinoMoved within same county 1,989 6.6% White / Caucasian275 5.0% Black or African American5 9.7% American Indian / Alaska Native106 5.0% Two or more races1,971 6.7% White alone, not Hispanic / Latino118 8.0% Hispanic or LatinoMoved within same state 2,359 7.9% White / Caucasian378 6.9% Black or African American55 8.9% Other race182 8.5% Two or more races2,340 7.9% White alone, not Hispanic / Latino114 7.8% Hispanic or LatinoMoved from different state 572 1.9% White / Caucasian341 6.2% Black or African American1 0.1% Asian85 4.0% Two or more races571 1.9% White alone, not Hispanic / Latino49 3.3% Hispanic or LatinoMoved from abroad 49 0.2% White146 2.7% Black or African American41 3.4% Asian5 0.2% Two or more races52 0.2% White alone, not Hispanic / Latino
Children Nativity (place of birth) in Jefferson City
Children under 6 years - Living with two parents Both parents native 1,884 100.0% Native1 0.0% Foreign-bornBoth parents foreign-born 169 97.4% Native5 2.6% Foreign-bornOne native, one foreign-born parent 167 100.0% NativeChildren under 6 years - Living with one parent Native parent 846 100.0% NativeForeign-born parent 13 100.0% NativeChildren 6 to 17 years - Living with two parents Both parents native 2,772 99.5% Native15 0.5% Foreign-bornBoth parents foreign-born 308 87.4% Native44 12.6% Foreign-bornOne native, one foreign-born parent 32 100.0% NativeChildren 6 to 17 years - Living with one parent Native parent 1,920 97.1% Native58 2.9% Foreign-bornForeign-born parent 81 81.7% Native18 18.3% Foreign-born
Grandparents responsible for own grandchildren in Jefferson City
Grandparents (30 to 59 years) White / Caucasian 93 48.7% Responsible for grandchildren98 51.3% Not responsible for grandchildrenBlack or African American 19 100.0% Not responsible for grandchildrenTwo or more races 1 92.7% Responsible for grandchildrenWhite alone, not Hispanic / Latino 40 28.6% Responsible for grandchildren100 71.4% Not responsible for grandchildrenHispanic or Latino 79 100.0% Responsible for grandchildrenGrandparents (60 years and over) White / Caucasian 32 47.8% Responsible for grandchildren35 52.2% Not responsible for grandchildrenBlack or African American 22 100.0% Not responsible for grandchildrenTwo or more races 27 100.0% Not responsible for grandchildrenWhite alone, not Hispanic / Latino 33 47.4% Responsible for grandchildren36 52.6% Not responsible for grandchildrenHispanic or Latino 18 100.0% Not responsible for grandchildren