Races in Jamestown, New York (NY) Detailed Stats
Data:
Races - White alone (%)
Races - White alone (% change since 2000)
Races - Black alone (%)
Races - Black alone (% change since 2000)
Races - American Indian alone (%)
Races - American Indian alone (% change since 2000)
Races - Asian alone (%)
Races - Asian alone (% change since 2000)
Races - Hispanic (%)
Races - Hispanic (% change since 2000)
Races - Native Hawaiian and Other Pacific Islander alone (%)
Races - Native Hawaiian and Other Pacific Islander alone (% change since 2000)
Races - Two or more races(%)
Races - Two or more races(% change since 2000)
Races - Other race alone (%)
Races - Other race alone (% change since 2000)
Racial diversity
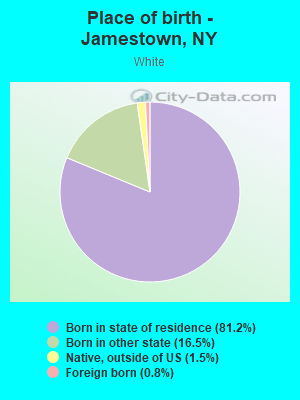
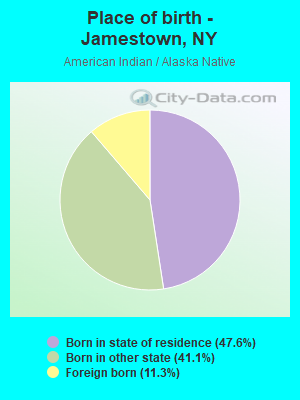
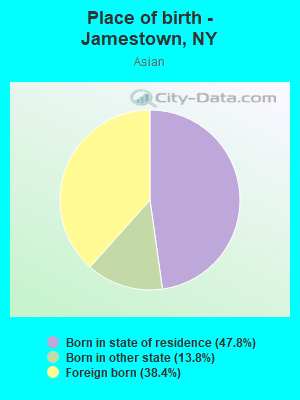
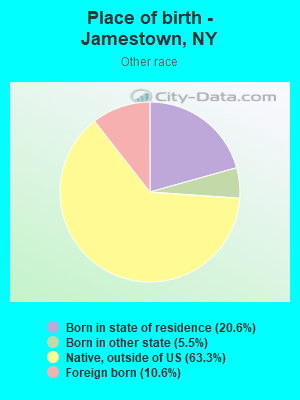
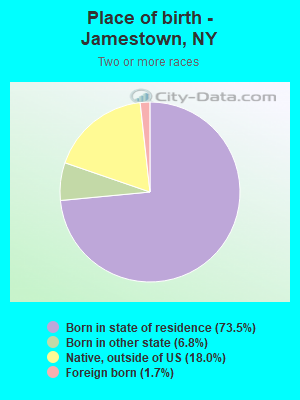
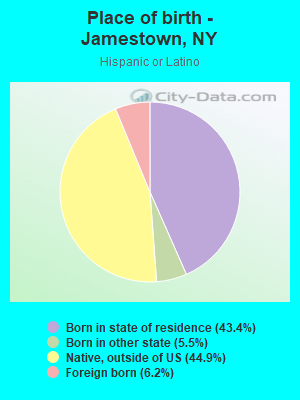
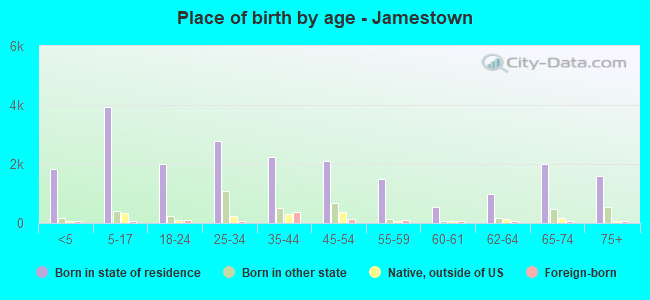
Place of birth - Born in state of residence (%)
Place of birth - Born in state of residence (%) - White
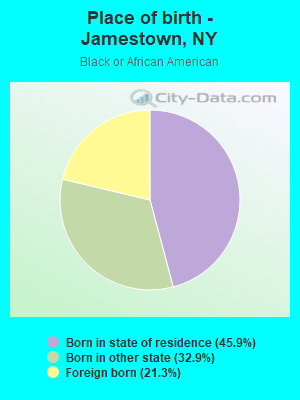
Place of birth - Born in state of residence (%) - Black or African American
Place of birth - Born in state of residence (%) - Asian
Place of birth - Born in state of residence (%) - Hispanic or Latino
Place of birth - Born in state of residence (%) - American Indian and Alaska Native
Place of birth - Born in state of residence (%) - Multirace
Place of birth - Born in state of residence (%) - Other Race
Place of birth - Born in other state (%)
Place of birth - Born in other state (%) - White
Place of birth - Born in other state (%) - Black or African American
Place of birth - Born in other state (%) - Asian
Place of birth - Born in other state (%) - Hispanic or Latino
Place of birth - Born in other state (%) - American Indian and Alaska Native
Place of birth - Born in other state (%) - Multirace
Place of birth - Born in other state (%) - Other Race
Place of birth - Native, outside of US (%)
Place of birth - Native, outside of US (%) - White
Place of birth - Native, outside of US (%) - Black or African American
Place of birth - Native, outside of US (%) - Asian
Place of birth - Native, outside of US (%) - Hispanic or Latino
Place of birth - Native, outside of US (%) - American Indian and Alaska Native
Place of birth - Native, outside of US (%) - Multirace
Place of birth - Native, outside of US (%) - Other Race
Place of birth - Foreign born (%)
Place of birth - Foreign born (%) - White
Place of birth - Foreign born (%) - Black or African American
Place of birth - Foreign born (%) - Asian
Place of birth - Foreign born (%) - Hispanic or Latino
Place of birth - Foreign born (%) - American Indian and Alaska Native
Place of birth - Foreign born (%) - Multirace
Place of birth - Foreign born (%) - Other Race
Residents speaking English at home (%)
Residents speaking English at home - Born in the United States (%)
Residents speaking English at home - Native, born elsewhere (%)
Residents speaking English at home - Foreign born (%)
Residents speaking Spanish at home (%)
Residents speaking Spanish at home - Born in the United States (%)
Residents speaking Spanish at home - Native, born elsewhere (%)
Residents speaking Spanish at home - Foreign born (%)
Residents speaking other language at home (%)
Residents speaking other language at home - Born in the United States (%)
Residents speaking other language at home - Native, born elsewhere (%)
Residents speaking other language at home - Foreign born (%)
Marital status - Never married (%)
Marital status - Now married (%)
Marital status - Separated (%)
Marital status - Widowed (%)
Marital status - Divorced (%)
Ancestries Reported - Arab (%)
Ancestries Reported - Czech (%)
Ancestries Reported - Danish (%)
Ancestries Reported - Dutch (%)
Ancestries Reported - English (%)
Ancestries Reported - French (%)
Ancestries Reported - French Canadian (%)
Ancestries Reported - German (%)
Ancestries Reported - Greek (%)
Ancestries Reported - Hungarian (%)
Ancestries Reported - Irish (%)
Ancestries Reported - Italian (%)
Ancestries Reported - Lithuanian (%)
Ancestries Reported - Norwegian (%)
Ancestries Reported - Polish (%)
Ancestries Reported - Portuguese (%)
Ancestries Reported - Russian (%)
Ancestries Reported - Scotch-Irish (%)
Ancestries Reported - Scottish (%)
Ancestries Reported - Slovak (%)
Ancestries Reported - Subsaharan African (%)
Ancestries Reported - Swedish (%)
Ancestries Reported - Swiss (%)
Ancestries Reported - Ukrainian (%)
Ancestries Reported - United States (%)
Ancestries Reported - Welsh (%)
Ancestries Reported - West Indian (%)
Ancestries Reported - Other (%)
Geographical mobility - Same house 1 year ago (%)
Geographical mobility - Same house 1 year ago (%) - White
Geographical mobility - Same house 1 year ago (%) - Black or African American
Geographical mobility - Same house 1 year ago (%) - Asian
Geographical mobility - Same house 1 year ago (%) - Hispanic or Latino
Geographical mobility - Same house 1 year ago (%) - American Indian and Alaska Native
Geographical mobility - Same house 1 year ago (%) - Multirace
Geographical mobility - Same house 1 year ago (%) - Other Race
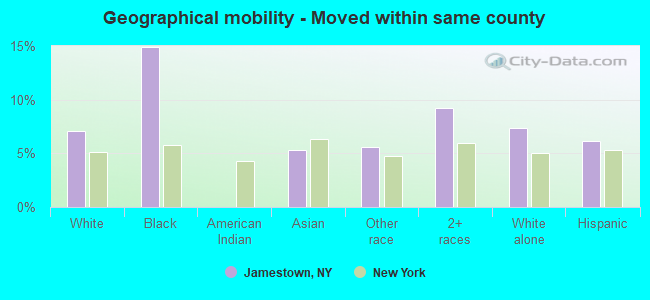
Geographical mobility - Moved within same county (%)
Geographical mobility - Moved within same county (%) - White
Geographical mobility - Moved within same county (%) - Black or African American
Geographical mobility - Moved within same county (%) - Asian
Geographical mobility - Moved within same county (%) - Hispanic or Latino
Geographical mobility - Moved within same county (%) - American Indian and Alaska Native
Geographical mobility - Moved within same county (%) - Multirace
Geographical mobility - Moved within same county (%) - Other Race
Geographical mobility - Moved from different county within same state (%)
Geographical mobility - Moved from different county within same state (%) - White
Geographical mobility - Moved from different county within same state (%) - Black or African American
Geographical mobility - Moved from different county within same state (%) - Asian
Geographical mobility - Moved from different county within same state (%) - Hispanic or Latino
Geographical mobility - Moved from different county within same state (%) - American Indian and Alaska Native
Geographical mobility - Moved from different county within same state (%) - Multirace
Geographical mobility - Moved from different county within same state (%) - Other Race
Geographical mobility - Moved from different state (%)
Geographical mobility - Moved from different state (%) - White
Geographical mobility - Moved from different state (%) - Black or African American
Geographical mobility - Moved from different state (%) - Asian
Geographical mobility - Moved from different state (%) - Hispanic or Latino
Geographical mobility - Moved from different state (%) - American Indian and Alaska Native
Geographical mobility - Moved from different state (%) - Multirace
Geographical mobility - Moved from different state (%) - Other Race
Geographical mobility - Moved from abroad (%)
Geographical mobility - Moved from abroad (%) - White
Geographical mobility - Moved from abroad (%) - Black or African American
Geographical mobility - Moved from abroad (%) - Asian
Geographical mobility - Moved from abroad (%) - Hispanic or Latino
Geographical mobility - Moved from abroad (%) - American Indian and Alaska Native
Geographical mobility - Moved from abroad (%) - Multirace
Geographical mobility - Moved from abroad (%) - Other Race
Place of birth for the foreign-born population - Ireland (%)
Place of birth for the foreign-born population - Denmark (%)
Place of birth for the foreign-born population - Norway (%)
Place of birth for the foreign-born population - Sweden (%)
Place of birth for the foreign-born population - United Kingdom (%)
Place of birth for the foreign-born population - England (%)
Place of birth for the foreign-born population - Scotland (%)
Place of birth for the foreign-born population - Other Northern Europe (%)
Place of birth for the foreign-born population - Austria (%)
Place of birth for the foreign-born population - Belgium (%)
Place of birth for the foreign-born population - France (%)
Place of birth for the foreign-born population - Germany (%)
Place of birth for the foreign-born population - Netherlands (%)
Place of birth for the foreign-born population - Switzerland (%)
Place of birth for the foreign-born population - Other Western Europe (%)
Place of birth for the foreign-born population - Greece (%)
Place of birth for the foreign-born population - Italy (%)
Place of birth for the foreign-born population - Portugal (%)
Place of birth for the foreign-born population - Spain (%)
Place of birth for the foreign-born population - Other Southern Europe (%)
Place of birth for the foreign-born population - Albania (%)
Place of birth for the foreign-born population - Belarus (%)
Place of birth for the foreign-born population - Bosnia and Herzegovina (%)
Place of birth for the foreign-born population - Bulgaria (%)
Place of birth for the foreign-born population - Croatia (%)
Place of birth for the foreign-born population - Czechoslovakia (%)
Place of birth for the foreign-born population - Hungary (%)
Place of birth for the foreign-born population - Latvia (%)
Place of birth for the foreign-born population - Lithuania (%)
Place of birth for the foreign-born population - North Macedonia (Macedonia) (%)
Place of birth for the foreign-born population - Moldova (%)
Place of birth for the foreign-born population - Poland (%)
Place of birth for the foreign-born population - Romania (%)
Place of birth for the foreign-born population - Russia (%)
Place of birth for the foreign-born population - Serbia (%)
Place of birth for the foreign-born population - Ukraine (%)
Place of birth for the foreign-born population - Other Eastern Europe (%)
Place of birth for the foreign-born population - China (%)
Place of birth for the foreign-born population - Hong Kong (%)
Place of birth for the foreign-born population - Taiwan (%)
Place of birth for the foreign-born population - Japan (%)
Place of birth for the foreign-born population - Korea (%)
Place of birth for the foreign-born population - Other Eastern Asia (%)
Place of birth for the foreign-born population - Afghanistan (%)
Place of birth for the foreign-born population - Bangladesh (%)
Place of birth for the foreign-born population - India (%)
Place of birth for the foreign-born population - Iran (%)
Place of birth for the foreign-born population - Kazakhstan (%)
Place of birth for the foreign-born population - Nepal (%)
Place of birth for the foreign-born population - Pakistan (%)
Place of birth for the foreign-born population - Sri Lanka (%)
Place of birth for the foreign-born population - Uzbekistan (%)
Place of birth for the foreign-born population - Other South Central Asia (%)
Place of birth for the foreign-born population - Burma (%)
Place of birth for the foreign-born population - Cambodia (%)
Place of birth for the foreign-born population - Indonesia (%)
Place of birth for the foreign-born population - Laos (%)
Place of birth for the foreign-born population - Malaysia (%)
Place of birth for the foreign-born population - Philippines (%)
Place of birth for the foreign-born population - Singapore (%)
Place of birth for the foreign-born population - Thailand (%)
Place of birth for the foreign-born population - Vietnam (%)
Place of birth for the foreign-born population - Other South Eastern Asia (%)
Place of birth for the foreign-born population - Armenia (%)
Place of birth for the foreign-born population - Iraq (%)
Place of birth for the foreign-born population - Israel (%)
Place of birth for the foreign-born population - Jordan (%)
Place of birth for the foreign-born population - Kuwait (%)
Place of birth for the foreign-born population - Lebanon (%)
Place of birth for the foreign-born population - Saudi Arabia (%)
Place of birth for the foreign-born population - Syria (%)
Place of birth for the foreign-born population - Turkey (%)
Place of birth for the foreign-born population - Yemen (%)
Place of birth for the foreign-born population - Other Western Asia (%)
Place of birth for the foreign-born population - Eritrea (%)
Place of birth for the foreign-born population - Ethiopia (%)
Place of birth for the foreign-born population - Kenya (%)
Place of birth for the foreign-born population - Somalia (%)
Place of birth for the foreign-born population - Uganda (%)
Place of birth for the foreign-born population - Zimbabwe (%)
Place of birth for the foreign-born population - Other Eastern Africa (%)
Place of birth for the foreign-born population - Cameroon (%)
Place of birth for the foreign-born population - Congo (%)
Place of birth for the foreign-born population - Democratic Republic of Congo (Zaire) (%)
Place of birth for the foreign-born population - Other Middle Africa (%)
Place of birth for the foreign-born population - Egypt (%)
Place of birth for the foreign-born population - Morocco (%)
Place of birth for the foreign-born population - Sudan (%)
Place of birth for the foreign-born population - Other Northern Africa (%)
Place of birth for the foreign-born population - South Africa (%)
Place of birth for the foreign-born population - Other Southern Africa (%)
Place of birth for the foreign-born population - Cabo Verde (%)
Place of birth for the foreign-born population - Ghana (%)
Place of birth for the foreign-born population - Liberia (%)
Place of birth for the foreign-born population - Nigeria (%)
Place of birth for the foreign-born population - Senegal (%)
Place of birth for the foreign-born population - Sierra Leone (%)
Place of birth for the foreign-born population - Other Western Africa (%)
Place of birth for the foreign-born population - Australia (%)
Place of birth for the foreign-born population - New Zealand (%)
Place of birth for the foreign-born population - Fiji (%)
Place of birth for the foreign-born population - Micronesia (%)
Place of birth for the foreign-born population - Bahamas (%)
Place of birth for the foreign-born population - Barbados (%)
Place of birth for the foreign-born population - Cuba (%)
Place of birth for the foreign-born population - Dominica (%)
Place of birth for the foreign-born population - Dominican Republic (%)
Place of birth for the foreign-born population - Grenada (%)
Place of birth for the foreign-born population - Haiti (%)
Place of birth for the foreign-born population - Jamaica (%)
Place of birth for the foreign-born population - St. Vincent and the Grenadines (%)
Place of birth for the foreign-born population - Trinidad and Tobago (%)
Place of birth for the foreign-born population - West Indies (%)
Place of birth for the foreign-born population - Other Caribbean (%)
Place of birth for the foreign-born population - Belize (%)
Place of birth for the foreign-born population - Costa Rica (%)
Place of birth for the foreign-born population - El Salvador (%)
Place of birth for the foreign-born population - Guatemala (%)
Place of birth for the foreign-born population - Honduras (%)
Place of birth for the foreign-born population - Mexico (%)
Place of birth for the foreign-born population - Nicaragua (%)
Place of birth for the foreign-born population - Panama (%)
Place of birth for the foreign-born population - Other Central America (%)
Place of birth for the foreign-born population - Argentina (%)
Place of birth for the foreign-born population - Bolivia (%)
Place of birth for the foreign-born population - Brazil (%)
Place of birth for the foreign-born population - Chile (%)
Place of birth for the foreign-born population - Colombia (%)
Place of birth for the foreign-born population - Ecuador (%)
Place of birth for the foreign-born population - Guyana (%)
Place of birth for the foreign-born population - Peru (%)
Place of birth for the foreign-born population - Uruguay (%)
Place of birth for the foreign-born population - Venezuela (%)
Place of birth for the foreign-born population - Other South America (%)
Place of birth for the foreign-born population - Canada (%)
Place of birth for the foreign-born population - Other Northern America (%)
Place of birth for the foreign-born population - Other (%)
Latest news about races in Jamestown, NY collected exclusively by city-data.com from local newspapers, TV, and radio stations
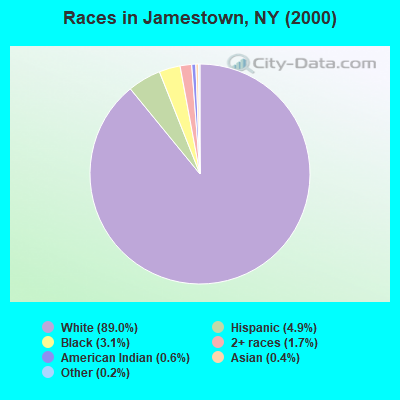
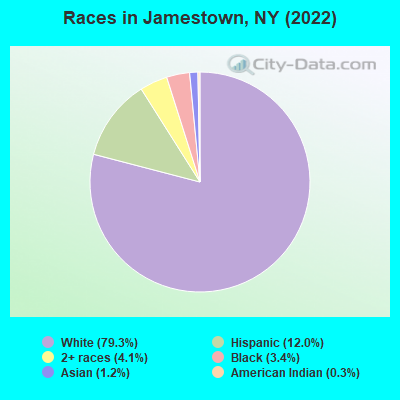
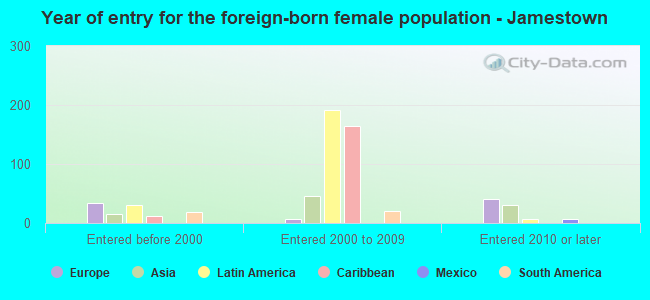
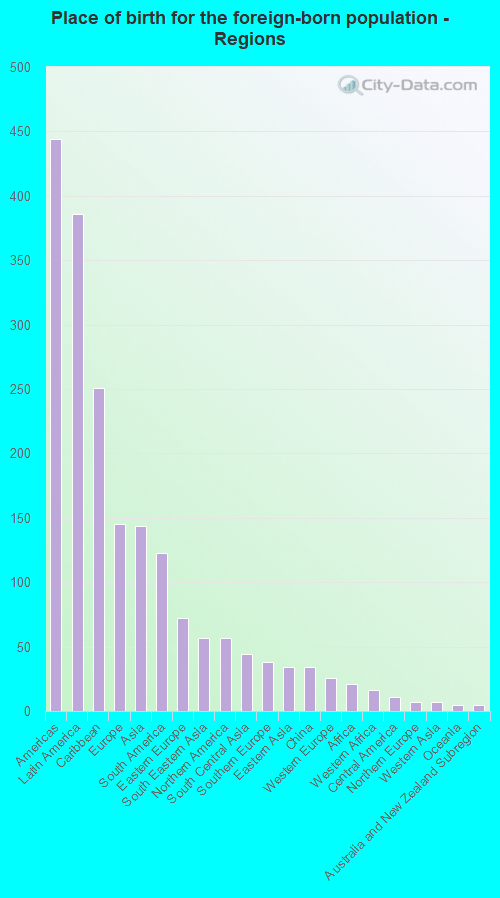
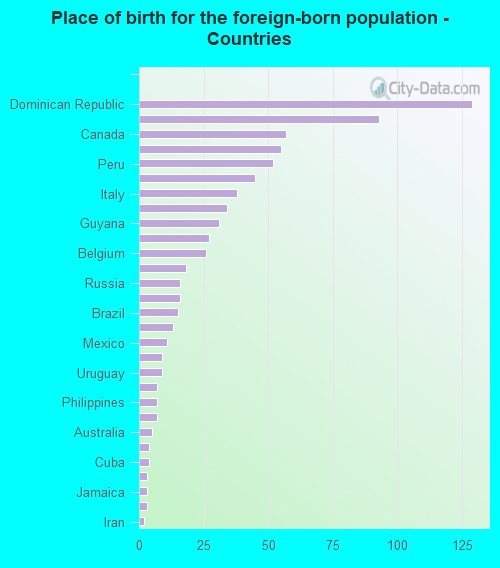
According to 2022 data, the most numerous races in Jamestown, NY are White alone (22,500 residents), Hispanic (3,396 residents), and Black alone (973 residents). 88.0% of Jamestown residents speak English at home. 2.7% of Jamestown, NY residents are foreign-born (1.4% born in Latin America, 0.5% born in Europe, 0.5% born in Asia), which is 719.9% less than the foreign-born rate of 22.0% across the entire state of New York.
Race distribution in Jamestown
2000 2022
11,760,981 62.0% White alone 2,867,583 15.1% Hispanic 2,812,623 14.8% Black alone 1,035,926 5.5% Asian alone 366,116 1.9% Two or more races 75,499 0.4% Other race alone 52,499 0.3% American Indian alone 5,230 0.03% Native Hawaiian and Other
10,408,933 52.9% White alone 3,867,299 19.7% Hispanic 2,633,840 13.4% Black alone 1,776,286 9.0% Asian alone 732,670 3.7% Two or more races 216,110 1.1% Other race alone 35,082 0.2% American Indian alone 6,931 0.04% Native Hawaiian and Other
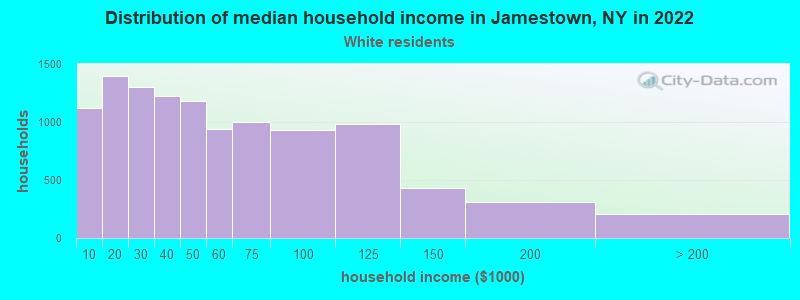
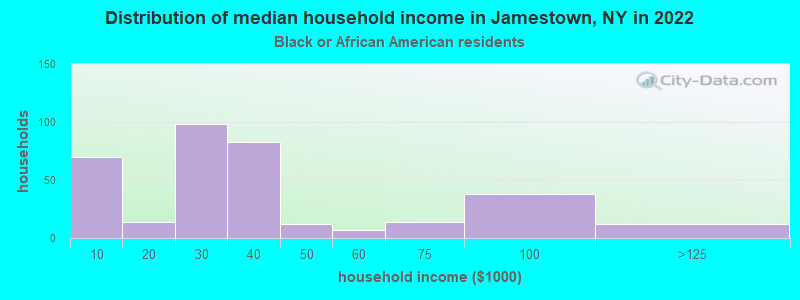
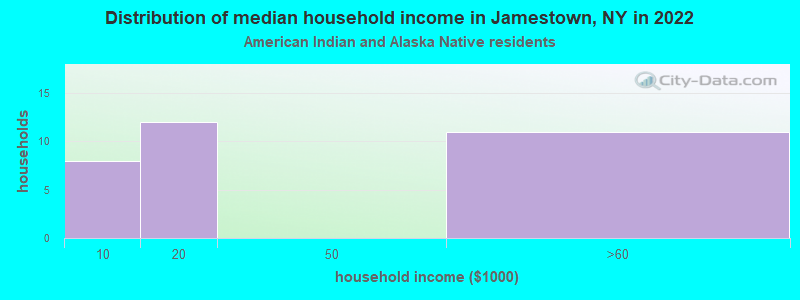
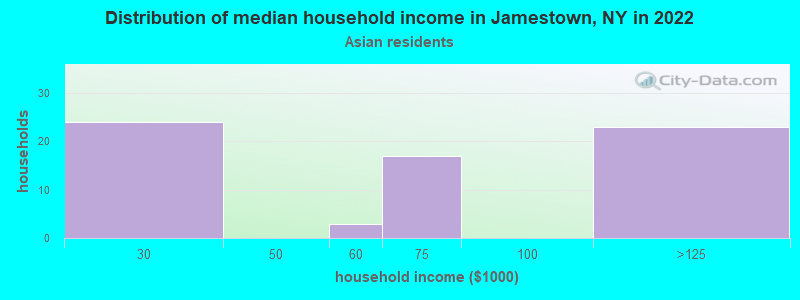
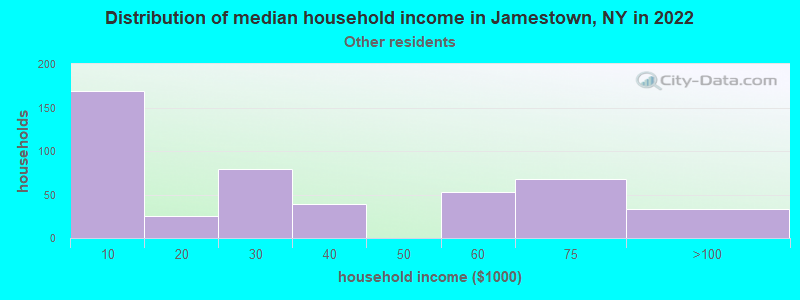
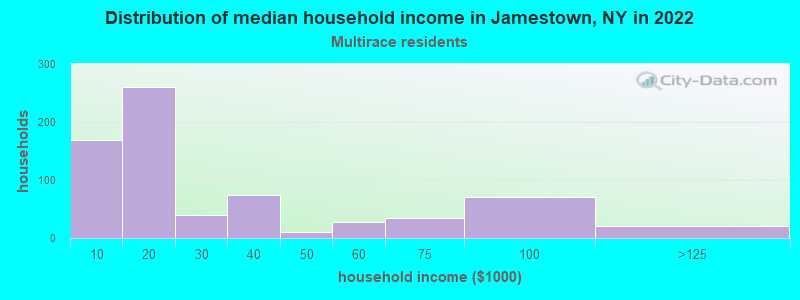
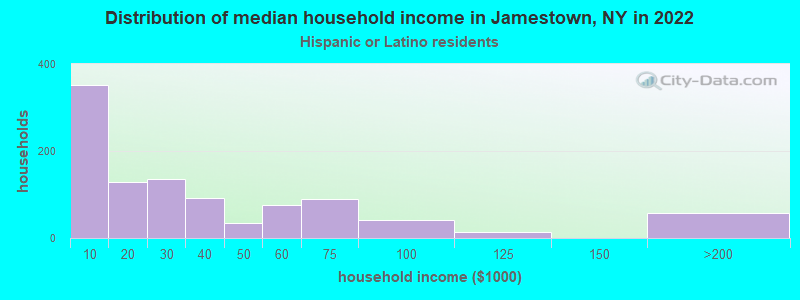
Income and house value in Jamestown Median household income in 2022 $42,233 White non-Hispanic householders$39,422 Black householders$25,947 Some other race householders$16,859 Two or more races householders$24,807 Hispanic or Latino race householdersMedian 2022 house value $88,054 White Non-Hispanic householders$61,422 Black or African American householders$41,613 American Indian or Alaska Native householders $252,679 Asian householders$54,763 Some other race householders$150,975 Two or more races householders$54,930 Hispanic or Latino householders
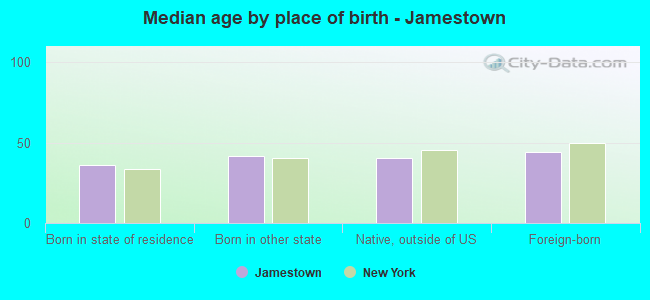
Median age by race in Jamestown
40.1 Median age for White residents40.4 39.9 58.4 Median age for Black or African American residents51.0 53.1 22.2 Median age for American Indian / Alaska Native residents-707,843,136.5 48.1 15.5 Median age for Asian residents11.6 12.8 -487,992,314.6 Median age for Native Hawaiian / Pacific Islander residents-477,502,295.2 -497,387,669.3 30.4 Median age for Other race residents32.3 40.1 13.2 Median age for Two or more races residents18.3 10.8 42.2 Median age for White alone residents41.8 42.0 24.9 Median age for Hispanic or Latino residents25.7 23.1
Owner/renter occupied households by race in Jamestown
House owners and renters - White residents 5,817 52.4% Owner occupied5,284 47.6% Renter occupiedHouse owners and renters - Black or African American residents 144 63.2% Owner occupied84 36.8% Renter occupiedHouse owners and renters - American Indian / Alaska Native residents 12 42.8% Owner occupied16 57.2% Renter occupiedHouse owners and renters - Asian residents 25 35.7% Owner occupied45 64.3% Renter occupiedHouse owners and renters - Other race residents 126 24.0% Owner occupied399 76.0% Renter occupiedHouse owners and renters - Two or more races residents 73 10.7% Owner occupied613 89.3% Renter occupiedHouse owners and renters - White alone residents 5,727 52.8% Owner occupied5,126 47.2% Renter occupiedHouse owners and renters - Hispanic or Latino residents 205 18.5% Owner occupied903 81.5% Renter occupied
Language usage in Jamestown
English speakers - Total 88.0% of residents of Jamestown speak English at home.
7.9% of residents speak Spanish at home 1,201 57.6% Speak English very well885 42.4% Speak English less than very well3.7% of residents speak other language at home 567 57.7% Speak English very well415 42.3% Speak English less than very well
English speakers - Born in the United States 92.2% of residents of Jamestown speak English at home.
2.5% of residents speak Spanish at home 59 56.2% Speak English very well46 43.8% Speak English less than very well3.4% of residents speak other language at home 131 90.3% Speak English very well14 9.7% Speak English less than very well
English speakers - Native, born elsewhere 11.9% of residents of Jamestown speak English at home.
87.3% of residents speak Spanish at home 760 48.6% Speak English very well804 51.4% Speak English less than very well1.2% of residents speak other language at home 21 100.0% Speak English less than very well
English speakers - Foreign-born 23.2% of residents of Jamestown speak English at home.
15.8% of residents speak Spanish at home 61 44.9% Speak English very well75 55.1% Speak English less than very well65.9% of residents speak other language at home 229 40.5% Speak English very well337 59.5% Speak English less than very well
White (Caucasian) - Speak only English Native:
96.1% (20,986)Foreign-born:
52.2% (98)
White (Caucasian) - Speak another language Native:
3.9% (844)Foreign-born:
29.4% (55)
Black or African American - Speak only English Native:
95.1% (543)Foreign-born:
19.7% (28)
Black or African American - Speak another language Native:
5.2% (29)Foreign-born:
82.7% (118)
American Indian / Alaska Native - Speak another language Native:
23.1% (11)Foreign-born:
100.0% (8)
Asian - Speak only English Native:
100.0% (198)Foreign-born:
14.5% (18)
Other race - Speak only English Native:
12.9% (183)Foreign-born:
5.7% (10)
Other race - Speak another language Native:
87.7% (1,241)Foreign-born:
97.2% (170)
Two or more races - Speak only English Native:
74.0% (1,378)Foreign-born:
28.6% (13)
Two or more races - Speak another language Native:
25.5% (475)Foreign-born:
70.8% (33)
White alone - Speak only English Native:
97.6% (20,362)Foreign-born:
47.4% (82)
White alone - Speak another language Native:
2.2% (449)Foreign-born:
38.7% (67)
Hispanic or Latino - Speak only English Native:
29.4% (837)Foreign-born:
11.7% (26)
Hispanic or Latino - Speak another language Native:
73.1% (2,079)Foreign-born:
87.6% (193)
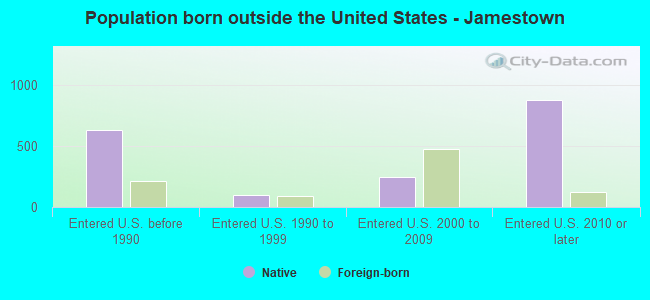
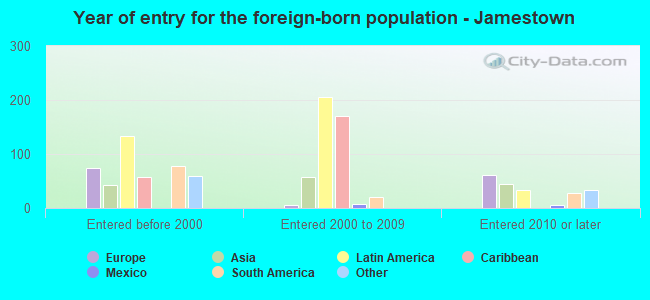
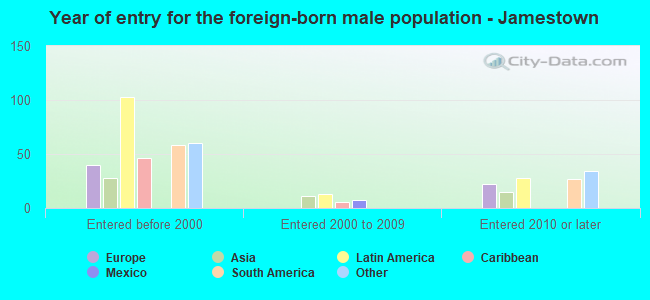
Foreign-born residents in Jamestown 761 residents are foreign born (1.4% Latin America , 0.5% Europe , 0.5% Asia ).
This city:
2.7%New York:
22.6%
Marital status for residents in Jamestown Marital status - White (Caucasian) population 15 years and over
Males 43.0% Never married37.5% Now married2.8% Separated2.9% Widowed13.9% DivorcedFemales 36.4% Never married33.4% Now married1.5% Separated10.8% Widowed17.9% DivorcedWomen who gave birth in the past 12 months Now married:
34.4% (133)Unmarried:
65.6% (254)
Women who did not give birth in the past 12 months Now married:
29.6% (1,503)Unmarried:
70.4% (3,577)
Marital status - Black or African American population 15 years and over
Males 58.5% Never married32.4% Now married3.1% Separated1.8% Widowed4.1% DivorcedFemales 56.2% Never married29.7% Now married0.0% Separated5.1% Widowed9.1% DivorcedWomen who gave birth in the past 12 months Now married:
0.0% (0)Unmarried:
100.0% (6)
Women who did not give birth in the past 12 months Now married:
51.7% (55)Unmarried:
48.3% (51)
Marital status - Asian population 15 years and over
Males 26.9% Never married73.1% Now married0.0% Separated0.0% Widowed0.0% DivorcedFemales 55.6% Never married44.4% Now married0.0% Separated0.0% Widowed0.0% DivorcedWomen who did not give birth in the past 12 months Now married:
17.8% (16)Unmarried:
82.2% (74)
Marital status - Other race population 15 years and over
Males 60.6% Never married37.0% Now married0.0% Separated2.4% Widowed0.0% DivorcedFemales 43.1% Never married24.4% Now married16.4% Separated4.9% Widowed11.2% DivorcedWomen who did not give birth in the past 12 months Now married:
33.8% (175)Unmarried:
66.2% (343)
Marital status - Two or more races population 15 years and over
Males 68.1% Never married11.4% Now married3.8% Separated0.0% Widowed16.7% DivorcedFemales 66.7% Never married16.3% Now married0.0% Separated5.0% Widowed12.0% DivorcedWomen who gave birth in the past 12 months Now married:
30.4% (9)Unmarried:
69.6% (21)
Women who did not give birth in the past 12 months Now married:
15.2% (67)Unmarried:
84.8% (375)
Marital status - White alone, not Hispanic / Latino population 15 years and over
Males 43.1% Never married37.2% Now married2.9% Separated3.0% Widowed13.8% DivorcedFemales 36.2% Never married33.6% Now married1.6% Separated10.8% Widowed17.8% DivorcedWomen who gave birth in the past 12 months Now married:
36.1% (136)Unmarried:
63.9% (240)
Women who did not give birth in the past 12 months Now married:
29.4% (1,445)Unmarried:
70.6% (3,467)
Marital status - Hispanic or Latino population 15 years and over
Males 48.8% Never married36.8% Now married1.8% Separated1.1% Widowed11.5% DivorcedFemales 45.3% Never married26.2% Now married7.7% Separated7.2% Widowed13.5% DivorcedWomen who gave birth in the past 12 months Now married:
0.0% (0)Unmarried:
100.0% (19)
Women who did not give birth in the past 12 months Now married:
32.4% (267)Unmarried:
67.6% (556)
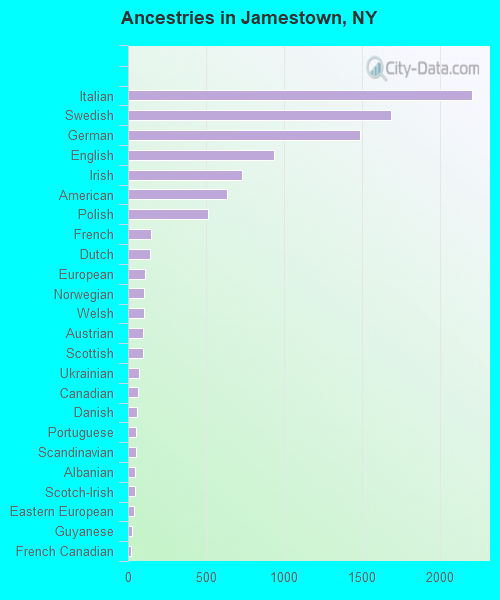
Ancestries in Jamestown
2,204 17.4% Italian1,684 13.3% Swedish1,487 11.7% German936 7.4% English734 5.8% Irish637 5.0% American511 4.0% Polish150 1.2% French142 1.1% Dutch108 0.9% European100 0.8% Norwegian100 0.8% Welsh99 0.8% Austrian93 0.7% Scottish70 0.6% Ukrainian66 0.5% Canadian59 0.5% Danish53 0.4% Portuguese50 0.4% Scandinavian44 0.3% Albanian43 0.3% Scotch-Irish40 0.3% Eastern European26 0.2% Guyanese22 0.2% French Canadian18 0.1% British15 0.1% Brazilian14 0.1% Pennsylvania German13 0.1% Russian12 0.09% African11 0.09% Belgian8 0.06% Turkish8 0.06% Armenian7 0.06% Trinidadian and Tobagonian4 0.03% Australian3 0.02% Swiss3 0.02% Jamaican
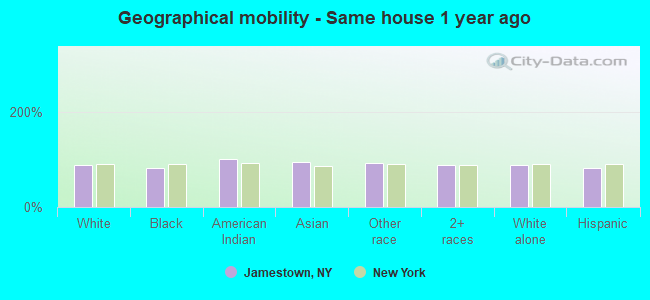
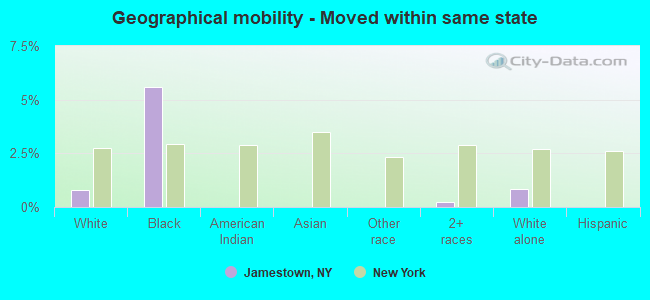
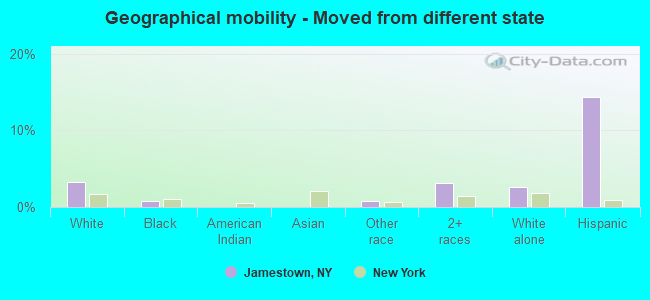
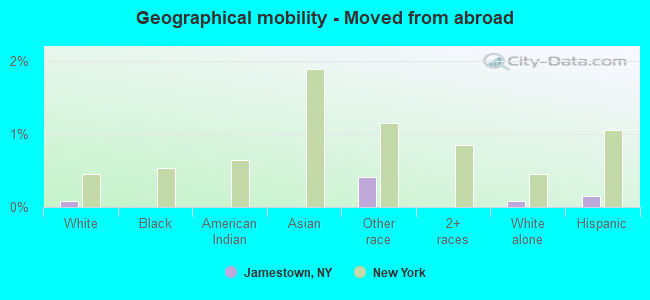
Geographical mobility in Jamestown Same house 1 year ago 20,425 87.4% White (Caucasian)742 82.5% Black or African American73 100.0% American Indian / Alaska Native295 94.0% Asian1,336 93.0% Other race1,875 87.4% Two or more races19,666 88.5% White alone, not Hispanic / Latino2,729 81.9% Hispanic or LatinoMoved within same county 1,663 7.1% White / Caucasian134 14.9% Black or African American17 5.3% Asian80 5.6% Other race198 9.2% Two or more races1,634 7.4% White alone, not Hispanic / Latino206 6.2% Hispanic or LatinoMoved within same state 190 0.8% White / Caucasian50 5.6% Black or African American5 0.3% Two or more races190 0.9% White alone, not Hispanic / LatinoMoved from different state 760 3.3% White / Caucasian7 0.8% Black or African American12 0.8% Other race66 3.1% Two or more races575 2.6% White alone, not Hispanic / Latino476 14.3% Hispanic or LatinoMoved from abroad 19 0.1% White6 0.4% Other race19 0.1% White alone, not Hispanic / Latino5 0.2% Hispanic or Latino
Children Nativity (place of birth) in Jamestown
Children under 6 years - Living with two parents Both parents native 751 100.0% NativeOne native, one foreign-born parent 37 100.0% NativeChildren under 6 years - Living with one parent Native parent 1,430 100.0% NativeForeign-born parent 10 100.0% NativeChildren 6 to 17 years - Living with two parents Both parents native 1,297 96.3% Native50 3.7% Foreign-bornBoth parents foreign-born 68 100.0% NativeOne native, one foreign-born parent 20 100.0% NativeChildren 6 to 17 years - Living with one parent Native parent 2,499 100.0% NativeForeign-born parent 43 50.4% Native43 49.6% Foreign-born
Grandparents responsible for own grandchildren in Jamestown
Grandparents (30 to 59 years) White / Caucasian 443 79.0% Responsible for grandchildren118 21.0% Not responsible for grandchildrenBlack or African American 10 100.0% Responsible for grandchildrenAmerican Indian / Alaska Native 6 100.0% Responsible for grandchildrenOther race 32 18.7% Responsible for grandchildren139 81.3% Not responsible for grandchildrenWhite alone, not Hispanic / Latino 410 77.7% Responsible for grandchildren118 22.3% Not responsible for grandchildrenHispanic or Latino 95 44.2% Responsible for grandchildren120 55.8% Not responsible for grandchildrenGrandparents (60 years and over) White / Caucasian 61 49.0% Responsible for grandchildren63 51.0% Not responsible for grandchildrenBlack or African American 13 100.0% Responsible for grandchildrenWhite alone, not Hispanic / Latino 61 49.0% Responsible for grandchildren63 51.0% Not responsible for grandchildren