Races in Jacksonville Beach, Florida (FL) Detailed Stats
Data:
Races - White alone (%)
Races - White alone (% change since 2000)
Races - Black alone (%)
Races - Black alone (% change since 2000)
Races - American Indian alone (%)
Races - American Indian alone (% change since 2000)
Races - Asian alone (%)
Races - Asian alone (% change since 2000)
Races - Hispanic (%)
Races - Hispanic (% change since 2000)
Races - Native Hawaiian and Other Pacific Islander alone (%)
Races - Native Hawaiian and Other Pacific Islander alone (% change since 2000)
Races - Two or more races(%)
Races - Two or more races(% change since 2000)
Races - Other race alone (%)
Races - Other race alone (% change since 2000)
Racial diversity
Place of birth - Born in state of residence (%)
Place of birth - Born in state of residence (%) - White
Place of birth - Born in state of residence (%) - Black or African American
Place of birth - Born in state of residence (%) - Asian
Place of birth - Born in state of residence (%) - Hispanic or Latino
Place of birth - Born in state of residence (%) - American Indian and Alaska Native
Place of birth - Born in state of residence (%) - Multirace
Place of birth - Born in state of residence (%) - Other Race
Place of birth - Born in other state (%)
Place of birth - Born in other state (%) - White
Place of birth - Born in other state (%) - Black or African American
Place of birth - Born in other state (%) - Asian
Place of birth - Born in other state (%) - Hispanic or Latino
Place of birth - Born in other state (%) - American Indian and Alaska Native
Place of birth - Born in other state (%) - Multirace
Place of birth - Born in other state (%) - Other Race
Place of birth - Native, outside of US (%)
Place of birth - Native, outside of US (%) - White
Place of birth - Native, outside of US (%) - Black or African American
Place of birth - Native, outside of US (%) - Asian
Place of birth - Native, outside of US (%) - Hispanic or Latino
Place of birth - Native, outside of US (%) - American Indian and Alaska Native
Place of birth - Native, outside of US (%) - Multirace
Place of birth - Native, outside of US (%) - Other Race
Place of birth - Foreign born (%)
Place of birth - Foreign born (%) - White
Place of birth - Foreign born (%) - Black or African American
Place of birth - Foreign born (%) - Asian
Place of birth - Foreign born (%) - Hispanic or Latino
Place of birth - Foreign born (%) - American Indian and Alaska Native
Place of birth - Foreign born (%) - Multirace
Place of birth - Foreign born (%) - Other Race
Residents speaking English at home (%)
Residents speaking English at home - Born in the United States (%)
Residents speaking English at home - Native, born elsewhere (%)
Residents speaking English at home - Foreign born (%)
Residents speaking Spanish at home (%)
Residents speaking Spanish at home - Born in the United States (%)
Residents speaking Spanish at home - Native, born elsewhere (%)
Residents speaking Spanish at home - Foreign born (%)
Residents speaking other language at home (%)
Residents speaking other language at home - Born in the United States (%)
Residents speaking other language at home - Native, born elsewhere (%)
Residents speaking other language at home - Foreign born (%)
Marital status - Never married (%)
Marital status - Now married (%)
Marital status - Separated (%)
Marital status - Widowed (%)
Marital status - Divorced (%)
Ancestries Reported - Arab (%)
Ancestries Reported - Czech (%)
Ancestries Reported - Danish (%)
Ancestries Reported - Dutch (%)
Ancestries Reported - English (%)
Ancestries Reported - French (%)
Ancestries Reported - French Canadian (%)
Ancestries Reported - German (%)
Ancestries Reported - Greek (%)
Ancestries Reported - Hungarian (%)
Ancestries Reported - Irish (%)
Ancestries Reported - Italian (%)
Ancestries Reported - Lithuanian (%)
Ancestries Reported - Norwegian (%)
Ancestries Reported - Polish (%)
Ancestries Reported - Portuguese (%)
Ancestries Reported - Russian (%)
Ancestries Reported - Scotch-Irish (%)
Ancestries Reported - Scottish (%)
Ancestries Reported - Slovak (%)
Ancestries Reported - Subsaharan African (%)
Ancestries Reported - Swedish (%)
Ancestries Reported - Swiss (%)
Ancestries Reported - Ukrainian (%)
Ancestries Reported - United States (%)
Ancestries Reported - Welsh (%)
Ancestries Reported - West Indian (%)
Ancestries Reported - Other (%)
Geographical mobility - Same house 1 year ago (%)
Geographical mobility - Same house 1 year ago (%) - White
Geographical mobility - Same house 1 year ago (%) - Black or African American
Geographical mobility - Same house 1 year ago (%) - Asian
Geographical mobility - Same house 1 year ago (%) - Hispanic or Latino
Geographical mobility - Same house 1 year ago (%) - American Indian and Alaska Native
Geographical mobility - Same house 1 year ago (%) - Multirace
Geographical mobility - Same house 1 year ago (%) - Other Race
Geographical mobility - Moved within same county (%)
Geographical mobility - Moved within same county (%) - White
Geographical mobility - Moved within same county (%) - Black or African American
Geographical mobility - Moved within same county (%) - Asian
Geographical mobility - Moved within same county (%) - Hispanic or Latino
Geographical mobility - Moved within same county (%) - American Indian and Alaska Native
Geographical mobility - Moved within same county (%) - Multirace
Geographical mobility - Moved within same county (%) - Other Race
Geographical mobility - Moved from different county within same state (%)
Geographical mobility - Moved from different county within same state (%) - White
Geographical mobility - Moved from different county within same state (%) - Black or African American
Geographical mobility - Moved from different county within same state (%) - Asian
Geographical mobility - Moved from different county within same state (%) - Hispanic or Latino
Geographical mobility - Moved from different county within same state (%) - American Indian and Alaska Native
Geographical mobility - Moved from different county within same state (%) - Multirace
Geographical mobility - Moved from different county within same state (%) - Other Race
Geographical mobility - Moved from different state (%)
Geographical mobility - Moved from different state (%) - White
Geographical mobility - Moved from different state (%) - Black or African American
Geographical mobility - Moved from different state (%) - Asian
Geographical mobility - Moved from different state (%) - Hispanic or Latino
Geographical mobility - Moved from different state (%) - American Indian and Alaska Native
Geographical mobility - Moved from different state (%) - Multirace
Geographical mobility - Moved from different state (%) - Other Race
Geographical mobility - Moved from abroad (%)
Geographical mobility - Moved from abroad (%) - White
Geographical mobility - Moved from abroad (%) - Black or African American
Geographical mobility - Moved from abroad (%) - Asian
Geographical mobility - Moved from abroad (%) - Hispanic or Latino
Geographical mobility - Moved from abroad (%) - American Indian and Alaska Native
Geographical mobility - Moved from abroad (%) - Multirace
Geographical mobility - Moved from abroad (%) - Other Race
Place of birth for the foreign-born population - Ireland (%)
Place of birth for the foreign-born population - Denmark (%)
Place of birth for the foreign-born population - Norway (%)
Place of birth for the foreign-born population - Sweden (%)
Place of birth for the foreign-born population - United Kingdom (%)
Place of birth for the foreign-born population - England (%)
Place of birth for the foreign-born population - Scotland (%)
Place of birth for the foreign-born population - Other Northern Europe (%)
Place of birth for the foreign-born population - Austria (%)
Place of birth for the foreign-born population - Belgium (%)
Place of birth for the foreign-born population - France (%)
Place of birth for the foreign-born population - Germany (%)
Place of birth for the foreign-born population - Netherlands (%)
Place of birth for the foreign-born population - Switzerland (%)
Place of birth for the foreign-born population - Other Western Europe (%)
Place of birth for the foreign-born population - Greece (%)
Place of birth for the foreign-born population - Italy (%)
Place of birth for the foreign-born population - Portugal (%)
Place of birth for the foreign-born population - Spain (%)
Place of birth for the foreign-born population - Other Southern Europe (%)
Place of birth for the foreign-born population - Albania (%)
Place of birth for the foreign-born population - Belarus (%)
Place of birth for the foreign-born population - Bosnia and Herzegovina (%)
Place of birth for the foreign-born population - Bulgaria (%)
Place of birth for the foreign-born population - Croatia (%)
Place of birth for the foreign-born population - Czechoslovakia (%)
Place of birth for the foreign-born population - Hungary (%)
Place of birth for the foreign-born population - Latvia (%)
Place of birth for the foreign-born population - Lithuania (%)
Place of birth for the foreign-born population - North Macedonia (Macedonia) (%)
Place of birth for the foreign-born population - Moldova (%)
Place of birth for the foreign-born population - Poland (%)
Place of birth for the foreign-born population - Romania (%)
Place of birth for the foreign-born population - Russia (%)
Place of birth for the foreign-born population - Serbia (%)
Place of birth for the foreign-born population - Ukraine (%)
Place of birth for the foreign-born population - Other Eastern Europe (%)
Place of birth for the foreign-born population - China (%)
Place of birth for the foreign-born population - Hong Kong (%)
Place of birth for the foreign-born population - Taiwan (%)
Place of birth for the foreign-born population - Japan (%)
Place of birth for the foreign-born population - Korea (%)
Place of birth for the foreign-born population - Other Eastern Asia (%)
Place of birth for the foreign-born population - Afghanistan (%)
Place of birth for the foreign-born population - Bangladesh (%)
Place of birth for the foreign-born population - India (%)
Place of birth for the foreign-born population - Iran (%)
Place of birth for the foreign-born population - Kazakhstan (%)
Place of birth for the foreign-born population - Nepal (%)
Place of birth for the foreign-born population - Pakistan (%)
Place of birth for the foreign-born population - Sri Lanka (%)
Place of birth for the foreign-born population - Uzbekistan (%)
Place of birth for the foreign-born population - Other South Central Asia (%)
Place of birth for the foreign-born population - Burma (%)
Place of birth for the foreign-born population - Cambodia (%)
Place of birth for the foreign-born population - Indonesia (%)
Place of birth for the foreign-born population - Laos (%)
Place of birth for the foreign-born population - Malaysia (%)
Place of birth for the foreign-born population - Philippines (%)
Place of birth for the foreign-born population - Singapore (%)
Place of birth for the foreign-born population - Thailand (%)
Place of birth for the foreign-born population - Vietnam (%)
Place of birth for the foreign-born population - Other South Eastern Asia (%)
Place of birth for the foreign-born population - Armenia (%)
Place of birth for the foreign-born population - Iraq (%)
Place of birth for the foreign-born population - Israel (%)
Place of birth for the foreign-born population - Jordan (%)
Place of birth for the foreign-born population - Kuwait (%)
Place of birth for the foreign-born population - Lebanon (%)
Place of birth for the foreign-born population - Saudi Arabia (%)
Place of birth for the foreign-born population - Syria (%)
Place of birth for the foreign-born population - Turkey (%)
Place of birth for the foreign-born population - Yemen (%)
Place of birth for the foreign-born population - Other Western Asia (%)
Place of birth for the foreign-born population - Eritrea (%)
Place of birth for the foreign-born population - Ethiopia (%)
Place of birth for the foreign-born population - Kenya (%)
Place of birth for the foreign-born population - Somalia (%)
Place of birth for the foreign-born population - Uganda (%)
Place of birth for the foreign-born population - Zimbabwe (%)
Place of birth for the foreign-born population - Other Eastern Africa (%)
Place of birth for the foreign-born population - Cameroon (%)
Place of birth for the foreign-born population - Congo (%)
Place of birth for the foreign-born population - Democratic Republic of Congo (Zaire) (%)
Place of birth for the foreign-born population - Other Middle Africa (%)
Place of birth for the foreign-born population - Egypt (%)
Place of birth for the foreign-born population - Morocco (%)
Place of birth for the foreign-born population - Sudan (%)
Place of birth for the foreign-born population - Other Northern Africa (%)
Place of birth for the foreign-born population - South Africa (%)
Place of birth for the foreign-born population - Other Southern Africa (%)
Place of birth for the foreign-born population - Cabo Verde (%)
Place of birth for the foreign-born population - Ghana (%)
Place of birth for the foreign-born population - Liberia (%)
Place of birth for the foreign-born population - Nigeria (%)
Place of birth for the foreign-born population - Senegal (%)
Place of birth for the foreign-born population - Sierra Leone (%)
Place of birth for the foreign-born population - Other Western Africa (%)
Place of birth for the foreign-born population - Australia (%)
Place of birth for the foreign-born population - New Zealand (%)
Place of birth for the foreign-born population - Fiji (%)
Place of birth for the foreign-born population - Micronesia (%)
Place of birth for the foreign-born population - Bahamas (%)
Place of birth for the foreign-born population - Barbados (%)
Place of birth for the foreign-born population - Cuba (%)
Place of birth for the foreign-born population - Dominica (%)
Place of birth for the foreign-born population - Dominican Republic (%)
Place of birth for the foreign-born population - Grenada (%)
Place of birth for the foreign-born population - Haiti (%)
Place of birth for the foreign-born population - Jamaica (%)
Place of birth for the foreign-born population - St. Vincent and the Grenadines (%)
Place of birth for the foreign-born population - Trinidad and Tobago (%)
Place of birth for the foreign-born population - West Indies (%)
Place of birth for the foreign-born population - Other Caribbean (%)
Place of birth for the foreign-born population - Belize (%)
Place of birth for the foreign-born population - Costa Rica (%)
Place of birth for the foreign-born population - El Salvador (%)
Place of birth for the foreign-born population - Guatemala (%)
Place of birth for the foreign-born population - Honduras (%)
Place of birth for the foreign-born population - Mexico (%)
Place of birth for the foreign-born population - Nicaragua (%)
Place of birth for the foreign-born population - Panama (%)
Place of birth for the foreign-born population - Other Central America (%)
Place of birth for the foreign-born population - Argentina (%)
Place of birth for the foreign-born population - Bolivia (%)
Place of birth for the foreign-born population - Brazil (%)
Place of birth for the foreign-born population - Chile (%)
Place of birth for the foreign-born population - Colombia (%)
Place of birth for the foreign-born population - Ecuador (%)
Place of birth for the foreign-born population - Guyana (%)
Place of birth for the foreign-born population - Peru (%)
Place of birth for the foreign-born population - Uruguay (%)
Place of birth for the foreign-born population - Venezuela (%)
Place of birth for the foreign-born population - Other South America (%)
Place of birth for the foreign-born population - Canada (%)
Place of birth for the foreign-born population - Other Northern America (%)
Place of birth for the foreign-born population - Other (%)
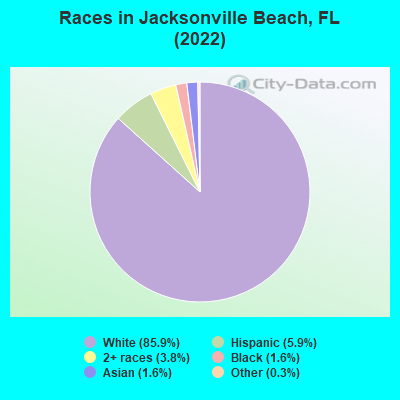
According to 2022 data, the most numerous races in Jacksonville Beach, FL are White alone (20,675 residents), Hispanic (1,412 residents), and Black alone (397 residents). 91.8% of Jacksonville Beach residents speak English at home. 5.8% of Jacksonville Beach, FL residents are foreign-born (2.0% born in Latin America, 1.6% born in Asia, 1.5% born in Europe), which is 259.1% less than the foreign-born rate of 21.0% across the entire state of Florida.
Race distribution in Jacksonville Beach
2000 2022
10,458,509 65.4% White alone 2,682,715 16.8% Hispanic 2,264,268 14.2% Black alone 261,693 1.6% Asian alone 236,954 1.5% Two or more races 42,358 0.3% American Indian alone 28,994 0.2% Other race alone 6,887 0.04% Native Hawaiian and Other
11,309,403 50.8% White alone 6,025,039 27.1% Hispanic 3,241,015 14.6% Black alone 861,630 3.9% Two or more races 623,692 2.8% Asian alone 152,054 0.7% Other race alone 22,504 0.1% American Indian alone 9,486 0.04% Native Hawaiian and Other
Income and house value in Jacksonville Beach Median household income in 2022 $117,288 White non-Hispanic householders$75,339 Black householders$87,760 Two or more races householders$103,454 Hispanic or Latino race householdersMedian 2022 house value $576,923 White Non-Hispanic householders$218,909 Black or African American householders $419,986 Asian householders$423,552 Native Hawaiian and other Pacific Islander householders$732,523 Some other race householders$501,575 Two or more races householders$703,097 Hispanic or Latino householders
Median age by race in Jacksonville Beach
44.1 Median age for White residents41.8 47.0 61.1 Median age for Black or African American residents65.3 57.3 -483,091,787.0 Median age for American Indian / Alaska Native residents-546,423,134.9 -608,150,469.6 62.9 Median age for Asian residents45.8 63.7 -800,347,221.4 Median age for Native Hawaiian / Pacific Islander residents-1,214,756,257.0 -443,298,968.6 41.0 Median age for Other race residents41.2 46.0 33.7 Median age for Two or more races residents20.7 36.5 43.8 Median age for White alone residents42.0 46.8 39.9 Median age for Hispanic or Latino residents40.2 39.2
Owner/renter occupied households by race in Jacksonville Beach
House owners and renters - White residents 6,835 69.1% Owner occupied3,059 30.9% Renter occupiedHouse owners and renters - Black or African American residents 110 57.4% Owner occupied82 42.6% Renter occupiedHouse owners and renters - Asian residents 117 52.8% Owner occupied104 47.2% Renter occupiedHouse owners and renters - Native Hawaiian / Pacific Islander residents 11 100.0% Renter occupiedHouse owners and renters - Other race residents 50 42.9% Owner occupied67 57.1% Renter occupiedHouse owners and renters - Two or more races residents 383 52.3% Owner occupied349 47.7% Renter occupiedHouse owners and renters - White alone residents 6,853 69.2% Owner occupied3,049 30.8% Renter occupiedHouse owners and renters - Hispanic or Latino residents 264 44.6% Owner occupied328 55.4% Renter occupied
Language usage in Jacksonville Beach
English speakers - Total 91.8% of residents of Jacksonville Beach speak English at home.
3.1% of residents speak Spanish at home 493 69.3% Speak English very well218 30.7% Speak English less than very well4.3% of residents speak other language at home 858 86.8% Speak English very well131 13.2% Speak English less than very well
English speakers - Born in the United States 96.7% of residents of Jacksonville Beach speak English at home.
1.3% of residents speak Spanish at home 88 55.0% Speak English very well72 45.0% Speak English less than very well1.8% of residents speak other language at home 218 100.0% Speak English very well
English speakers - Native, born elsewhere 80.9% of residents of Jacksonville Beach speak English at home.
16.8% of residents speak Spanish at home 79 83.2% Speak English very well16 16.8% Speak English less than very well
English speakers - Foreign-born 31.4% of residents of Jacksonville Beach speak English at home.
21.1% of residents speak Spanish at home 229 76.1% Speak English very well72 23.9% Speak English less than very well46.0% of residents speak other language at home 524 80.0% Speak English very well131 20.0% Speak English less than very well
White (Caucasian) - Speak only English Native:
99.4% (19,565)Foreign-born:
37.8% (240)
White (Caucasian) - Speak another language Native:
1.5% (298)Foreign-born:
64.3% (409)
Black or African American - Speak only English Native:
94.9% (326)Foreign-born:
86.4% (56)
Asian - Speak only English Native:
100.0% (139)Foreign-born:
45.3% (117)
Other race - Speak another language Native:
28.0% (27)Foreign-born:
99.0% (105)
Two or more races - Speak only English Native:
76.5% (934)Foreign-born:
7.4% (13)
Two or more races - Speak another language Native:
23.0% (281)Foreign-born:
92.9% (161)
White alone - Speak only English Native:
98.3% (19,196)Foreign-born:
39.4% (230)
White alone - Speak another language Native:
1.6% (307)Foreign-born:
61.7% (360)
Hispanic or Latino - Speak only English Native:
69.5% (666)Foreign-born:
8.5% (29)
Hispanic or Latino - Speak another language Native:
31.7% (304)Foreign-born:
90.6% (307)
Foreign-born residents in Jacksonville Beach 1,408 residents are foreign born (2.0% Latin America , 1.6% Asia , 1.5% Europe ).
This city:
5.8%Florida:
21.1%
Marital status for residents in Jacksonville Beach Marital status - White (Caucasian) population 15 years and over
Males 37.4% Never married48.6% Now married0.9% Separated2.4% Widowed10.7% DivorcedFemales 28.1% Never married46.7% Now married0.3% Separated8.1% Widowed16.7% DivorcedWomen who gave birth in the past 12 months Now married:
69.7% (142)Unmarried:
30.3% (62)
Women who did not give birth in the past 12 months Now married:
36.7% (1,534)Unmarried:
63.3% (2,643)
Marital status - Black or African American population 15 years and over
Males 18.7% Never married50.3% Now married12.3% Separated4.3% Widowed14.4% DivorcedFemales 47.9% Never married31.0% Now married0.0% Separated10.3% Widowed10.8% DivorcedWomen who did not give birth in the past 12 months Now married:
0.0% (0)Unmarried:
100.0% (100)
Marital status - Asian population 15 years and over
Males 41.4% Never married58.6% Now married0.0% Separated0.0% Widowed0.0% DivorcedFemales 39.2% Never married25.1% Now married0.0% Separated9.0% Widowed26.6% DivorcedWomen who did not give birth in the past 12 months Now married:
0.0% (0)Unmarried:
100.0% (82)
Marital status - Native Hawaiian / Pacific Islander population 15 years and over
Males 100.0% Never married0.0% Now married0.0% Separated0.0% Widowed0.0% DivorcedFemales 100.0% Never married0.0% Now married0.0% Separated0.0% Widowed0.0% DivorcedWomen who did not give birth in the past 12 months Now married:
0.0% (0)Unmarried:
100.0% (7)
Marital status - Other race population 15 years and over
Males 0.0% Never married72.2% Now married0.0% Separated27.8% Widowed0.0% DivorcedFemales 28.2% Never married52.6% Now married0.0% Separated0.0% Widowed19.2% DivorcedWomen who did not give birth in the past 12 months Now married:
51.1% (29)Unmarried:
48.9% (28)
Marital status - Two or more races population 15 years and over
Males 49.4% Never married49.7% Now married0.0% Separated0.0% Widowed0.9% DivorcedFemales 33.4% Never married37.3% Now married6.9% Separated11.0% Widowed11.4% DivorcedWomen who gave birth in the past 12 months Now married:
65.9% (37)Unmarried:
34.1% (19)
Women who did not give birth in the past 12 months Now married:
40.8% (207)Unmarried:
59.2% (300)
Marital status - White alone, not Hispanic / Latino population 15 years and over
Males 37.2% Never married48.8% Now married0.9% Separated2.5% Widowed10.6% DivorcedFemales 28.2% Never married46.0% Now married0.3% Separated8.2% Widowed17.3% DivorcedWomen who gave birth in the past 12 months Now married:
88.4% (129)Unmarried:
11.6% (17)
Women who did not give birth in the past 12 months Now married:
35.8% (1,512)Unmarried:
64.2% (2,711)
Marital status - Hispanic or Latino population 15 years and over
Males 35.0% Never married56.1% Now married0.0% Separated0.0% Widowed8.9% DivorcedFemales 22.4% Never married66.9% Now married0.0% Separated2.5% Widowed8.3% DivorcedWomen who gave birth in the past 12 months Now married:
48.9% (49)Unmarried:
51.1% (51)
Women who did not give birth in the past 12 months Now married:
59.6% (138)Unmarried:
40.4% (93)
Ancestries in Jacksonville Beach
2,281 20.2% American1,754 15.5% English1,388 12.3% Irish1,002 8.9% German932 8.3% European327 2.9% Italian210 1.9% Scottish163 1.4% Scotch-Irish149 1.3% Polish137 1.2% Portuguese120 1.1% Russian94 0.8% Eastern European83 0.7% British83 0.7% French63 0.6% Czech59 0.5% Greek57 0.5% Swiss56 0.5% Serbian54 0.5% Dutch42 0.4% Norwegian38 0.3% Jamaican36 0.3% Lebanese32 0.3% Swedish31 0.3% Hungarian27 0.2% Basque26 0.2% Iranian25 0.2% South African25 0.2% Lithuanian24 0.2% Romanian18 0.2% Canadian18 0.2% Yugoslavian16 0.1% Finnish16 0.1% Welsh14 0.1% Northern European12 0.1% Slovene11 0.10% Austrian11 0.10% Trinidadian and Tobagonian8 0.07% Slovak
Geographical mobility in Jacksonville Beach Same house 1 year ago 17,554 85.1% White (Caucasian)393 98.1% Black or African American55 100.0% American Indian / Alaska Native205 52.6% Asian10 54.8% Native Hawaiian / Pacific Islander204 100.0% Other race1,366 88.3% Two or more races17,622 85.7% White alone, not Hispanic / Latino1,060 76.5% Hispanic or LatinoMoved within same county 1,561 7.6% White / Caucasian11 2.7% Black or African American84 21.6% Asian95 6.1% Two or more races1,505 7.3% White alone, not Hispanic / Latino150 10.8% Hispanic or LatinoMoved within same state 613 3.0% White / Caucasian3 0.7% Black or African American10 56.7% Native Hawaiian / Pacific Islander642 3.1% White alone, not Hispanic / Latino40 2.9% Hispanic or LatinoMoved from different state 767 3.7% White / Caucasian1 0.2% Black or African American61 15.6% Asian62 4.0% Two or more races738 3.6% White alone, not Hispanic / Latino49 3.5% Hispanic or LatinoMoved from abroad 81 0.4% White12 3.1% Asian17 0.1% White alone, not Hispanic / Latino47 3.4% Hispanic or Latino
Children Nativity (place of birth) in Jacksonville Beach
Children under 6 years - Living with two parents Both parents native 778 100.0% NativeOne native, one foreign-born parent 46 100.0% NativeChildren under 6 years - Living with one parent Native parent 128 100.0% NativeChildren 6 to 17 years - Living with two parents Both parents native 1,976 100.0% NativeOne native, one foreign-born parent 79 100.0% NativeChildren 6 to 17 years - Living with one parent Native parent 998 100.0% NativeForeign-born parent 53 64.4% Native29 35.6% Foreign-born
Grandparents responsible for own grandchildren in Jacksonville Beach
Grandparents (30 to 59 years) White / Caucasian 5 100.0% Not responsible for grandchildrenWhite alone, not Hispanic / Latino 5 100.0% Not responsible for grandchildren
Grandparents (60 years and over) White / Caucasian 31 100.0% Not responsible for grandchildrenWhite alone, not Hispanic / Latino 32 100.0% Not responsible for grandchildren