Races in Jackson, Tennessee (TN) Detailed Stats
Data:
Races - White alone (%)
Races - White alone (% change since 2000)
Races - Black alone (%)
Races - Black alone (% change since 2000)
Races - American Indian alone (%)
Races - American Indian alone (% change since 2000)
Races - Asian alone (%)
Races - Asian alone (% change since 2000)
Races - Hispanic (%)
Races - Hispanic (% change since 2000)
Races - Native Hawaiian and Other Pacific Islander alone (%)
Races - Native Hawaiian and Other Pacific Islander alone (% change since 2000)
Races - Two or more races(%)
Races - Two or more races(% change since 2000)
Races - Other race alone (%)
Races - Other race alone (% change since 2000)
Racial diversity
Place of birth - Born in state of residence (%)
Place of birth - Born in state of residence (%) - White
Place of birth - Born in state of residence (%) - Black or African American
Place of birth - Born in state of residence (%) - Asian
Place of birth - Born in state of residence (%) - Hispanic or Latino
Place of birth - Born in state of residence (%) - American Indian and Alaska Native
Place of birth - Born in state of residence (%) - Multirace
Place of birth - Born in state of residence (%) - Other Race
Place of birth - Born in other state (%)
Place of birth - Born in other state (%) - White
Place of birth - Born in other state (%) - Black or African American
Place of birth - Born in other state (%) - Asian
Place of birth - Born in other state (%) - Hispanic or Latino
Place of birth - Born in other state (%) - American Indian and Alaska Native
Place of birth - Born in other state (%) - Multirace
Place of birth - Born in other state (%) - Other Race
Place of birth - Native, outside of US (%)
Place of birth - Native, outside of US (%) - White
Place of birth - Native, outside of US (%) - Black or African American
Place of birth - Native, outside of US (%) - Asian
Place of birth - Native, outside of US (%) - Hispanic or Latino
Place of birth - Native, outside of US (%) - American Indian and Alaska Native
Place of birth - Native, outside of US (%) - Multirace
Place of birth - Native, outside of US (%) - Other Race
Place of birth - Foreign born (%)
Place of birth - Foreign born (%) - White
Place of birth - Foreign born (%) - Black or African American
Place of birth - Foreign born (%) - Asian
Place of birth - Foreign born (%) - Hispanic or Latino
Place of birth - Foreign born (%) - American Indian and Alaska Native
Place of birth - Foreign born (%) - Multirace
Place of birth - Foreign born (%) - Other Race
Residents speaking English at home (%)
Residents speaking English at home - Born in the United States (%)
Residents speaking English at home - Native, born elsewhere (%)
Residents speaking English at home - Foreign born (%)
Residents speaking Spanish at home (%)
Residents speaking Spanish at home - Born in the United States (%)
Residents speaking Spanish at home - Native, born elsewhere (%)
Residents speaking Spanish at home - Foreign born (%)
Residents speaking other language at home (%)
Residents speaking other language at home - Born in the United States (%)
Residents speaking other language at home - Native, born elsewhere (%)
Residents speaking other language at home - Foreign born (%)
Marital status - Never married (%)
Marital status - Now married (%)
Marital status - Separated (%)
Marital status - Widowed (%)
Marital status - Divorced (%)
Ancestries Reported - Arab (%)
Ancestries Reported - Czech (%)
Ancestries Reported - Danish (%)
Ancestries Reported - Dutch (%)
Ancestries Reported - English (%)
Ancestries Reported - French (%)
Ancestries Reported - French Canadian (%)
Ancestries Reported - German (%)
Ancestries Reported - Greek (%)
Ancestries Reported - Hungarian (%)
Ancestries Reported - Irish (%)
Ancestries Reported - Italian (%)
Ancestries Reported - Lithuanian (%)
Ancestries Reported - Norwegian (%)
Ancestries Reported - Polish (%)
Ancestries Reported - Portuguese (%)
Ancestries Reported - Russian (%)
Ancestries Reported - Scotch-Irish (%)
Ancestries Reported - Scottish (%)
Ancestries Reported - Slovak (%)
Ancestries Reported - Subsaharan African (%)
Ancestries Reported - Swedish (%)
Ancestries Reported - Swiss (%)
Ancestries Reported - Ukrainian (%)
Ancestries Reported - United States (%)
Ancestries Reported - Welsh (%)
Ancestries Reported - West Indian (%)
Ancestries Reported - Other (%)
Geographical mobility - Same house 1 year ago (%)
Geographical mobility - Same house 1 year ago (%) - White
Geographical mobility - Same house 1 year ago (%) - Black or African American
Geographical mobility - Same house 1 year ago (%) - Asian
Geographical mobility - Same house 1 year ago (%) - Hispanic or Latino
Geographical mobility - Same house 1 year ago (%) - American Indian and Alaska Native
Geographical mobility - Same house 1 year ago (%) - Multirace
Geographical mobility - Same house 1 year ago (%) - Other Race
Geographical mobility - Moved within same county (%)
Geographical mobility - Moved within same county (%) - White
Geographical mobility - Moved within same county (%) - Black or African American
Geographical mobility - Moved within same county (%) - Asian
Geographical mobility - Moved within same county (%) - Hispanic or Latino
Geographical mobility - Moved within same county (%) - American Indian and Alaska Native
Geographical mobility - Moved within same county (%) - Multirace
Geographical mobility - Moved within same county (%) - Other Race
Geographical mobility - Moved from different county within same state (%)
Geographical mobility - Moved from different county within same state (%) - White
Geographical mobility - Moved from different county within same state (%) - Black or African American
Geographical mobility - Moved from different county within same state (%) - Asian
Geographical mobility - Moved from different county within same state (%) - Hispanic or Latino
Geographical mobility - Moved from different county within same state (%) - American Indian and Alaska Native
Geographical mobility - Moved from different county within same state (%) - Multirace
Geographical mobility - Moved from different county within same state (%) - Other Race
Geographical mobility - Moved from different state (%)
Geographical mobility - Moved from different state (%) - White
Geographical mobility - Moved from different state (%) - Black or African American
Geographical mobility - Moved from different state (%) - Asian
Geographical mobility - Moved from different state (%) - Hispanic or Latino
Geographical mobility - Moved from different state (%) - American Indian and Alaska Native
Geographical mobility - Moved from different state (%) - Multirace
Geographical mobility - Moved from different state (%) - Other Race
Geographical mobility - Moved from abroad (%)
Geographical mobility - Moved from abroad (%) - White
Geographical mobility - Moved from abroad (%) - Black or African American
Geographical mobility - Moved from abroad (%) - Asian
Geographical mobility - Moved from abroad (%) - Hispanic or Latino
Geographical mobility - Moved from abroad (%) - American Indian and Alaska Native
Geographical mobility - Moved from abroad (%) - Multirace
Geographical mobility - Moved from abroad (%) - Other Race
Place of birth for the foreign-born population - Ireland (%)
Place of birth for the foreign-born population - Denmark (%)
Place of birth for the foreign-born population - Norway (%)
Place of birth for the foreign-born population - Sweden (%)
Place of birth for the foreign-born population - United Kingdom (%)
Place of birth for the foreign-born population - England (%)
Place of birth for the foreign-born population - Scotland (%)
Place of birth for the foreign-born population - Other Northern Europe (%)
Place of birth for the foreign-born population - Austria (%)
Place of birth for the foreign-born population - Belgium (%)
Place of birth for the foreign-born population - France (%)
Place of birth for the foreign-born population - Germany (%)
Place of birth for the foreign-born population - Netherlands (%)
Place of birth for the foreign-born population - Switzerland (%)
Place of birth for the foreign-born population - Other Western Europe (%)
Place of birth for the foreign-born population - Greece (%)
Place of birth for the foreign-born population - Italy (%)
Place of birth for the foreign-born population - Portugal (%)
Place of birth for the foreign-born population - Spain (%)
Place of birth for the foreign-born population - Other Southern Europe (%)
Place of birth for the foreign-born population - Albania (%)
Place of birth for the foreign-born population - Belarus (%)
Place of birth for the foreign-born population - Bosnia and Herzegovina (%)
Place of birth for the foreign-born population - Bulgaria (%)
Place of birth for the foreign-born population - Croatia (%)
Place of birth for the foreign-born population - Czechoslovakia (%)
Place of birth for the foreign-born population - Hungary (%)
Place of birth for the foreign-born population - Latvia (%)
Place of birth for the foreign-born population - Lithuania (%)
Place of birth for the foreign-born population - North Macedonia (Macedonia) (%)
Place of birth for the foreign-born population - Moldova (%)
Place of birth for the foreign-born population - Poland (%)
Place of birth for the foreign-born population - Romania (%)
Place of birth for the foreign-born population - Russia (%)
Place of birth for the foreign-born population - Serbia (%)
Place of birth for the foreign-born population - Ukraine (%)
Place of birth for the foreign-born population - Other Eastern Europe (%)
Place of birth for the foreign-born population - China (%)
Place of birth for the foreign-born population - Hong Kong (%)
Place of birth for the foreign-born population - Taiwan (%)
Place of birth for the foreign-born population - Japan (%)
Place of birth for the foreign-born population - Korea (%)
Place of birth for the foreign-born population - Other Eastern Asia (%)
Place of birth for the foreign-born population - Afghanistan (%)
Place of birth for the foreign-born population - Bangladesh (%)
Place of birth for the foreign-born population - India (%)
Place of birth for the foreign-born population - Iran (%)
Place of birth for the foreign-born population - Kazakhstan (%)
Place of birth for the foreign-born population - Nepal (%)
Place of birth for the foreign-born population - Pakistan (%)
Place of birth for the foreign-born population - Sri Lanka (%)
Place of birth for the foreign-born population - Uzbekistan (%)
Place of birth for the foreign-born population - Other South Central Asia (%)
Place of birth for the foreign-born population - Burma (%)
Place of birth for the foreign-born population - Cambodia (%)
Place of birth for the foreign-born population - Indonesia (%)
Place of birth for the foreign-born population - Laos (%)
Place of birth for the foreign-born population - Malaysia (%)
Place of birth for the foreign-born population - Philippines (%)
Place of birth for the foreign-born population - Singapore (%)
Place of birth for the foreign-born population - Thailand (%)
Place of birth for the foreign-born population - Vietnam (%)
Place of birth for the foreign-born population - Other South Eastern Asia (%)
Place of birth for the foreign-born population - Armenia (%)
Place of birth for the foreign-born population - Iraq (%)
Place of birth for the foreign-born population - Israel (%)
Place of birth for the foreign-born population - Jordan (%)
Place of birth for the foreign-born population - Kuwait (%)
Place of birth for the foreign-born population - Lebanon (%)
Place of birth for the foreign-born population - Saudi Arabia (%)
Place of birth for the foreign-born population - Syria (%)
Place of birth for the foreign-born population - Turkey (%)
Place of birth for the foreign-born population - Yemen (%)
Place of birth for the foreign-born population - Other Western Asia (%)
Place of birth for the foreign-born population - Eritrea (%)
Place of birth for the foreign-born population - Ethiopia (%)
Place of birth for the foreign-born population - Kenya (%)
Place of birth for the foreign-born population - Somalia (%)
Place of birth for the foreign-born population - Uganda (%)
Place of birth for the foreign-born population - Zimbabwe (%)
Place of birth for the foreign-born population - Other Eastern Africa (%)
Place of birth for the foreign-born population - Cameroon (%)
Place of birth for the foreign-born population - Congo (%)
Place of birth for the foreign-born population - Democratic Republic of Congo (Zaire) (%)
Place of birth for the foreign-born population - Other Middle Africa (%)
Place of birth for the foreign-born population - Egypt (%)
Place of birth for the foreign-born population - Morocco (%)
Place of birth for the foreign-born population - Sudan (%)
Place of birth for the foreign-born population - Other Northern Africa (%)
Place of birth for the foreign-born population - South Africa (%)
Place of birth for the foreign-born population - Other Southern Africa (%)
Place of birth for the foreign-born population - Cabo Verde (%)
Place of birth for the foreign-born population - Ghana (%)
Place of birth for the foreign-born population - Liberia (%)
Place of birth for the foreign-born population - Nigeria (%)
Place of birth for the foreign-born population - Senegal (%)
Place of birth for the foreign-born population - Sierra Leone (%)
Place of birth for the foreign-born population - Other Western Africa (%)
Place of birth for the foreign-born population - Australia (%)
Place of birth for the foreign-born population - New Zealand (%)
Place of birth for the foreign-born population - Fiji (%)
Place of birth for the foreign-born population - Micronesia (%)
Place of birth for the foreign-born population - Bahamas (%)
Place of birth for the foreign-born population - Barbados (%)
Place of birth for the foreign-born population - Cuba (%)
Place of birth for the foreign-born population - Dominica (%)
Place of birth for the foreign-born population - Dominican Republic (%)
Place of birth for the foreign-born population - Grenada (%)
Place of birth for the foreign-born population - Haiti (%)
Place of birth for the foreign-born population - Jamaica (%)
Place of birth for the foreign-born population - St. Vincent and the Grenadines (%)
Place of birth for the foreign-born population - Trinidad and Tobago (%)
Place of birth for the foreign-born population - West Indies (%)
Place of birth for the foreign-born population - Other Caribbean (%)
Place of birth for the foreign-born population - Belize (%)
Place of birth for the foreign-born population - Costa Rica (%)
Place of birth for the foreign-born population - El Salvador (%)
Place of birth for the foreign-born population - Guatemala (%)
Place of birth for the foreign-born population - Honduras (%)
Place of birth for the foreign-born population - Mexico (%)
Place of birth for the foreign-born population - Nicaragua (%)
Place of birth for the foreign-born population - Panama (%)
Place of birth for the foreign-born population - Other Central America (%)
Place of birth for the foreign-born population - Argentina (%)
Place of birth for the foreign-born population - Bolivia (%)
Place of birth for the foreign-born population - Brazil (%)
Place of birth for the foreign-born population - Chile (%)
Place of birth for the foreign-born population - Colombia (%)
Place of birth for the foreign-born population - Ecuador (%)
Place of birth for the foreign-born population - Guyana (%)
Place of birth for the foreign-born population - Peru (%)
Place of birth for the foreign-born population - Uruguay (%)
Place of birth for the foreign-born population - Venezuela (%)
Place of birth for the foreign-born population - Other South America (%)
Place of birth for the foreign-born population - Canada (%)
Place of birth for the foreign-born population - Other Northern America (%)
Place of birth for the foreign-born population - Other (%)
Latest news about races in Jackson, TN collected exclusively by city-data.com from local newspapers, TV, and radio stations
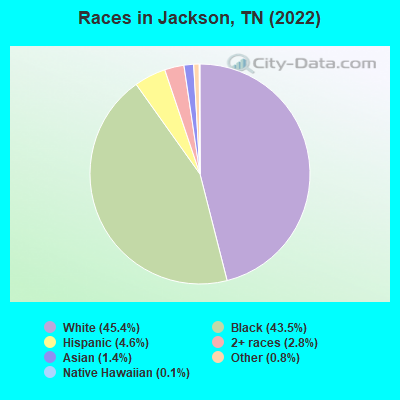
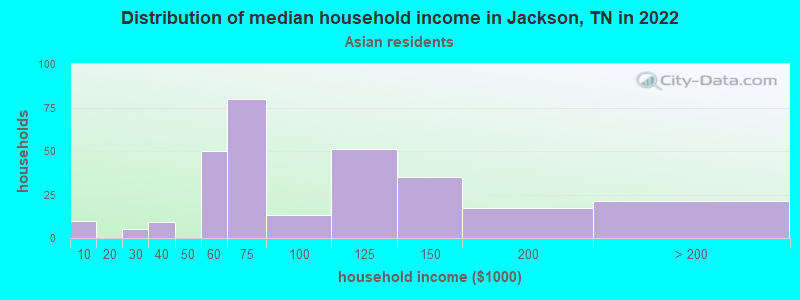
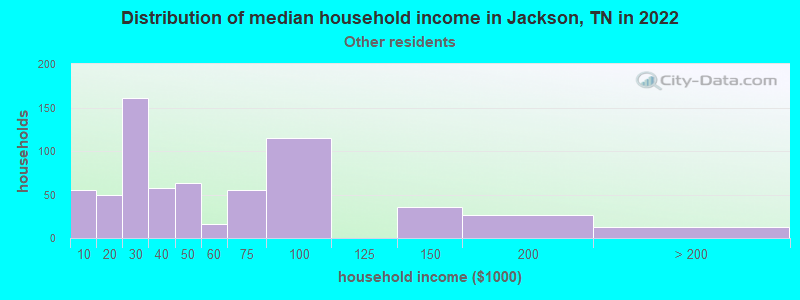
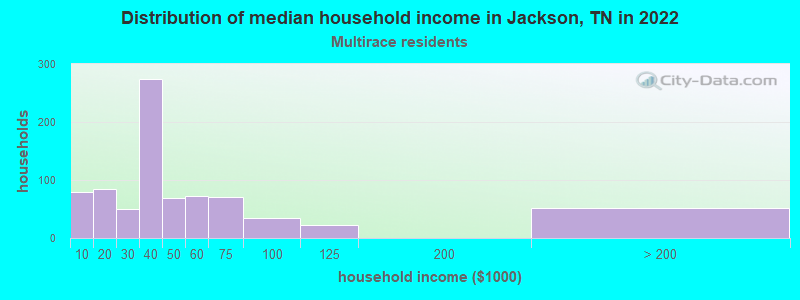
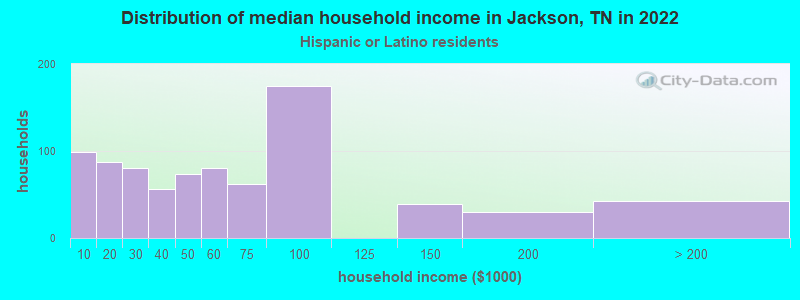
According to 2022 data, the most numerous races in Jackson, TN are White alone (31,403 residents), Black alone (30,129 residents), and Hispanic (3,189 residents). 94.7% of Jackson residents speak English at home. 3.8% of Jackson, TN residents are foreign-born (1.9% born in Latin America, 1.0% born in Asia, 0.5% born in Europe), which is 30.1% less than the foreign-born rate of 5.0% across the entire state of Tennessee.
Race distribution in Jackson
2000 2022
4,505,930 79.2% White alone 928,204 16.3% Black alone 123,838 2.2% Hispanic 54,824 1.0% Two or more races 56,077 1.0% Asian alone 13,820 0.2% American Indian alone 4,780 0.08% Other race alone 1,810 0.03% Native Hawaiian and Other
5,070,026 71.9% White alone 1,089,738 15.5% Black alone 442,629 6.3% Hispanic 279,381 4.0% Two or more races 131,817 1.9% Asian alone 26,972 0.4% Other race alone 6,387 0.09% American Indian alone 4,389 0.06% Native Hawaiian and Other
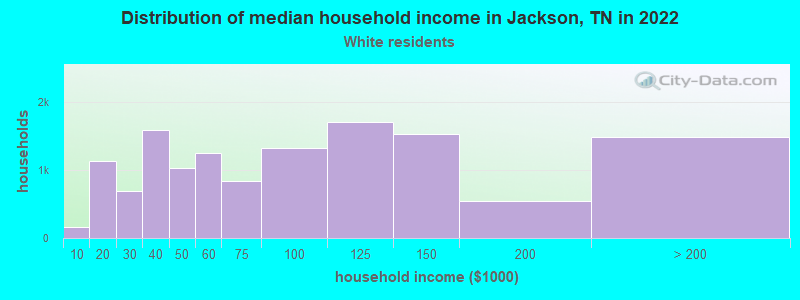
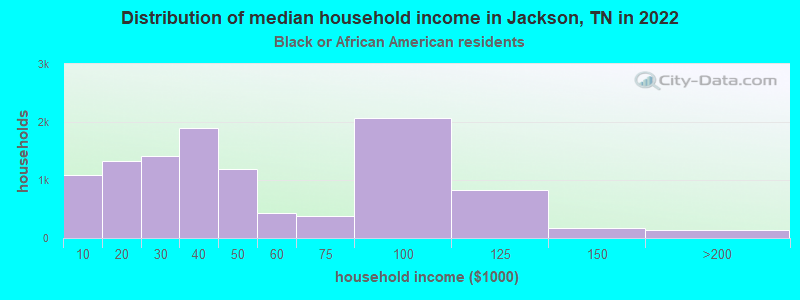
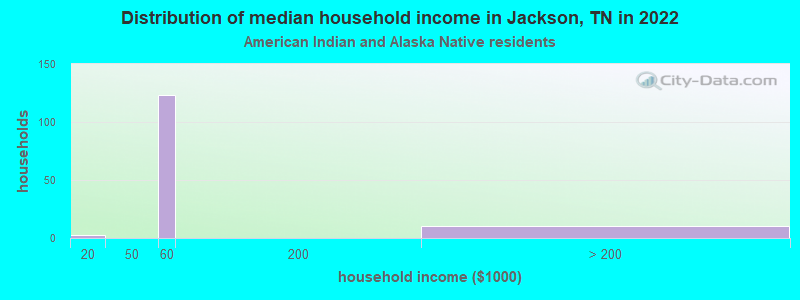
Income and house value in Jackson Median household income in 2022 $74,807 White non-Hispanic householders$37,878 Black householders$79,634 Asian householders$25,336 Some other race householders$42,767 Two or more races householders$45,563 Hispanic or Latino race householdersMedian 2022 house value $248,584 White Non-Hispanic householders$143,173 Black or African American householders$176,590 American Indian or Alaska Native householders $494,995 Asian householders$74,711 Some other race householders$224,133 Two or more races householders$297,214 Hispanic or Latino householders
Median age by race in Jackson
44.8 Median age for White residents42.8 46.6 31.5 Median age for Black or African American residents28.3 37.1 -666,666,666.0 Median age for American Indian / Alaska Native residents-666,666,666.0 -666,666,666.0 20.8 Median age for Asian residents41.8 18.6 -666,666,666.0 Median age for Native Hawaiian / Pacific Islander residents-666,666,666.0 -666,666,666.0 20.9 Median age for Other race residents28.2 20.5 28.7 Median age for Two or more races residents26.3 36.4 45.3 Median age for White alone residents43.7 46.8 21.0 Median age for Hispanic or Latino residents28.9 14.3
Owner/renter occupied households by race in Jackson
House owners and renters - White residents 9,939 74.6% Owner occupied3,386 25.4% Renter occupiedHouse owners and renters - Black or African American residents 3,052 27.9% Owner occupied7,881 72.1% Renter occupiedHouse owners and renters - American Indian / Alaska Native residents 8 11.7% Owner occupied61 88.3% Renter occupiedHouse owners and renters - Asian residents 246 77.3% Owner occupied72 22.7% Renter occupiedHouse owners and renters - Other race residents 1,162 91.1% Owner occupied113 8.9% Renter occupiedHouse owners and renters - Two or more races residents 493 54.7% Owner occupied408 45.3% Renter occupiedHouse owners and renters - White alone residents 9,858 75.2% Owner occupied3,247 24.8% Renter occupiedHouse owners and renters - Hispanic or Latino residents 987 64.5% Owner occupied544 35.5% Renter occupied
Language usage in Jackson
English speakers - Total 94.7% of residents of Jackson speak English at home.
3.5% of residents speak Spanish at home 938 41.2% Speak English very well1,340 58.8% Speak English less than very well1.7% of residents speak other language at home 637 58.2% Speak English very well457 41.8% Speak English less than very well
English speakers - Born in the United States 96.4% of residents of Jackson speak English at home.
2.5% of residents speak Spanish at home 333 74.7% Speak English very well113 25.3% Speak English less than very well0.9% of residents speak other language at home 104 65.8% Speak English very well54 34.2% Speak English less than very well
English speakers - Native, born elsewhere 77.6% of residents of Jackson speak English at home.
9.0% of residents speak Spanish at home 16 38.1% Speak English very well26 61.9% Speak English less than very well12.2% of residents speak other language at home 57 100.0% Speak English very well
English speakers - Foreign-born 22.1% of residents of Jackson speak English at home.
47.9% of residents speak Spanish at home 179 14.5% Speak English very well1,057 85.5% Speak English less than very well30.8% of residents speak other language at home 451 56.7% Speak English very well344 43.3% Speak English less than very well
White (Caucasian) - Speak only English Native:
99.5% (29,346)Foreign-born:
34.0% (147)
White (Caucasian) - Speak another language Native:
0.7% (204)Foreign-born:
65.6% (283)
Black or African American - Speak only English Native:
99.7% (27,567)Foreign-born:
45.1% (102)
Black or African American - Speak another language Native:
0.3% (75)Foreign-born:
55.6% (125)
Asian - Speak only English Native:
95.9% (303)Foreign-born:
43.0% (283)
Asian - Speak another language Native:
1.8% (6)Foreign-born:
56.7% (373)
Other race - Speak only English Native:
29.6% (498)Foreign-born:
3.5% (29)
Other race - Speak another language Native:
70.4% (1,183)Foreign-born:
99.5% (819)
Two or more races - Speak another language Native:
8.1% (188)Foreign-born:
99.8% (172)
White alone - Speak only English Native:
99.2% (29,173)Foreign-born:
40.3% (148)
White alone - Speak another language Native:
0.8% (233)Foreign-born:
59.7% (219)
Hispanic or Latino - Speak another language Native:
69.4% (1,522)Foreign-born:
100.0% (1,202)
Foreign-born residents in Jackson 2,630 residents are foreign born (1.9% Latin America , 1.0% Asia , 0.5% Europe ).
This city:
3.8%Tennessee:
5.4%
Marital status for residents in Jackson Marital status - White (Caucasian) population 15 years and over
Males 29.3% Never married57.0% Now married2.7% Separated1.2% Widowed9.7% DivorcedFemales 20.2% Never married48.6% Now married1.3% Separated11.2% Widowed18.8% DivorcedWomen who gave birth in the past 12 months Now married:
100.0% (342)Unmarried:
0.0% (0)
Women who did not give birth in the past 12 months Now married:
39.1% (2,686)Unmarried:
60.9% (4,180)
Marital status - Black or African American population 15 years and over
Males 52.8% Never married24.6% Now married8.9% Separated4.8% Widowed8.8% DivorcedFemales 62.8% Never married19.5% Now married3.8% Separated6.2% Widowed7.7% DivorcedWomen who gave birth in the past 12 months Now married:
32.1% (164)Unmarried:
67.9% (347)
Women who did not give birth in the past 12 months Now married:
19.3% (1,556)Unmarried:
80.7% (6,510)
Marital status - American Indian / Alaska Native population 15 years and over
Males 81.7% Never married18.3% Now married0.0% Separated0.0% Widowed0.0% DivorcedFemales 100.0% Never married0.0% Now married0.0% Separated0.0% Widowed0.0% DivorcedWomen who did not give birth in the past 12 months Now married:
0.0% (0)Unmarried:
100.0% (13)
Marital status - Asian population 15 years and over
Males 24.8% Never married72.5% Now married2.7% Separated0.0% Widowed0.0% DivorcedFemales 25.4% Never married71.4% Now married0.0% Separated0.0% Widowed3.2% DivorcedWomen who gave birth in the past 12 months Now married:
100.0% (48)Unmarried:
0.0% (0)
Women who did not give birth in the past 12 months Now married:
65.5% (218)Unmarried:
34.5% (115)
Marital status - Other race population 15 years and over
Males 39.5% Never married45.4% Now married2.4% Separated1.8% Widowed10.9% DivorcedFemales 35.7% Never married37.8% Now married0.0% Separated6.5% Widowed20.0% DivorcedWomen who did not give birth in the past 12 months Now married:
41.2% (275)Unmarried:
58.8% (392)
Marital status - Two or more races population 15 years and over
Males 61.0% Never married30.6% Now married1.8% Separated0.1% Widowed6.4% DivorcedFemales 42.5% Never married32.3% Now married3.9% Separated6.5% Widowed14.7% DivorcedWomen who did not give birth in the past 12 months Now married:
37.7% (222)Unmarried:
62.3% (366)
Marital status - White alone, not Hispanic / Latino population 15 years and over
Males 28.7% Never married58.1% Now married2.8% Separated1.2% Widowed9.3% DivorcedFemales 20.0% Never married48.8% Now married0.8% Separated11.3% Widowed19.0% DivorcedWomen who gave birth in the past 12 months Now married:
100.0% (342)Unmarried:
0.0% (0)
Women who did not give birth in the past 12 months Now married:
39.5% (2,686)Unmarried:
60.5% (4,119)
Marital status - Hispanic or Latino population 15 years and over
Males 48.8% Never married40.5% Now married1.7% Separated0.0% Widowed9.1% DivorcedFemales 36.6% Never married47.2% Now married1.3% Separated5.5% Widowed9.3% DivorcedWomen who did not give birth in the past 12 months Now married:
48.6% (367)Unmarried:
51.4% (388)
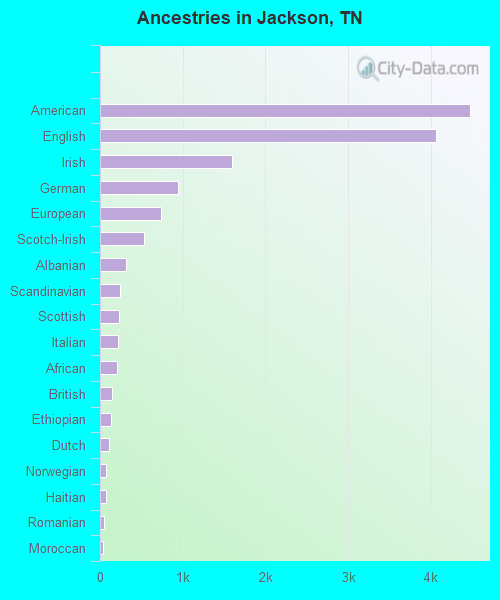
Ancestries in Jackson
4,479 10.0% American4,062 9.1% English1,601 3.6% Irish941 2.1% German743 1.7% European532 1.2% Scotch-Irish309 0.7% Albanian241 0.5% Scandinavian225 0.5% Scottish220 0.5% Italian204 0.5% African140 0.3% British135 0.3% Ethiopian103 0.2% Dutch70 0.2% Norwegian68 0.2% Haitian45 0.1% Romanian42 0.09% Moroccan40 0.09% Somali39 0.09% Israeli38 0.08% French37 0.08% Nigerian36 0.08% French Canadian35 0.08% Eastern European28 0.06% Northern European26 0.06% Swedish25 0.06% Polish25 0.06% Russian25 0.06% Ukrainian24 0.05% Canadian23 0.05% Jamaican21 0.05% Brazilian19 0.04% Hungarian17 0.04% Danish16 0.04% Slavic14 0.03% Welsh13 0.03% Iranian12 0.03% Croatian12 0.03% Greek12 0.03% Belizean9 0.02% Trinidadian and Tobagonian
Geographical mobility in Jackson Same house 1 year ago 27,006 80.4% White (Caucasian)23,559 85.2% Black or African American92 73.8% American Indian / Alaska Native871 87.5% Asian69 100.0% Native Hawaiian / Pacific Islander2,345 88.5% Other race2,294 80.3% Two or more races26,376 80.2% White alone, not Hispanic / Latino2,577 82.6% Hispanic or LatinoMoved within same county 4,016 12.0% White / Caucasian1,422 5.1% Black or African American30 3.0% Asian49 1.8% Other race361 12.6% Two or more races3,937 12.0% White alone, not Hispanic / Latino260 8.3% Hispanic or LatinoMoved within same state 1,088 3.2% White / Caucasian1,637 5.9% Black or African American71 56.5% American Indian / Alaska Native38 3.8% Asian164 5.7% Two or more races1,088 3.3% White alone, not Hispanic / Latino59 1.9% Hispanic or LatinoMoved from different state 1,192 3.5% White / Caucasian1,023 3.7% Black or African American1 0.8% American Indian / Alaska Native37 3.7% Asian69 2.6% Other race38 1.3% Two or more races1,192 3.6% White alone, not Hispanic / Latino55 1.7% Hispanic or LatinoMoved from abroad 302 0.9% White245 9.2% Other race302 0.9% White alone, not Hispanic / Latino165 5.3% Hispanic or Latino
Children Nativity (place of birth) in Jackson
Children under 6 years - Living with two parents Both parents native 2,444 97.8% Native55 2.2% Foreign-bornBoth parents foreign-born 68 100.0% NativeOne native, one foreign-born parent 342 100.0% NativeChildren under 6 years - Living with one parent Native parent 2,294 100.0% Native1 0.0% Foreign-bornForeign-born parent 135 79.3% Native35 20.7% Foreign-bornChildren 6 to 17 years - Living with two parents Both parents native 3,512 96.9% Native113 3.1% Foreign-bornBoth parents foreign-born 140 82.7% Native29 17.3% Foreign-bornOne native, one foreign-born parent 90 100.0% NativeChildren 6 to 17 years - Living with one parent Native parent 5,412 100.0% NativeForeign-born parent 455 55.6% Native363 44.4% Foreign-born
Grandparents responsible for own grandchildren in Jackson
Grandparents (30 to 59 years) White / Caucasian 207 41.3% Responsible for grandchildren294 58.7% Not responsible for grandchildrenBlack or African American 281 66.9% Responsible for grandchildren139 33.1% Not responsible for grandchildrenAsian 21 100.0% Responsible for grandchildrenOther race 39 100.0% Not responsible for grandchildrenWhite alone, not Hispanic / Latino 207 40.7% Responsible for grandchildren301 59.3% Not responsible for grandchildrenHispanic or Latino 35 100.0% Not responsible for grandchildrenGrandparents (60 years and over) White / Caucasian 71 17.6% Responsible for grandchildren331 82.4% Not responsible for grandchildrenBlack or African American 438 69.7% Responsible for grandchildren191 30.3% Not responsible for grandchildrenOther race 34 100.0% Not responsible for grandchildrenWhite alone, not Hispanic / Latino 72 17.7% Responsible for grandchildren333 82.3% Not responsible for grandchildrenHispanic or Latino 54 100.0% Not responsible for grandchildren