Races in Issaquah, Washington (WA) Detailed Stats
Data:
Races - White alone (%)
Races - White alone (% change since 2000)
Races - Black alone (%)
Races - Black alone (% change since 2000)
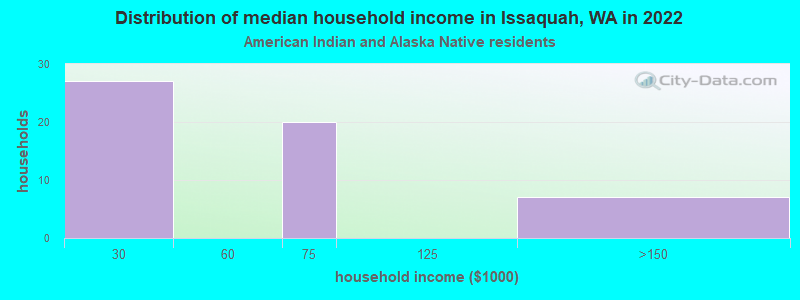
Races - American Indian alone (%)
Races - American Indian alone (% change since 2000)
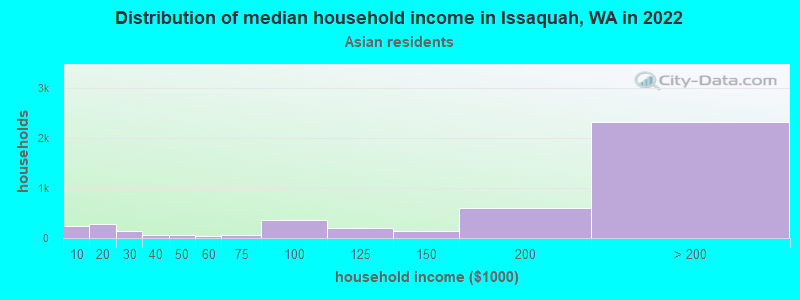
Races - Asian alone (%)
Races - Asian alone (% change since 2000)
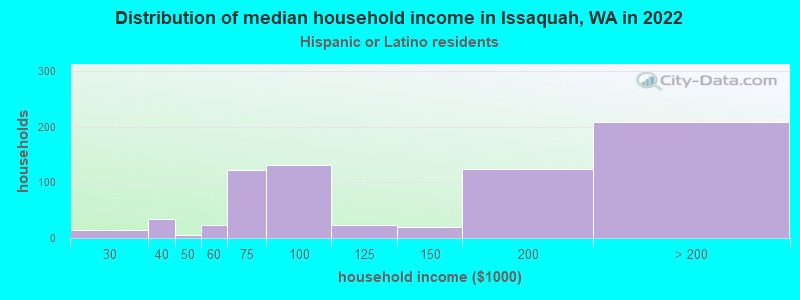
Races - Hispanic (%)
Races - Hispanic (% change since 2000)
Races - Native Hawaiian and Other Pacific Islander alone (%)
Races - Native Hawaiian and Other Pacific Islander alone (% change since 2000)
Races - Two or more races(%)
Races - Two or more races(% change since 2000)
Races - Other race alone (%)
Races - Other race alone (% change since 2000)
Racial diversity
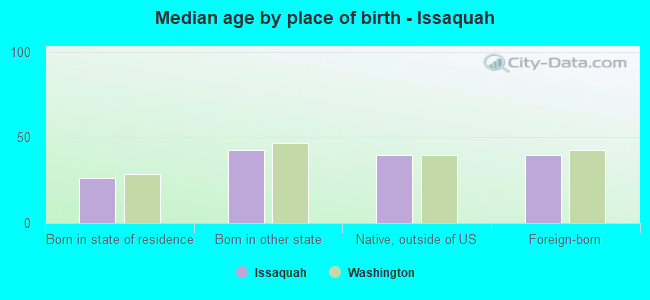
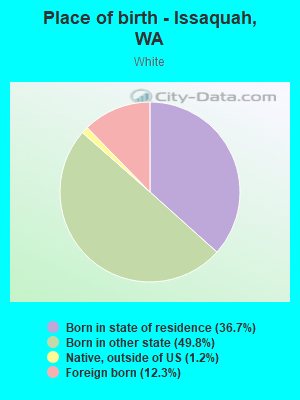
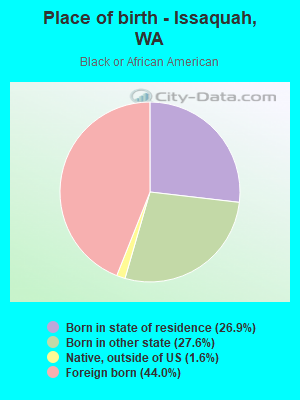
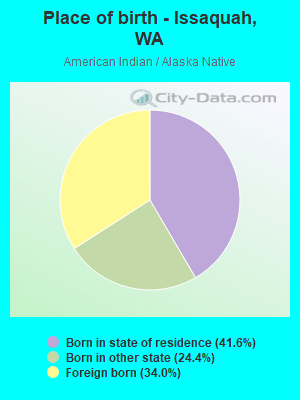
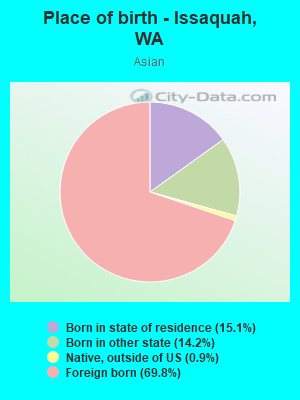
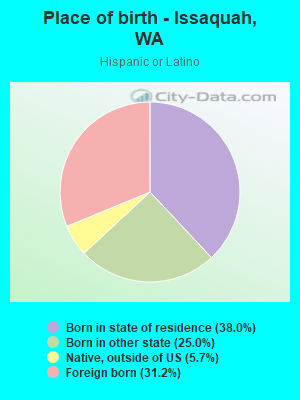
Place of birth - Born in state of residence (%)
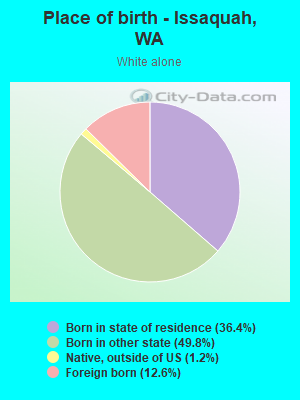
Place of birth - Born in state of residence (%) - White
Place of birth - Born in state of residence (%) - Black or African American
Place of birth - Born in state of residence (%) - Asian
Place of birth - Born in state of residence (%) - Hispanic or Latino
Place of birth - Born in state of residence (%) - American Indian and Alaska Native
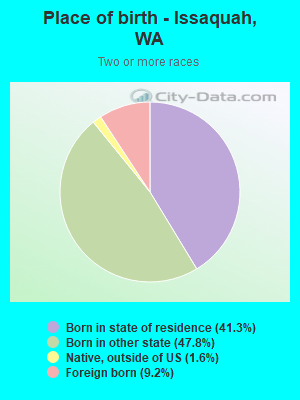
Place of birth - Born in state of residence (%) - Multirace
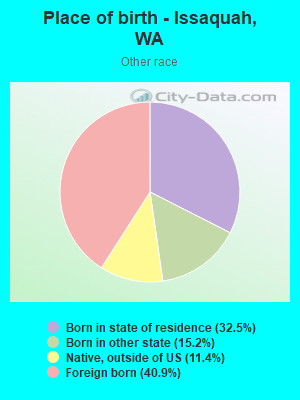
Place of birth - Born in state of residence (%) - Other Race
Place of birth - Born in other state (%)
Place of birth - Born in other state (%) - White
Place of birth - Born in other state (%) - Black or African American
Place of birth - Born in other state (%) - Asian
Place of birth - Born in other state (%) - Hispanic or Latino
Place of birth - Born in other state (%) - American Indian and Alaska Native
Place of birth - Born in other state (%) - Multirace
Place of birth - Born in other state (%) - Other Race
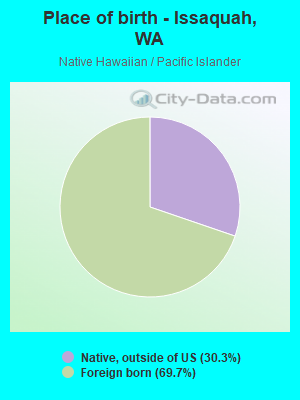
Place of birth - Native, outside of US (%)
Place of birth - Native, outside of US (%) - White
Place of birth - Native, outside of US (%) - Black or African American
Place of birth - Native, outside of US (%) - Asian
Place of birth - Native, outside of US (%) - Hispanic or Latino
Place of birth - Native, outside of US (%) - American Indian and Alaska Native
Place of birth - Native, outside of US (%) - Multirace
Place of birth - Native, outside of US (%) - Other Race
Place of birth - Foreign born (%)
Place of birth - Foreign born (%) - White
Place of birth - Foreign born (%) - Black or African American
Place of birth - Foreign born (%) - Asian
Place of birth - Foreign born (%) - Hispanic or Latino
Place of birth - Foreign born (%) - American Indian and Alaska Native
Place of birth - Foreign born (%) - Multirace
Place of birth - Foreign born (%) - Other Race
Residents speaking English at home (%)
Residents speaking English at home - Born in the United States (%)
Residents speaking English at home - Native, born elsewhere (%)
Residents speaking English at home - Foreign born (%)
Residents speaking Spanish at home (%)
Residents speaking Spanish at home - Born in the United States (%)
Residents speaking Spanish at home - Native, born elsewhere (%)
Residents speaking Spanish at home - Foreign born (%)
Residents speaking other language at home (%)
Residents speaking other language at home - Born in the United States (%)
Residents speaking other language at home - Native, born elsewhere (%)
Residents speaking other language at home - Foreign born (%)
Marital status - Never married (%)
Marital status - Now married (%)
Marital status - Separated (%)
Marital status - Widowed (%)
Marital status - Divorced (%)
Ancestries Reported - Arab (%)
Ancestries Reported - Czech (%)
Ancestries Reported - Danish (%)
Ancestries Reported - Dutch (%)
Ancestries Reported - English (%)
Ancestries Reported - French (%)
Ancestries Reported - French Canadian (%)
Ancestries Reported - German (%)
Ancestries Reported - Greek (%)
Ancestries Reported - Hungarian (%)
Ancestries Reported - Irish (%)
Ancestries Reported - Italian (%)
Ancestries Reported - Lithuanian (%)
Ancestries Reported - Norwegian (%)
Ancestries Reported - Polish (%)
Ancestries Reported - Portuguese (%)
Ancestries Reported - Russian (%)
Ancestries Reported - Scotch-Irish (%)
Ancestries Reported - Scottish (%)
Ancestries Reported - Slovak (%)
Ancestries Reported - Subsaharan African (%)
Ancestries Reported - Swedish (%)
Ancestries Reported - Swiss (%)
Ancestries Reported - Ukrainian (%)
Ancestries Reported - United States (%)
Ancestries Reported - Welsh (%)
Ancestries Reported - West Indian (%)
Ancestries Reported - Other (%)
Geographical mobility - Same house 1 year ago (%)
Geographical mobility - Same house 1 year ago (%) - White
Geographical mobility - Same house 1 year ago (%) - Black or African American
Geographical mobility - Same house 1 year ago (%) - Asian
Geographical mobility - Same house 1 year ago (%) - Hispanic or Latino
Geographical mobility - Same house 1 year ago (%) - American Indian and Alaska Native
Geographical mobility - Same house 1 year ago (%) - Multirace
Geographical mobility - Same house 1 year ago (%) - Other Race
Geographical mobility - Moved within same county (%)
Geographical mobility - Moved within same county (%) - White
Geographical mobility - Moved within same county (%) - Black or African American
Geographical mobility - Moved within same county (%) - Asian
Geographical mobility - Moved within same county (%) - Hispanic or Latino
Geographical mobility - Moved within same county (%) - American Indian and Alaska Native
Geographical mobility - Moved within same county (%) - Multirace
Geographical mobility - Moved within same county (%) - Other Race
Geographical mobility - Moved from different county within same state (%)
Geographical mobility - Moved from different county within same state (%) - White
Geographical mobility - Moved from different county within same state (%) - Black or African American
Geographical mobility - Moved from different county within same state (%) - Asian
Geographical mobility - Moved from different county within same state (%) - Hispanic or Latino
Geographical mobility - Moved from different county within same state (%) - American Indian and Alaska Native
Geographical mobility - Moved from different county within same state (%) - Multirace
Geographical mobility - Moved from different county within same state (%) - Other Race
Geographical mobility - Moved from different state (%)
Geographical mobility - Moved from different state (%) - White
Geographical mobility - Moved from different state (%) - Black or African American
Geographical mobility - Moved from different state (%) - Asian
Geographical mobility - Moved from different state (%) - Hispanic or Latino
Geographical mobility - Moved from different state (%) - American Indian and Alaska Native
Geographical mobility - Moved from different state (%) - Multirace
Geographical mobility - Moved from different state (%) - Other Race
Geographical mobility - Moved from abroad (%)
Geographical mobility - Moved from abroad (%) - White
Geographical mobility - Moved from abroad (%) - Black or African American
Geographical mobility - Moved from abroad (%) - Asian
Geographical mobility - Moved from abroad (%) - Hispanic or Latino
Geographical mobility - Moved from abroad (%) - American Indian and Alaska Native
Geographical mobility - Moved from abroad (%) - Multirace
Geographical mobility - Moved from abroad (%) - Other Race
Place of birth for the foreign-born population - Ireland (%)
Place of birth for the foreign-born population - Denmark (%)
Place of birth for the foreign-born population - Norway (%)
Place of birth for the foreign-born population - Sweden (%)
Place of birth for the foreign-born population - United Kingdom (%)
Place of birth for the foreign-born population - England (%)
Place of birth for the foreign-born population - Scotland (%)
Place of birth for the foreign-born population - Other Northern Europe (%)
Place of birth for the foreign-born population - Austria (%)
Place of birth for the foreign-born population - Belgium (%)
Place of birth for the foreign-born population - France (%)
Place of birth for the foreign-born population - Germany (%)
Place of birth for the foreign-born population - Netherlands (%)
Place of birth for the foreign-born population - Switzerland (%)
Place of birth for the foreign-born population - Other Western Europe (%)
Place of birth for the foreign-born population - Greece (%)
Place of birth for the foreign-born population - Italy (%)
Place of birth for the foreign-born population - Portugal (%)
Place of birth for the foreign-born population - Spain (%)
Place of birth for the foreign-born population - Other Southern Europe (%)
Place of birth for the foreign-born population - Albania (%)
Place of birth for the foreign-born population - Belarus (%)
Place of birth for the foreign-born population - Bosnia and Herzegovina (%)
Place of birth for the foreign-born population - Bulgaria (%)
Place of birth for the foreign-born population - Croatia (%)
Place of birth for the foreign-born population - Czechoslovakia (%)
Place of birth for the foreign-born population - Hungary (%)
Place of birth for the foreign-born population - Latvia (%)
Place of birth for the foreign-born population - Lithuania (%)
Place of birth for the foreign-born population - North Macedonia (Macedonia) (%)
Place of birth for the foreign-born population - Moldova (%)
Place of birth for the foreign-born population - Poland (%)
Place of birth for the foreign-born population - Romania (%)
Place of birth for the foreign-born population - Russia (%)
Place of birth for the foreign-born population - Serbia (%)
Place of birth for the foreign-born population - Ukraine (%)
Place of birth for the foreign-born population - Other Eastern Europe (%)
Place of birth for the foreign-born population - China (%)
Place of birth for the foreign-born population - Hong Kong (%)
Place of birth for the foreign-born population - Taiwan (%)
Place of birth for the foreign-born population - Japan (%)
Place of birth for the foreign-born population - Korea (%)
Place of birth for the foreign-born population - Other Eastern Asia (%)
Place of birth for the foreign-born population - Afghanistan (%)
Place of birth for the foreign-born population - Bangladesh (%)
Place of birth for the foreign-born population - India (%)
Place of birth for the foreign-born population - Iran (%)
Place of birth for the foreign-born population - Kazakhstan (%)
Place of birth for the foreign-born population - Nepal (%)
Place of birth for the foreign-born population - Pakistan (%)
Place of birth for the foreign-born population - Sri Lanka (%)
Place of birth for the foreign-born population - Uzbekistan (%)
Place of birth for the foreign-born population - Other South Central Asia (%)
Place of birth for the foreign-born population - Burma (%)
Place of birth for the foreign-born population - Cambodia (%)
Place of birth for the foreign-born population - Indonesia (%)
Place of birth for the foreign-born population - Laos (%)
Place of birth for the foreign-born population - Malaysia (%)
Place of birth for the foreign-born population - Philippines (%)
Place of birth for the foreign-born population - Singapore (%)
Place of birth for the foreign-born population - Thailand (%)
Place of birth for the foreign-born population - Vietnam (%)
Place of birth for the foreign-born population - Other South Eastern Asia (%)
Place of birth for the foreign-born population - Armenia (%)
Place of birth for the foreign-born population - Iraq (%)
Place of birth for the foreign-born population - Israel (%)
Place of birth for the foreign-born population - Jordan (%)
Place of birth for the foreign-born population - Kuwait (%)
Place of birth for the foreign-born population - Lebanon (%)
Place of birth for the foreign-born population - Saudi Arabia (%)
Place of birth for the foreign-born population - Syria (%)
Place of birth for the foreign-born population - Turkey (%)
Place of birth for the foreign-born population - Yemen (%)
Place of birth for the foreign-born population - Other Western Asia (%)
Place of birth for the foreign-born population - Eritrea (%)
Place of birth for the foreign-born population - Ethiopia (%)
Place of birth for the foreign-born population - Kenya (%)
Place of birth for the foreign-born population - Somalia (%)
Place of birth for the foreign-born population - Uganda (%)
Place of birth for the foreign-born population - Zimbabwe (%)
Place of birth for the foreign-born population - Other Eastern Africa (%)
Place of birth for the foreign-born population - Cameroon (%)
Place of birth for the foreign-born population - Congo (%)
Place of birth for the foreign-born population - Democratic Republic of Congo (Zaire) (%)
Place of birth for the foreign-born population - Other Middle Africa (%)
Place of birth for the foreign-born population - Egypt (%)
Place of birth for the foreign-born population - Morocco (%)
Place of birth for the foreign-born population - Sudan (%)
Place of birth for the foreign-born population - Other Northern Africa (%)
Place of birth for the foreign-born population - South Africa (%)
Place of birth for the foreign-born population - Other Southern Africa (%)
Place of birth for the foreign-born population - Cabo Verde (%)
Place of birth for the foreign-born population - Ghana (%)
Place of birth for the foreign-born population - Liberia (%)
Place of birth for the foreign-born population - Nigeria (%)
Place of birth for the foreign-born population - Senegal (%)
Place of birth for the foreign-born population - Sierra Leone (%)
Place of birth for the foreign-born population - Other Western Africa (%)
Place of birth for the foreign-born population - Australia (%)
Place of birth for the foreign-born population - New Zealand (%)
Place of birth for the foreign-born population - Fiji (%)
Place of birth for the foreign-born population - Micronesia (%)
Place of birth for the foreign-born population - Bahamas (%)
Place of birth for the foreign-born population - Barbados (%)
Place of birth for the foreign-born population - Cuba (%)
Place of birth for the foreign-born population - Dominica (%)
Place of birth for the foreign-born population - Dominican Republic (%)
Place of birth for the foreign-born population - Grenada (%)
Place of birth for the foreign-born population - Haiti (%)
Place of birth for the foreign-born population - Jamaica (%)
Place of birth for the foreign-born population - St. Vincent and the Grenadines (%)
Place of birth for the foreign-born population - Trinidad and Tobago (%)
Place of birth for the foreign-born population - West Indies (%)
Place of birth for the foreign-born population - Other Caribbean (%)
Place of birth for the foreign-born population - Belize (%)
Place of birth for the foreign-born population - Costa Rica (%)
Place of birth for the foreign-born population - El Salvador (%)
Place of birth for the foreign-born population - Guatemala (%)
Place of birth for the foreign-born population - Honduras (%)
Place of birth for the foreign-born population - Mexico (%)
Place of birth for the foreign-born population - Nicaragua (%)
Place of birth for the foreign-born population - Panama (%)
Place of birth for the foreign-born population - Other Central America (%)
Place of birth for the foreign-born population - Argentina (%)
Place of birth for the foreign-born population - Bolivia (%)
Place of birth for the foreign-born population - Brazil (%)
Place of birth for the foreign-born population - Chile (%)
Place of birth for the foreign-born population - Colombia (%)
Place of birth for the foreign-born population - Ecuador (%)
Place of birth for the foreign-born population - Guyana (%)
Place of birth for the foreign-born population - Peru (%)
Place of birth for the foreign-born population - Uruguay (%)
Place of birth for the foreign-born population - Venezuela (%)
Place of birth for the foreign-born population - Other South America (%)
Place of birth for the foreign-born population - Canada (%)
Place of birth for the foreign-born population - Other Northern America (%)
Place of birth for the foreign-born population - Other (%)
Latest news about races in Issaquah, WA collected exclusively by city-data.com from local newspapers, TV, and radio stations
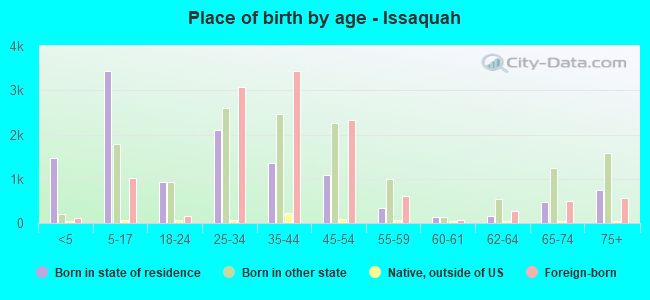
According to 2022 data, the most numerous races in Issaquah, WA are White alone (21,863 residents), Hispanic (2,609 residents), and Asian alone (11,219 residents). 65.8% of Issaquah residents speak English at home. 30.7% of Issaquah, WA residents are foreign-born (18.9% born in Asia, 5.2% born in Europe), which is 51.1% greater than the foreign-born rate of 15.0% across the entire state of Washington.
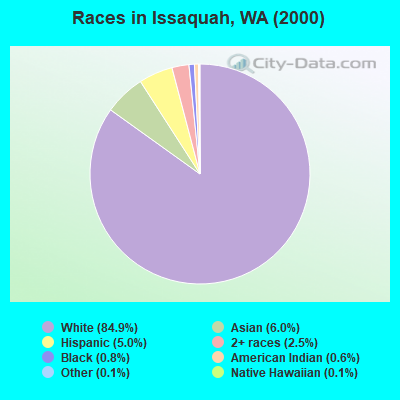
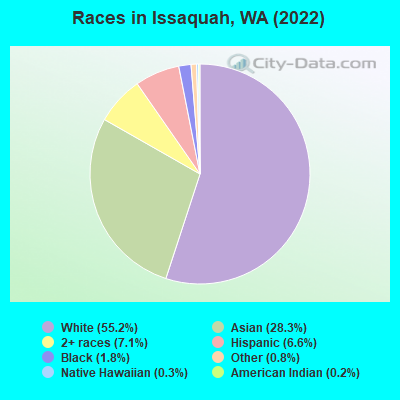
Race distribution in Issaquah
2000 2022
4,652,490 78.9% White alone 441,509 7.5% Hispanic 319,401 5.4% Asian alone 184,631 3.1% Black alone 175,926 3.0% Two or more races 85,396 1.4% American Indian alone 22,779 0.4% Native Hawaiian and Other 11,989 0.2% Other race alone
4,941,456 63.5% White alone 1,093,313 14.0% Hispanic 755,832 9.7% Asian alone 523,448 6.7% Two or more races 299,537 3.8% Black alone 69,024 0.9% American Indian alone 52,231 0.7% Native Hawaiian and Other 50,945 0.7% Other race alone
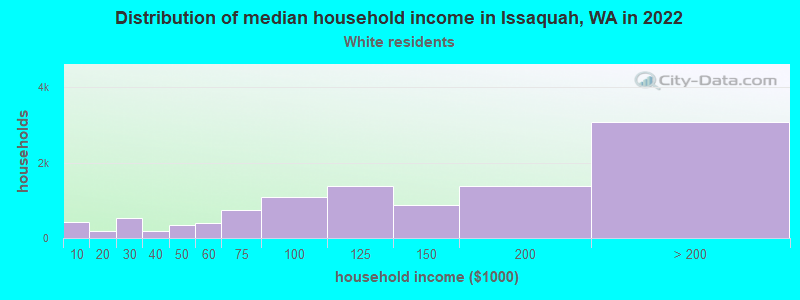
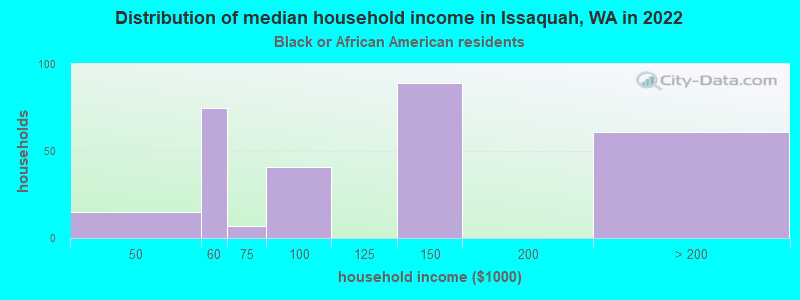
Income and house value in Issaquah Median household income in 2022 $126,080 White non-Hispanic householders$103,482 Black householders$93,200 American Indian and Alaska Native householdersover $200,000 Asian householders$136,470 Some other race householders$102,966 Hispanic or Latino race householdersMedian 2022 house value over $1,000,000 White Non-Hispanic householders$743,949 Black or African American householders$731,649 American Indian or Alaska Native householders $951,065 Asian householdersover $1,000,000 Two or more races householdersover $1,000,000 Hispanic or Latino householders
Median age by race in Issaquah
41.6 Median age for White residents40.9 42.3 34.9 Median age for Black or African American residents35.9 34.7 34.4 Median age for American Indian / Alaska Native residents35.0 40.4 35.2 Median age for Asian residents35.6 34.5 18.5 Median age for Native Hawaiian / Pacific Islander residents-664,509,168.7 25.6 30.6 Median age for Other race residents31.5 29.6 22.7 Median age for Two or more races residents22.9 26.1 41.3 Median age for White alone residents40.6 42.3 28.9 Median age for Hispanic or Latino residents22.6 31.9
Owner/renter occupied households by race in Issaquah
House owners and renters - White residents 5,775 54.4% Owner occupied4,847 45.6% Renter occupiedHouse owners and renters - Black or African American residents 261 100.0% Renter occupiedHouse owners and renters - American Indian / Alaska Native residents 58 100.0% Renter occupiedHouse owners and renters - Asian residents 3,162 70.4% Owner occupied1,328 29.6% Renter occupiedHouse owners and renters - Native Hawaiian / Pacific Islander residents 18 100.0% Renter occupiedHouse owners and renters - Other race residents 188 40.1% Owner occupied281 59.9% Renter occupiedHouse owners and renters - Two or more races residents 721 69.5% Owner occupied317 30.5% Renter occupiedHouse owners and renters - White alone residents 5,764 54.7% Owner occupied4,778 45.3% Renter occupiedHouse owners and renters - Hispanic or Latino residents 264 36.2% Owner occupied466 63.8% Renter occupied
Language usage in Issaquah
English speakers - Total 65.8% of residents of Issaquah speak English at home.
4.8% of residents speak Spanish at home 1,425 78.0% Speak English very well402 22.0% Speak English less than very well29.8% of residents speak other language at home 8,414 74.7% Speak English very well2,851 25.3% Speak English less than very well
English speakers - Born in the United States 89.2% of residents of Issaquah speak English at home.
2.4% of residents speak Spanish at home 345 100.0% Speak English very well8.4% of residents speak other language at home 1,220 100.0% Speak English very well
English speakers - Native, born elsewhere 66.4% of residents of Issaquah speak English at home.
19.6% of residents speak Spanish at home 60 51.7% Speak English very well56 48.3% Speak English less than very well16.4% of residents speak other language at home 97 100.0% Speak English very well
English speakers - Foreign-born 21.6% of residents of Issaquah speak English at home.
6.6% of residents speak Spanish at home 502 63.1% Speak English very well293 36.9% Speak English less than very well72.3% of residents speak other language at home 6,177 71.0% Speak English very well2,524 29.0% Speak English less than very well
White (Caucasian) - Speak only English Native:
95.1% (17,655)Foreign-born:
47.8% (1,283)
White (Caucasian) - Speak another language Native:
4.9% (901)Foreign-born:
51.6% (1,386)
Black or African American - Speak another language Native:
9.5% (32)Foreign-born:
97.3% (326)
American Indian / Alaska Native - Speak another language Native:
21.8% (20)Foreign-born:
100.0% (53)
Asian - Speak only English Native:
54.0% (1,591)Foreign-born:
14.5% (1,127)
Asian - Speak another language Native:
46.3% (1,363)Foreign-born:
85.6% (6,670)
Native Hawaiian / Pacific Islander - Speak another language Native:
100.0% (26)Foreign-born:
77.9% (77)
Other race - Speak only English Native:
19.5% (135)Foreign-born:
8.8% (49)
Other race - Speak another language Native:
79.4% (549)Foreign-born:
90.3% (502)
Two or more races - Speak only English Native:
76.8% (2,440)Foreign-born:
4.9% (18)
Two or more races - Speak another language Native:
24.4% (777)Foreign-born:
95.4% (347)
White alone - Speak only English Native:
95.2% (17,541)Foreign-born:
47.7% (1,305)
White alone - Speak another language Native:
4.9% (909)Foreign-born:
49.7% (1,362)
Hispanic or Latino - Speak only English Native:
44.2% (715)Foreign-born:
11.3% (92)
Hispanic or Latino - Speak another language Native:
56.5% (912)Foreign-born:
88.0% (716)
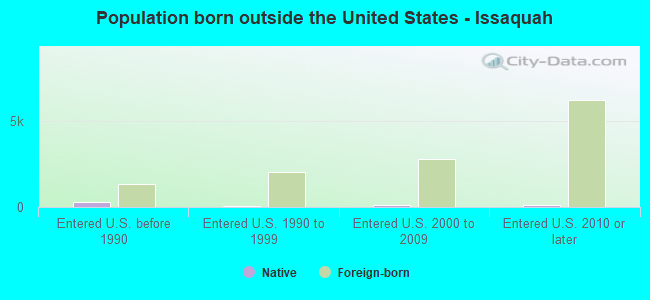
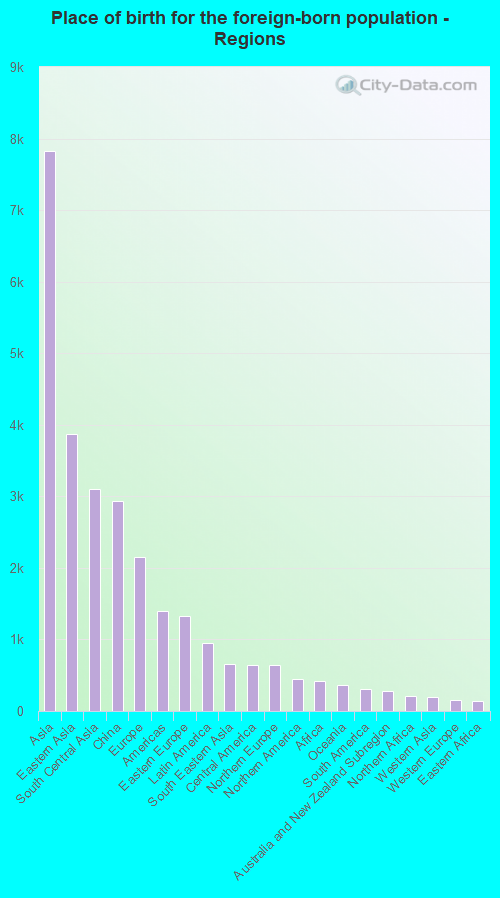
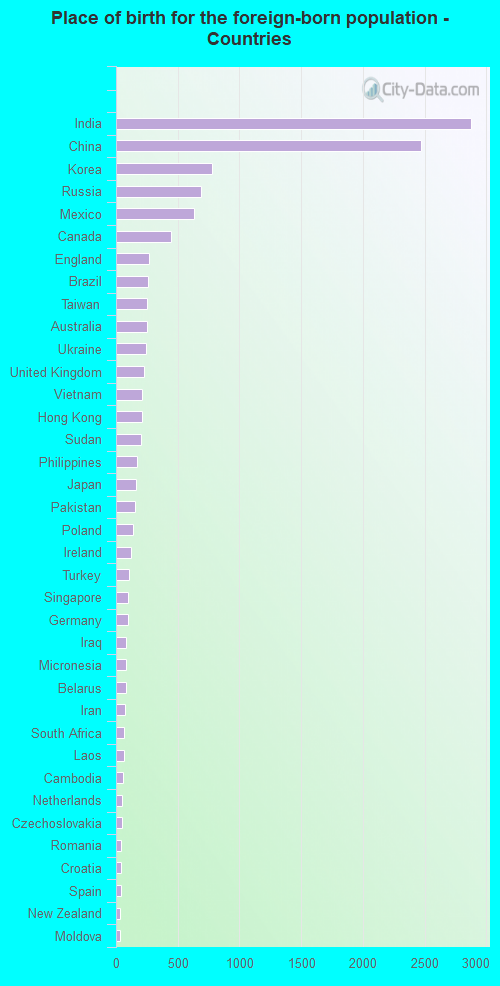
Foreign-born residents in Issaquah 12,160 residents are foreign born (18.9% Asia , 5.2% Europe ).
This city:
30.7%Washington:
14.9%
Marital status for residents in Issaquah Marital status - White (Caucasian) population 15 years and over
Males 32.1% Never married54.4% Now married0.2% Separated2.0% Widowed11.2% DivorcedFemales 28.9% Never married48.0% Now married0.8% Separated7.7% Widowed14.6% DivorcedWomen who gave birth in the past 12 months Now married:
73.5% (136)Unmarried:
26.5% (49)
Women who did not give birth in the past 12 months Now married:
45.8% (2,600)Unmarried:
54.2% (3,078)
Marital status - Black or African American population 15 years and over
Males 23.5% Never married61.8% Now married0.0% Separated0.0% Widowed14.7% DivorcedFemales 6.6% Never married93.4% Now married0.0% Separated0.0% Widowed0.0% DivorcedWomen who did not give birth in the past 12 months Now married:
90.7% (169)Unmarried:
9.3% (17)
Marital status - American Indian / Alaska Native population 15 years and over
Males 56.9% Never married43.1% Now married0.0% Separated0.0% Widowed0.0% DivorcedFemales 0.0% Never married59.1% Now married0.0% Separated2.3% Widowed38.6% DivorcedWomen who did not give birth in the past 12 months Now married:
100.0% (6)Unmarried:
0.0% (0)
Marital status - Asian population 15 years and over
Males 27.5% Never married70.5% Now married1.0% Separated0.3% Widowed0.7% DivorcedFemales 22.5% Never married69.4% Now married0.7% Separated5.2% Widowed2.3% DivorcedWomen who gave birth in the past 12 months Now married:
100.0% (56)Unmarried:
0.0% (0)
Women who did not give birth in the past 12 months Now married:
72.4% (2,416)Unmarried:
27.6% (922)
Marital status - Other race population 15 years and over
Males 39.2% Never married49.2% Now married5.8% Separated2.5% Widowed3.4% DivorcedFemales 49.0% Never married38.5% Now married0.0% Separated6.8% Widowed5.7% DivorcedWomen who gave birth in the past 12 months Now married:
0.0% (0)Unmarried:
100.0% (35)
Women who did not give birth in the past 12 months Now married:
48.3% (177)Unmarried:
51.7% (189)
Marital status - Two or more races population 15 years and over
Males 49.4% Never married49.6% Now married0.0% Separated0.0% Widowed1.0% DivorcedFemales 48.1% Never married45.9% Now married0.0% Separated0.0% Widowed6.0% DivorcedWomen who gave birth in the past 12 months Now married:
100.0% (77)Unmarried:
0.0% (0)
Women who did not give birth in the past 12 months Now married:
32.8% (289)Unmarried:
67.2% (591)
Marital status - White alone, not Hispanic / Latino population 15 years and over
Males 32.5% Never married54.0% Now married0.1% Separated1.9% Widowed11.4% DivorcedFemales 28.5% Never married48.0% Now married0.8% Separated7.8% Widowed14.8% DivorcedWomen who gave birth in the past 12 months Now married:
69.0% (112)Unmarried:
31.0% (50)
Women who did not give birth in the past 12 months Now married:
46.0% (2,596)Unmarried:
54.0% (3,048)
Marital status - Hispanic or Latino population 15 years and over
Males 41.4% Never married46.9% Now married5.1% Separated3.2% Widowed3.4% DivorcedFemales 42.9% Never married46.9% Now married0.0% Separated3.5% Widowed6.7% DivorcedWomen who gave birth in the past 12 months Now married:
62.2% (48)Unmarried:
37.8% (29)
Women who did not give birth in the past 12 months Now married:
45.3% (290)Unmarried:
54.7% (350)
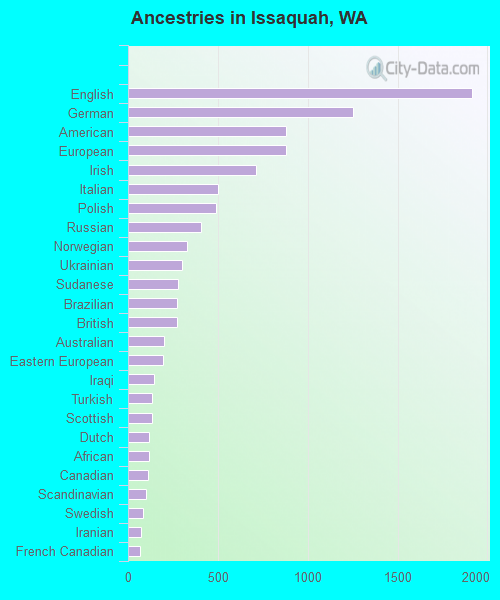
Ancestries in Issaquah
1,913 8.4% English1,251 5.5% German881 3.9% American879 3.9% European710 3.1% Irish502 2.2% Italian491 2.2% Polish404 1.8% Russian329 1.4% Norwegian303 1.3% Ukrainian280 1.2% Sudanese273 1.2% Brazilian271 1.2% British202 0.9% Australian197 0.9% Eastern European142 0.6% Iraqi134 0.6% Turkish133 0.6% Scottish119 0.5% Dutch116 0.5% African112 0.5% Canadian101 0.4% Scandinavian82 0.4% Swedish70 0.3% Iranian69 0.3% French Canadian51 0.2% Scotch-Irish50 0.2% Egyptian48 0.2% Lithuanian46 0.2% Swiss44 0.2% Northern European42 0.2% Czechoslovakian40 0.2% Danish39 0.2% Romanian36 0.2% Portuguese33 0.1% French32 0.1% Welsh31 0.1% Greek30 0.1% Croatian19 0.08% Latvian17 0.07% Czech14 0.06% Slavic14 0.06% Hungarian11 0.05% Arab8 0.04% Finnish6 0.03% Bulgarian
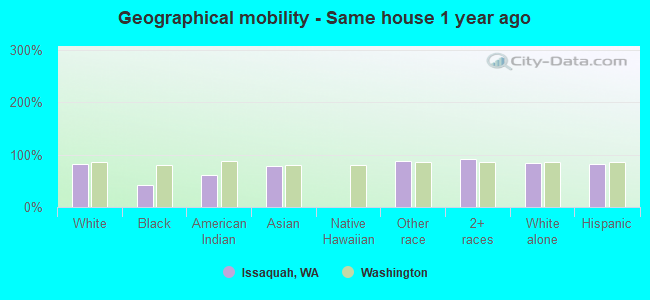
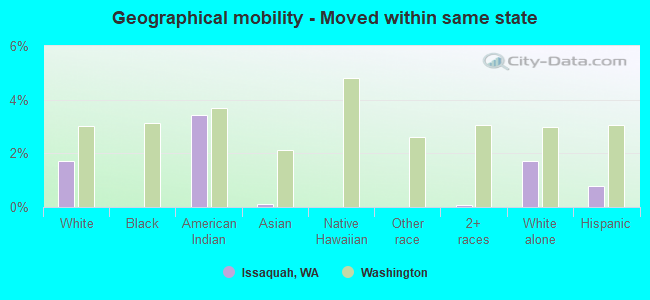
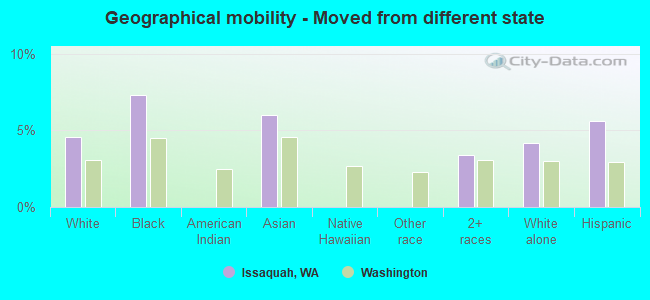
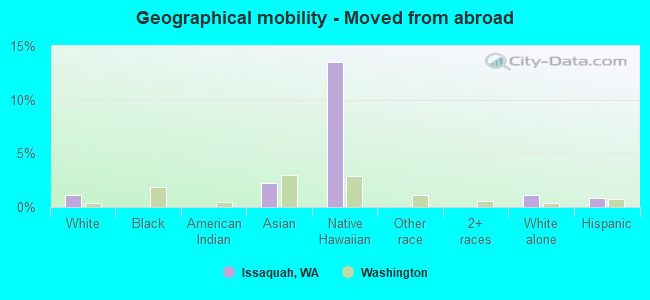
Geographical mobility in Issaquah Same house 1 year ago 18,006 82.5% White (Caucasian)305 41.4% Black or African American94 60.2% American Indian / Alaska Native8,782 77.9% Asian1,164 87.0% Other race3,585 91.0% Two or more races18,046 83.1% White alone, not Hispanic / Latino2,092 82.6% Hispanic or LatinoMoved within same county 2,125 9.7% White / Caucasian307 41.8% Black or African American57 36.9% American Indian / Alaska Native1,580 14.0% Asian80 72.5% Native Hawaiian / Pacific Islander157 11.7% Other race228 5.8% Two or more races2,094 9.6% White alone, not Hispanic / Latino259 10.2% Hispanic or LatinoMoved within same state 376 1.7% White / Caucasian5 3.4% American Indian / Alaska Native13 0.1% Asian3 0.1% Two or more races373 1.7% White alone, not Hispanic / Latino20 0.8% Hispanic or LatinoMoved from different state 997 4.6% White / Caucasian54 7.3% Black or African American678 6.0% Asian134 3.4% Two or more races909 4.2% White alone, not Hispanic / Latino142 5.6% Hispanic or LatinoMoved from abroad 241 1.1% White249 2.2% Asian15 13.5% Native Hawaiian / Pacific Islander239 1.1% White alone, not Hispanic / Latino21 0.8% Hispanic or Latino
Children Nativity (place of birth) in Issaquah
Children under 6 years - Living with two parents Both parents native 864 100.0% NativeBoth parents foreign-born 729 83.2% Native147 16.8% Foreign-bornOne native, one foreign-born parent 207 100.0% NativeChildren under 6 years - Living with one parent Native parent 227 100.0% NativeForeign-born parent 64 100.0% NativeChildren 6 to 17 years - Living with two parents Both parents native 1,358 100.0% NativeBoth parents foreign-born 1,469 64.7% Native803 35.3% Foreign-bornOne native, one foreign-born parent 1,014 97.5% Native26 2.5% Foreign-bornChildren 6 to 17 years - Living with one parent Native parent 756 100.0% NativeForeign-born parent 296 54.6% Native246 45.4% Foreign-born
Grandparents responsible for own grandchildren in Issaquah
Grandparents (30 to 59 years) Asian 29 100.0% Not responsible for grandchildrenOther race 21 100.0% Not responsible for grandchildrenHispanic or Latino 24 100.0% Not responsible for grandchildrenGrandparents (60 years and over) Asian 20 42.8% Responsible for grandchildren27 57.2% Not responsible for grandchildren