Races in Islamorada, Florida (FL) Detailed Stats
Latest news about races in Islamorada, FL collected exclusively by city-data.com from local newspapers, TV, and radio stations
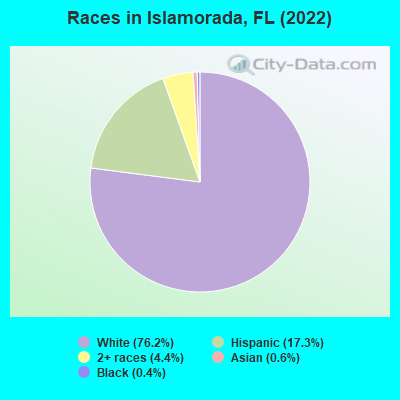
According to 2022 data, the most numerous races in Islamorada, FL are White alone (5,344 residents), Hispanic (1,211 residents), and Black alone (25 residents). 83.3% of Islamorada residents speak English at home. 12.6% of Islamorada, FL residents are foreign-born (8.1% born in Latin America, 2.6% born in Europe), which is 66.1% less than the foreign-born rate of 21.0% across the entire state of Florida.
Race distribution in Islamorada
2000 2022
10,458,509 65.4% White alone 2,682,715 16.8% Hispanic 2,264,268 14.2% Black alone 261,693 1.6% Asian alone 236,954 1.5% Two or more races 42,358 0.3% American Indian alone 28,994 0.2% Other race alone 6,887 0.04% Native Hawaiian and Other
11,309,403 50.8% White alone 6,025,039 27.1% Hispanic 3,241,015 14.6% Black alone 861,630 3.9% Two or more races 623,692 2.8% Asian alone 152,054 0.7% Other race alone 22,504 0.1% American Indian alone 9,486 0.04% Native Hawaiian and Other
Income and house value in Islamorada Median household income in 2022 $89,242 White non-Hispanic householdersMedian 2022 house value over $1,000,000 White Non-Hispanic householders $65,409 Asian householders$591,679 Two or more races householdersover $1,000,000 Hispanic or Latino householders
Median age by race in Islamorada
60.0 Median age for White residents60.8 58.5 75.6 Median age for Black or African American residents64.8 67.2 -598,566,307.6 Median age for American Indian / Alaska Native residents-611,418,047.3 -594,925,633.7 38.0 Median age for Asian residents8.1 47.8 -679,849,340.2 Median age for Native Hawaiian / Pacific Islander residents-858,307,848.3 -666,666,666.0 13.1 Median age for Other race residents26.2 5.9 56.0 Median age for Two or more races residents42.6 55.4 58.5 Median age for White alone residents59.3 56.7 40.9 Median age for Hispanic or Latino residents40.4 48.1
Owner/renter occupied households by race in Islamorada
House owners and renters - White residents 2,151 80.2% Owner occupied530 19.8% Renter occupiedHouse owners and renters - Black or African American residents 22 100.0% Renter occupiedHouse owners and renters - Asian residents 7 41.6% Owner occupied9 58.4% Renter occupiedHouse owners and renters - Other race residents 63 65.2% Owner occupied34 34.8% Renter occupiedHouse owners and renters - Two or more races residents 295 100.0% Owner occupiedHouse owners and renters - White alone residents 2,150 80.5% Owner occupied522 19.5% Renter occupiedHouse owners and renters - Hispanic or Latino residents 300 67.3% Owner occupied146 32.7% Renter occupied
Language usage in Islamorada
English speakers - Total 83.3% of residents of Islamorada speak English at home.
11.6% of residents speak Spanish at home 355 45.3% Speak English very well428 54.7% Speak English less than very well4.9% of residents speak other language at home 274 83.8% Speak English very well53 16.2% Speak English less than very well
All residents speak only English at home
English speakers - Native, born elsewhere 38.5% of residents of Islamorada speak English at home.
61.5% of residents speak Spanish at home 8 100.0% Speak English less than very well
English speakers - Foreign-born 14.3% of residents of Islamorada speak English at home.
59.0% of residents speak Spanish at home 195 34.2% Speak English very well376 65.8% Speak English less than very well24.7% of residents speak other language at home 185 77.4% Speak English very well54 22.6% Speak English less than very well
White (Caucasian) - Speak only English Native:
99.7% (4,888)Foreign-born:
29.2% (81)
White (Caucasian) - Speak another language Native:
1.9% (92)Foreign-born:
63.8% (177)
Asian - Speak only English Native:
100.0% (26)Foreign-born:
47.4% (15)
Other race - Speak another language Native:
35.5% (78)Foreign-born:
98.4% (114)
Two or more races - Speak only English Native:
67.4% (298)Foreign-born:
5.1% (24)
Two or more races - Speak another language Native:
35.0% (155)Foreign-born:
95.5% (458)
White alone - Speak only English Native:
97.9% (4,927)Foreign-born:
30.8% (75)
White alone - Speak another language Native:
2.1% (106)Foreign-born:
62.7% (154)
Hispanic or Latino - Speak only English Native:
53.7% (249)Foreign-born:
3.5% (21)
Hispanic or Latino - Speak another language Native:
42.0% (194)Foreign-born:
94.9% (562)
Foreign-born residents in Islamorada 887 residents are foreign born (8.1% Latin America , 2.6% Europe ).
This city:
12.6%Florida:
21.1%
Marital status for residents in Islamorada Marital status - White (Caucasian) population 15 years and over
Males 22.3% Never married59.8% Now married2.5% Separated2.5% Widowed12.9% DivorcedFemales 13.8% Never married59.0% Now married1.8% Separated10.6% Widowed14.8% DivorcedWomen who gave birth in the past 12 months Now married:
100.0% (10)Unmarried:
0.0% (0)
Women who did not give birth in the past 12 months Now married:
56.5% (343)Unmarried:
43.5% (264)
Marital status - Black or African American population 15 years and over
Males 16.7% Never married22.2% Now married38.9% Separated22.2% Widowed0.0% DivorcedFemales 89.3% Never married0.0% Now married0.0% Separated10.7% Widowed0.0% DivorcedWomen who did not give birth in the past 12 months Now married:
0.0% (0)Unmarried:
100.0% (4)
Marital status - Asian population 15 years and over
Males 20.0% Never married80.0% Now married0.0% Separated0.0% Widowed0.0% DivorcedFemales 0.0% Never married57.1% Now married0.0% Separated42.9% Widowed0.0% DivorcedWomen who did not give birth in the past 12 months Now married:
100.0% (12)Unmarried:
0.0% (0)
Marital status - Other race population 15 years and over
Males 62.5% Never married15.6% Now married0.0% Separated0.0% Widowed21.9% DivorcedFemales 0.0% Never married100.0% Now married0.0% Separated0.0% Widowed0.0% DivorcedWomen who did not give birth in the past 12 months Now married:
100.0% (57)Unmarried:
0.0% (0)
Marital status - Two or more races population 15 years and over
Males 8.5% Never married83.1% Now married0.0% Separated0.0% Widowed8.5% DivorcedFemales 0.0% Never married70.2% Now married0.0% Separated13.0% Widowed16.8% DivorcedWomen who gave birth in the past 12 months Now married:
100.0% (39)Unmarried:
0.0% (0)
Women who did not give birth in the past 12 months Now married:
0.0% (0)Unmarried:
100.0% (21)
Marital status - White alone, not Hispanic / Latino population 15 years and over
Males 22.8% Never married58.7% Now married2.6% Separated2.1% Widowed13.8% DivorcedFemales 14.4% Never married59.2% Now married1.9% Separated9.6% Widowed14.8% DivorcedWomen who gave birth in the past 12 months Now married:
100.0% (11)Unmarried:
0.0% (0)
Women who did not give birth in the past 12 months Now married:
55.5% (359)Unmarried:
44.5% (287)
Marital status - Hispanic or Latino population 15 years and over
Males 21.1% Never married64.5% Now married0.2% Separated3.7% Widowed10.5% DivorcedFemales 6.1% Never married62.4% Now married0.0% Separated17.2% Widowed14.3% DivorcedWomen who did not give birth in the past 12 months Now married:
70.8% (73)Unmarried:
29.2% (30)
Ancestries in Islamorada
385 11.5% American372 11.1% Irish363 10.8% Italian352 10.5% German296 8.8% English107 3.2% Polish79 2.4% European77 2.3% Ukrainian58 1.7% Swedish54 1.6% French50 1.5% Eastern European45 1.3% Welsh38 1.1% Romanian37 1.1% Scottish24 0.7% Swiss21 0.6% Dutch19 0.6% British19 0.6% Norwegian15 0.4% Austrian9 0.3% Latvian8 0.2% Scandinavian7 0.2% New Zealander4 0.1% Belgian4 0.1% French Canadian4 0.1% Haitian2 0.06% Armenian
Children Nativity (place of birth) in Islamorada
Children under 6 years - Living with two parents Both parents native 382 100.0% NativeBoth parents foreign-born 83 100.0% NativeOne native, one foreign-born parent 10 100.0% NativeChildren 6 to 17 years - Living with two parents Both parents native 324 100.0% NativeBoth parents foreign-born 59 67.0% Native29 33.0% Foreign-bornOne native, one foreign-born parent 30 100.0% NativeChildren 6 to 17 years - Living with one parent Native parent 106 100.0% Native