Races in Inverness, Florida (FL) Detailed Stats
Ancestries, Foreign-born residents, place of birth
Settings
X


Recent posts about races in Inverness, Florida on our local forum with over 2,400,000 registered users:
 | Inverness or Dunnellon Pros and Cons (12 replies) |
| Need Inverness Realtor to go check a house for me - Easy $! (0 replies) |
| Beverly Hills, Inverness, or Homosassa Springs area to live (8 replies) |
| 2022 hurricane season (326 replies) |
| 2023 hurricane season (44 replies) |
| What you need to know about Inverness and Crystal River. (3 replies) |
Latest news about races in Inverness, FL collected exclusively by city-data.com from local newspapers, TV, and radio stations
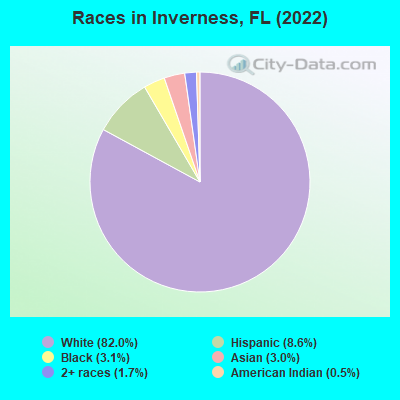
According to 2022 data, the most numerous races in Inverness, FL are White alone (6,528 residents), Hispanic (682 residents), and Black alone (244 residents). 92.8% of Inverness residents speak English at home. 3.8% of Inverness, FL residents are foreign-born (1.5% born in Latin America, 1.3% born in Asia, 0.5% born in North America, 0.5% born in Europe), which is 450.0% less than the foreign-born rate of 21.0% across the entire state of Florida.
Race distribution in Inverness
2000
2022

- 6,01188.5%White alone
- 3465.1%Black alone
- 3004.4%Hispanic
- 620.9%Two or more races
- 370.5%Asian alone
- 220.3%American Indian alone
- 70.1%Other race alone
- 40.06%Native Hawaiian and Other
Pacific Islander alone

-
- 6,52882.0%White alone
- 6828.6%Hispanic
- 2443.1%Black alone
- 2413.0%Asian alone
- 1361.7%Two or more races
- 430.5%American Indian alone
2000
2022
-
- 10,458,50965.4%White alone
- 2,682,71516.8%Hispanic
- 2,264,26814.2%Black alone
- 261,6931.6%Asian alone
- 236,9541.5%Two or more races
- 42,3580.3%American Indian alone
- 28,9940.2%Other race alone
- 6,8870.04%Native Hawaiian and Other
Pacific Islander alone

-
- 11,309,40350.8%White alone
- 6,025,03927.1%Hispanic
- 3,241,01514.6%Black alone
- 861,6303.9%Two or more races
- 623,6922.8%Asian alone
- 152,0540.7%Other race alone
- 22,5040.1%American Indian alone
- 9,4860.04%Native Hawaiian and Other
Pacific Islander alone

Income and house value in Inverness
- Median household income in 2022
- $42,808White non-Hispanic householders
- $29,173Black householders
- $34,493Hispanic or Latino race householders
- Median 2022 house value
- $198,276White Non-Hispanic householders
- $264,747Black or African American householders
- $156,235American Indian or Alaska Native householders
- $106,524Some other race householders
- $275,258Two or more races householders
- $182,937Hispanic or Latino householders
Household income for White non-Hispanic householders

Household income for Black householders

Household income for Asian householders

Household income for Two or more races householders

Household income for Hispanic or Latino race householders

Median age by race in Inverness
- 58.5Median age for White residents
- 56.7Males
- 60.4Females
- 52.8Median age for Black or African American residents
- 44.6Males
- 74.5Females
- -598,566,307.6Median age for American Indian / Alaska Native residents
- -611,418,047.3Males
- -594,925,633.7Females
- 37.2Median age for Asian residents
- 39.6Males
- 37.9Females
- -679,849,340.2Median age for Native Hawaiian / Pacific Islander residents
- -666,666,666.0Males
- -666,666,666.0Females
- -681,775,259.0Median age for Other race residents
- -682,080,924.2Males
- -685,185,184.5Females
- 59.0Median age for Two or more races residents
- 31.6Males
- 81.4Females
- 60.7Median age for White alone residents
- 57.7Males
- 61.9Females
- 32.6Median age for Hispanic or Latino residents
- 33.9Males
- 27.4Females
Owner/renter occupied households by race in Inverness
- House owners and renters - White residents
- 2,54775.5%Owner occupied
- 82824.5%Renter occupied
- House owners and renters - Black or African American residents
- 5642.6%Owner occupied
- 7657.4%Renter occupied
- House owners and renters - American Indian / Alaska Native residents
- 26100.0%Renter occupied
- House owners and renters - Asian residents
- 2621.7%Owner occupied
- 9578.3%Renter occupied
- House owners and renters - Other race residents
- 17100.0%Renter occupied
- House owners and renters - Two or more races residents
- 11047.1%Owner occupied
- 12452.9%Renter occupied
- House owners and renters - White alone residents
- 2,48976.2%Owner occupied
- 77623.8%Renter occupied
- House owners and renters - Hispanic or Latino residents
- 11546.4%Owner occupied
- 13353.6%Renter occupied
Language usage in Inverness
- English speakers - Total
- 92.8% of residents of Inverness speak English at home.
- 3.3% of residents speak Spanish at home
- 24397.2%Speak English very well
- 72.8%Speak English less than very well
- 3.5% of residents speak other language at home
- 23687.4%Speak English very well
- 3412.6%Speak English less than very well
- English speakers - Born in the United States
- 96.4% of residents of Inverness speak English at home.
- 2.9% of residents speak Spanish at home
- 12898.5%Speak English very well
- 21.5%Speak English less than very well
- 0.9% of residents speak other language at home
- 3076.9%Speak English very well
- 923.1%Speak English less than very well
- English speakers - Native, born elsewhere
- 81.4% of residents of Inverness speak English at home.
- 11.6% of residents speak Spanish at home
- 25100.0%Speak English very well
- 5.1% of residents speak other language at home
- 11100.0%Speak English less than very well
- English speakers - Foreign-born
- 37.0% of residents of Inverness speak English at home.
- 18.3% of residents speak Spanish at home
- 4497.8%Speak English very well
- 12.2%Speak English less than very well
- 43.1% of residents speak other language at home
- 8883.0%Speak English very well
- 1817.0%Speak English less than very well
White (Caucasian) - Speak only English
| Native: | 95.1% (6,327) |
| Foreign-born: | 35.1% (19) |
White (Caucasian) - Speak another language
| Native: | 3.9% (257) |
| Foreign-born: | 46.1% (25) |
Black or African American - Speak only English
| Native: | 99.0% (238) |
| Foreign-born: | 50.4% (13) |
Black or African American - Speak another language
| Native: | 0.8% (2) |
| Foreign-born: | 49.1% (13) |
American Indian / Alaska Native - Speak only English
| Native: | 77.0% (17) |
| Foreign-born: | 61.4% (9) |
Asian - Speak only English
| Native: | 100.0% (155) |
| Foreign-born: | 47.6% (72) |
Two or more races - Speak another language
| Native: | 4.6% (10) |
| Foreign-born: | 100.0% (26) |
White alone - Speak only English
| Native: | 97.2% (6,148) |
| Foreign-born: | 44.4% (19) |
White alone - Speak another language
| Native: | 2.3% (147) |
| Foreign-born: | 99.3% (44) |
Hispanic or Latino - Speak another language
| Native: | 39.4% (221) |
| Foreign-born: | 100.0% (45) |
Foreign-born residents in Inverness
304 residents are foreign born (1.5% Latin America, 1.3% Asia, 0.5% North America, 0.5% Europe).
| This city: | 3.8% |
| Florida: | 21.1% |


Marital status for residents in Inverness
Marital status - White (Caucasian) population 15 years and over
- Males
- 27.3%Never married
- 41.8%Now married
- 1.2%Separated
- 5.1%Widowed
- 24.6%Divorced
- Females
- 16.3%Never married
- 34.0%Now married
- 0.5%Separated
- 23.7%Widowed
- 25.5%Divorced
Women who gave birth in the past 12 months
| Now married: | 93.0% (123) |
| Unmarried: | 7.0% (9) |
Women who did not give birth in the past 12 months
| Now married: | 28.5% (297) |
| Unmarried: | 71.5% (745) |
Marital status - Black or African American population 15 years and over
- Males
- 67.5%Never married
- 12.7%Now married
- 9.0%Separated
- 0.0%Widowed
- 10.8%Divorced
- Females
- 23.3%Never married
- 12.3%Now married
- 0.0%Separated
- 23.3%Widowed
- 41.1%Divorced
Women who did not give birth in the past 12 months
| Now married: | 0.0% (0) |
| Unmarried: | 100.0% (5) |
Marital status - American Indian / Alaska Native population 15 years and over
- Males
- 0.0%Never married
- 100.0%Now married
- 0.0%Separated
- 0.0%Widowed
- 0.0%Divorced
- Females
- 0.0%Never married
- 0.0%Now married
- 0.0%Separated
- 100.0%Widowed
- 0.0%Divorced
Marital status - Asian population 15 years and over
- Males
- 40.9%Never married
- 46.6%Now married
- 0.0%Separated
- 12.5%Widowed
- 0.0%Divorced
- Females
- 26.9%Never married
- 73.1%Now married
- 0.0%Separated
- 0.0%Widowed
- 0.0%Divorced
Women who did not give birth in the past 12 months
| Now married: | 49.1% (28) |
| Unmarried: | 50.9% (29) |
Marital status - Two or more races population 15 years and over
- Males
- 0.0%Never married
- 90.2%Now married
- 0.0%Separated
- 9.8%Widowed
- 0.0%Divorced
- Females
- 16.1%Never married
- 0.0%Now married
- 0.0%Separated
- 16.1%Widowed
- 67.8%Divorced
Marital status - White alone, not Hispanic / Latino population 15 years and over
- Males
- 28.3%Never married
- 41.2%Now married
- 1.3%Separated
- 5.5%Widowed
- 23.8%Divorced
- Females
- 14.6%Never married
- 33.1%Now married
- 0.5%Separated
- 24.9%Widowed
- 26.8%Divorced
Women who gave birth in the past 12 months
| Now married: | 91.0% (95) |
| Unmarried: | 9.0% (9) |
Women who did not give birth in the past 12 months
| Now married: | 31.1% (300) |
| Unmarried: | 68.9% (666) |
Marital status - Hispanic or Latino population 15 years and over
- Males
- 12.5%Never married
- 48.3%Now married
- 0.0%Separated
- 3.8%Widowed
- 35.4%Divorced
- Females
- 44.8%Never married
- 43.3%Now married
- 0.0%Separated
- 0.0%Widowed
- 11.9%Divorced
Women who gave birth in the past 12 months
| Now married: | 100.0% (30) |
| Unmarried: | 0.0% (0) |
Women who did not give birth in the past 12 months
| Now married: | 0.0% (0) |
| Unmarried: | 100.0% (88) |
Ancestries in Inverness

- 98322.2%American
- 57212.9%Italian
- 57012.9%English
- 3608.1%German
- 2625.9%Irish
- 1282.9%Scottish
- 1002.3%European
- 641.4%Welsh
- 611.4%Polish
- 431.0%Danish
- 431.0%Russian
- 360.8%French Canadian
- 300.7%Greek
- 290.7%Canadian
- 280.6%Hungarian
- 230.5%Serbian
- 180.4%Norwegian
- 160.4%Dutch
- 160.4%Barbadian
- 150.3%Haitian
- 120.3%Romanian
- 100.2%Eastern European
- 60.1%French
- 20.05%Finnish

Geographical mobility in Inverness

- Same house 1 year ago
- 5,70883.4%White (Caucasian)
- 27494.4%Black or African American
- 38100.0%American Indian / Alaska Native
- 310100.0%Asian
- 11100.0%Other race
- 18978.2%Two or more races
- 5,43783.6%White alone, not Hispanic / Latino
- 52282.8%Hispanic or Latino

-
- Moved within same county
- 4396.4%White / Caucasian
- 165.5%Black or African American
- 6326.2%Two or more races
- 3936.0%White alone, not Hispanic / Latino
- 589.2%Hispanic or Latino

-
- Moved within same state
- 5588.2%White / Caucasian
- 20.7%Black or African American
- 5338.2%White alone, not Hispanic / Latino

-
- Moved from different state
- 1311.9%White / Caucasian
- 1131.7%White alone, not Hispanic / Latino
- 264.1%Hispanic or Latino

-
- Moved from abroad
- 390.6%White
- 520.8%White alone, not Hispanic / Latino

Children Nativity (place of birth) in Inverness
Place of birth for residents in Inverness
![Place of birth for the foreign-born population - Regions]()
- 160Americas
- 120Latin America
- 107Asia
- 95South Eastern Asia
- 57South America
- 40Northern America
- 37Caribbean
- 36Europe
- 24Central America
- 22Eastern Europe
- 14Southern Europe
- 11South Central Asia

![Place of birth for the foreign-born population - Countries]()
- 95Philippines
- 44Guyana
- 40Canada
- 24Nicaragua
- 14Greece
- 13Barbados
- 13Ecuador
- 12Haiti
- 11India
- 11Cuba
