Races in Inver Grove Heights, Minnesota (MN) Detailed Stats
Data:
Races - White alone (%)
Races - White alone (% change since 2000)
Races - Black alone (%)
Races - Black alone (% change since 2000)
Races - American Indian alone (%)
Races - American Indian alone (% change since 2000)
Races - Asian alone (%)
Races - Asian alone (% change since 2000)
Races - Hispanic (%)
Races - Hispanic (% change since 2000)
Races - Native Hawaiian and Other Pacific Islander alone (%)
Races - Native Hawaiian and Other Pacific Islander alone (% change since 2000)
Races - Two or more races(%)
Races - Two or more races(% change since 2000)
Races - Other race alone (%)
Races - Other race alone (% change since 2000)
Racial diversity
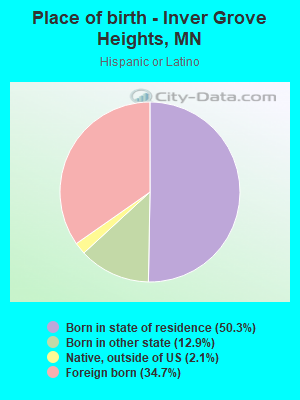
Place of birth - Born in state of residence (%)
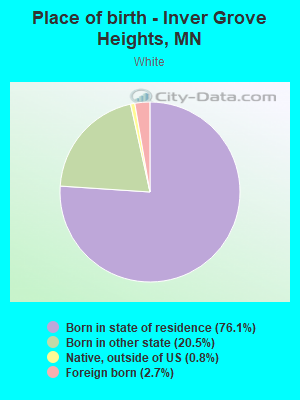
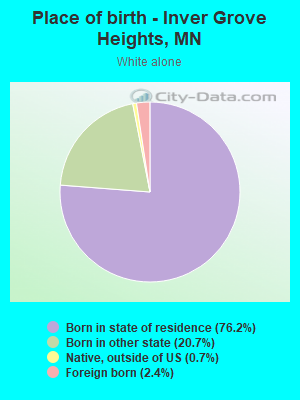
Place of birth - Born in state of residence (%) - White
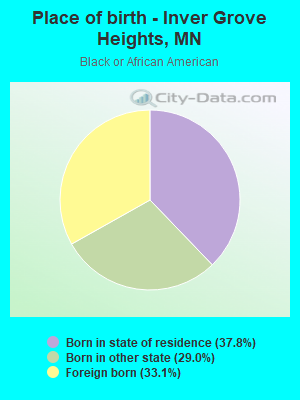
Place of birth - Born in state of residence (%) - Black or African American
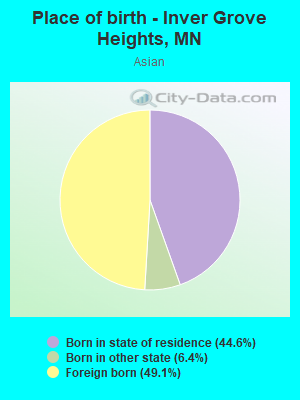
Place of birth - Born in state of residence (%) - Asian
Place of birth - Born in state of residence (%) - Hispanic or Latino
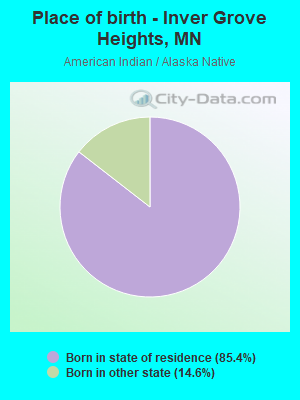
Place of birth - Born in state of residence (%) - American Indian and Alaska Native
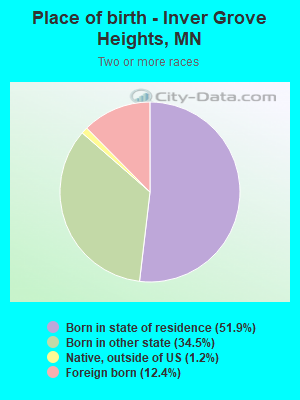
Place of birth - Born in state of residence (%) - Multirace
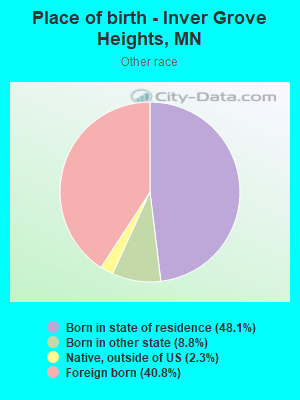
Place of birth - Born in state of residence (%) - Other Race
Place of birth - Born in other state (%)
Place of birth - Born in other state (%) - White
Place of birth - Born in other state (%) - Black or African American
Place of birth - Born in other state (%) - Asian
Place of birth - Born in other state (%) - Hispanic or Latino
Place of birth - Born in other state (%) - American Indian and Alaska Native
Place of birth - Born in other state (%) - Multirace
Place of birth - Born in other state (%) - Other Race
Place of birth - Native, outside of US (%)
Place of birth - Native, outside of US (%) - White
Place of birth - Native, outside of US (%) - Black or African American
Place of birth - Native, outside of US (%) - Asian
Place of birth - Native, outside of US (%) - Hispanic or Latino
Place of birth - Native, outside of US (%) - American Indian and Alaska Native
Place of birth - Native, outside of US (%) - Multirace
Place of birth - Native, outside of US (%) - Other Race
Place of birth - Foreign born (%)
Place of birth - Foreign born (%) - White
Place of birth - Foreign born (%) - Black or African American
Place of birth - Foreign born (%) - Asian
Place of birth - Foreign born (%) - Hispanic or Latino
Place of birth - Foreign born (%) - American Indian and Alaska Native
Place of birth - Foreign born (%) - Multirace
Place of birth - Foreign born (%) - Other Race
Residents speaking English at home (%)
Residents speaking English at home - Born in the United States (%)
Residents speaking English at home - Native, born elsewhere (%)
Residents speaking English at home - Foreign born (%)
Residents speaking Spanish at home (%)
Residents speaking Spanish at home - Born in the United States (%)
Residents speaking Spanish at home - Native, born elsewhere (%)
Residents speaking Spanish at home - Foreign born (%)
Residents speaking other language at home (%)
Residents speaking other language at home - Born in the United States (%)
Residents speaking other language at home - Native, born elsewhere (%)
Residents speaking other language at home - Foreign born (%)
Marital status - Never married (%)
Marital status - Now married (%)
Marital status - Separated (%)
Marital status - Widowed (%)
Marital status - Divorced (%)
Ancestries Reported - Arab (%)
Ancestries Reported - Czech (%)
Ancestries Reported - Danish (%)
Ancestries Reported - Dutch (%)
Ancestries Reported - English (%)
Ancestries Reported - French (%)
Ancestries Reported - French Canadian (%)
Ancestries Reported - German (%)
Ancestries Reported - Greek (%)
Ancestries Reported - Hungarian (%)
Ancestries Reported - Irish (%)
Ancestries Reported - Italian (%)
Ancestries Reported - Lithuanian (%)
Ancestries Reported - Norwegian (%)
Ancestries Reported - Polish (%)
Ancestries Reported - Portuguese (%)
Ancestries Reported - Russian (%)
Ancestries Reported - Scotch-Irish (%)
Ancestries Reported - Scottish (%)
Ancestries Reported - Slovak (%)
Ancestries Reported - Subsaharan African (%)
Ancestries Reported - Swedish (%)
Ancestries Reported - Swiss (%)
Ancestries Reported - Ukrainian (%)
Ancestries Reported - United States (%)
Ancestries Reported - Welsh (%)
Ancestries Reported - West Indian (%)
Ancestries Reported - Other (%)
Geographical mobility - Same house 1 year ago (%)
Geographical mobility - Same house 1 year ago (%) - White
Geographical mobility - Same house 1 year ago (%) - Black or African American
Geographical mobility - Same house 1 year ago (%) - Asian
Geographical mobility - Same house 1 year ago (%) - Hispanic or Latino
Geographical mobility - Same house 1 year ago (%) - American Indian and Alaska Native
Geographical mobility - Same house 1 year ago (%) - Multirace
Geographical mobility - Same house 1 year ago (%) - Other Race
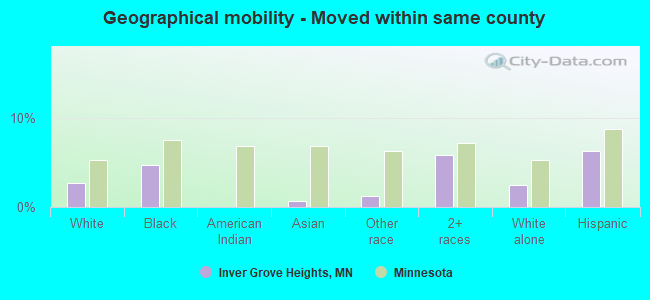
Geographical mobility - Moved within same county (%)
Geographical mobility - Moved within same county (%) - White
Geographical mobility - Moved within same county (%) - Black or African American
Geographical mobility - Moved within same county (%) - Asian
Geographical mobility - Moved within same county (%) - Hispanic or Latino
Geographical mobility - Moved within same county (%) - American Indian and Alaska Native
Geographical mobility - Moved within same county (%) - Multirace
Geographical mobility - Moved within same county (%) - Other Race
Geographical mobility - Moved from different county within same state (%)
Geographical mobility - Moved from different county within same state (%) - White
Geographical mobility - Moved from different county within same state (%) - Black or African American
Geographical mobility - Moved from different county within same state (%) - Asian
Geographical mobility - Moved from different county within same state (%) - Hispanic or Latino
Geographical mobility - Moved from different county within same state (%) - American Indian and Alaska Native
Geographical mobility - Moved from different county within same state (%) - Multirace
Geographical mobility - Moved from different county within same state (%) - Other Race
Geographical mobility - Moved from different state (%)
Geographical mobility - Moved from different state (%) - White
Geographical mobility - Moved from different state (%) - Black or African American
Geographical mobility - Moved from different state (%) - Asian
Geographical mobility - Moved from different state (%) - Hispanic or Latino
Geographical mobility - Moved from different state (%) - American Indian and Alaska Native
Geographical mobility - Moved from different state (%) - Multirace
Geographical mobility - Moved from different state (%) - Other Race
Geographical mobility - Moved from abroad (%)
Geographical mobility - Moved from abroad (%) - White
Geographical mobility - Moved from abroad (%) - Black or African American
Geographical mobility - Moved from abroad (%) - Asian
Geographical mobility - Moved from abroad (%) - Hispanic or Latino
Geographical mobility - Moved from abroad (%) - American Indian and Alaska Native
Geographical mobility - Moved from abroad (%) - Multirace
Geographical mobility - Moved from abroad (%) - Other Race
Place of birth for the foreign-born population - Ireland (%)
Place of birth for the foreign-born population - Denmark (%)
Place of birth for the foreign-born population - Norway (%)
Place of birth for the foreign-born population - Sweden (%)
Place of birth for the foreign-born population - United Kingdom (%)
Place of birth for the foreign-born population - England (%)
Place of birth for the foreign-born population - Scotland (%)
Place of birth for the foreign-born population - Other Northern Europe (%)
Place of birth for the foreign-born population - Austria (%)
Place of birth for the foreign-born population - Belgium (%)
Place of birth for the foreign-born population - France (%)
Place of birth for the foreign-born population - Germany (%)
Place of birth for the foreign-born population - Netherlands (%)
Place of birth for the foreign-born population - Switzerland (%)
Place of birth for the foreign-born population - Other Western Europe (%)
Place of birth for the foreign-born population - Greece (%)
Place of birth for the foreign-born population - Italy (%)
Place of birth for the foreign-born population - Portugal (%)
Place of birth for the foreign-born population - Spain (%)
Place of birth for the foreign-born population - Other Southern Europe (%)
Place of birth for the foreign-born population - Albania (%)
Place of birth for the foreign-born population - Belarus (%)
Place of birth for the foreign-born population - Bosnia and Herzegovina (%)
Place of birth for the foreign-born population - Bulgaria (%)
Place of birth for the foreign-born population - Croatia (%)
Place of birth for the foreign-born population - Czechoslovakia (%)
Place of birth for the foreign-born population - Hungary (%)
Place of birth for the foreign-born population - Latvia (%)
Place of birth for the foreign-born population - Lithuania (%)
Place of birth for the foreign-born population - North Macedonia (Macedonia) (%)
Place of birth for the foreign-born population - Moldova (%)
Place of birth for the foreign-born population - Poland (%)
Place of birth for the foreign-born population - Romania (%)
Place of birth for the foreign-born population - Russia (%)
Place of birth for the foreign-born population - Serbia (%)
Place of birth for the foreign-born population - Ukraine (%)
Place of birth for the foreign-born population - Other Eastern Europe (%)
Place of birth for the foreign-born population - China (%)
Place of birth for the foreign-born population - Hong Kong (%)
Place of birth for the foreign-born population - Taiwan (%)
Place of birth for the foreign-born population - Japan (%)
Place of birth for the foreign-born population - Korea (%)
Place of birth for the foreign-born population - Other Eastern Asia (%)
Place of birth for the foreign-born population - Afghanistan (%)
Place of birth for the foreign-born population - Bangladesh (%)
Place of birth for the foreign-born population - India (%)
Place of birth for the foreign-born population - Iran (%)
Place of birth for the foreign-born population - Kazakhstan (%)
Place of birth for the foreign-born population - Nepal (%)
Place of birth for the foreign-born population - Pakistan (%)
Place of birth for the foreign-born population - Sri Lanka (%)
Place of birth for the foreign-born population - Uzbekistan (%)
Place of birth for the foreign-born population - Other South Central Asia (%)
Place of birth for the foreign-born population - Burma (%)
Place of birth for the foreign-born population - Cambodia (%)
Place of birth for the foreign-born population - Indonesia (%)
Place of birth for the foreign-born population - Laos (%)
Place of birth for the foreign-born population - Malaysia (%)
Place of birth for the foreign-born population - Philippines (%)
Place of birth for the foreign-born population - Singapore (%)
Place of birth for the foreign-born population - Thailand (%)
Place of birth for the foreign-born population - Vietnam (%)
Place of birth for the foreign-born population - Other South Eastern Asia (%)
Place of birth for the foreign-born population - Armenia (%)
Place of birth for the foreign-born population - Iraq (%)
Place of birth for the foreign-born population - Israel (%)
Place of birth for the foreign-born population - Jordan (%)
Place of birth for the foreign-born population - Kuwait (%)
Place of birth for the foreign-born population - Lebanon (%)
Place of birth for the foreign-born population - Saudi Arabia (%)
Place of birth for the foreign-born population - Syria (%)
Place of birth for the foreign-born population - Turkey (%)
Place of birth for the foreign-born population - Yemen (%)
Place of birth for the foreign-born population - Other Western Asia (%)
Place of birth for the foreign-born population - Eritrea (%)
Place of birth for the foreign-born population - Ethiopia (%)
Place of birth for the foreign-born population - Kenya (%)
Place of birth for the foreign-born population - Somalia (%)
Place of birth for the foreign-born population - Uganda (%)
Place of birth for the foreign-born population - Zimbabwe (%)
Place of birth for the foreign-born population - Other Eastern Africa (%)
Place of birth for the foreign-born population - Cameroon (%)
Place of birth for the foreign-born population - Congo (%)
Place of birth for the foreign-born population - Democratic Republic of Congo (Zaire) (%)
Place of birth for the foreign-born population - Other Middle Africa (%)
Place of birth for the foreign-born population - Egypt (%)
Place of birth for the foreign-born population - Morocco (%)
Place of birth for the foreign-born population - Sudan (%)
Place of birth for the foreign-born population - Other Northern Africa (%)
Place of birth for the foreign-born population - South Africa (%)
Place of birth for the foreign-born population - Other Southern Africa (%)
Place of birth for the foreign-born population - Cabo Verde (%)
Place of birth for the foreign-born population - Ghana (%)
Place of birth for the foreign-born population - Liberia (%)
Place of birth for the foreign-born population - Nigeria (%)
Place of birth for the foreign-born population - Senegal (%)
Place of birth for the foreign-born population - Sierra Leone (%)
Place of birth for the foreign-born population - Other Western Africa (%)
Place of birth for the foreign-born population - Australia (%)
Place of birth for the foreign-born population - New Zealand (%)
Place of birth for the foreign-born population - Fiji (%)
Place of birth for the foreign-born population - Micronesia (%)
Place of birth for the foreign-born population - Bahamas (%)
Place of birth for the foreign-born population - Barbados (%)
Place of birth for the foreign-born population - Cuba (%)
Place of birth for the foreign-born population - Dominica (%)
Place of birth for the foreign-born population - Dominican Republic (%)
Place of birth for the foreign-born population - Grenada (%)
Place of birth for the foreign-born population - Haiti (%)
Place of birth for the foreign-born population - Jamaica (%)
Place of birth for the foreign-born population - St. Vincent and the Grenadines (%)
Place of birth for the foreign-born population - Trinidad and Tobago (%)
Place of birth for the foreign-born population - West Indies (%)
Place of birth for the foreign-born population - Other Caribbean (%)
Place of birth for the foreign-born population - Belize (%)
Place of birth for the foreign-born population - Costa Rica (%)
Place of birth for the foreign-born population - El Salvador (%)
Place of birth for the foreign-born population - Guatemala (%)
Place of birth for the foreign-born population - Honduras (%)
Place of birth for the foreign-born population - Mexico (%)
Place of birth for the foreign-born population - Nicaragua (%)
Place of birth for the foreign-born population - Panama (%)
Place of birth for the foreign-born population - Other Central America (%)
Place of birth for the foreign-born population - Argentina (%)
Place of birth for the foreign-born population - Bolivia (%)
Place of birth for the foreign-born population - Brazil (%)
Place of birth for the foreign-born population - Chile (%)
Place of birth for the foreign-born population - Colombia (%)
Place of birth for the foreign-born population - Ecuador (%)
Place of birth for the foreign-born population - Guyana (%)
Place of birth for the foreign-born population - Peru (%)
Place of birth for the foreign-born population - Uruguay (%)
Place of birth for the foreign-born population - Venezuela (%)
Place of birth for the foreign-born population - Other South America (%)
Place of birth for the foreign-born population - Canada (%)
Place of birth for the foreign-born population - Other Northern America (%)
Place of birth for the foreign-born population - Other (%)
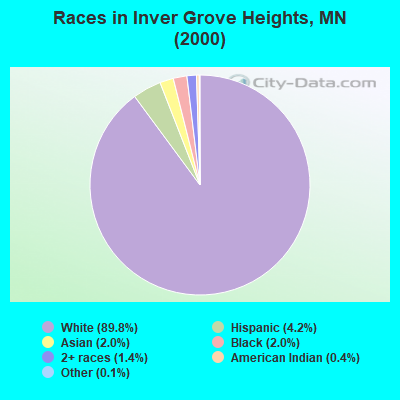
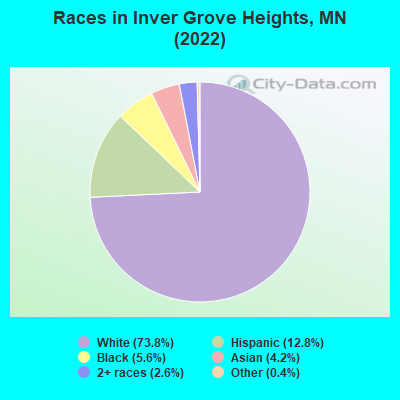
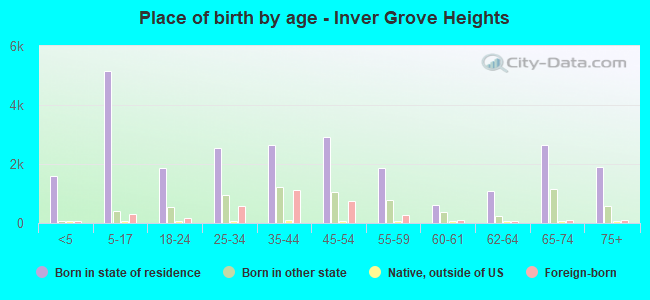
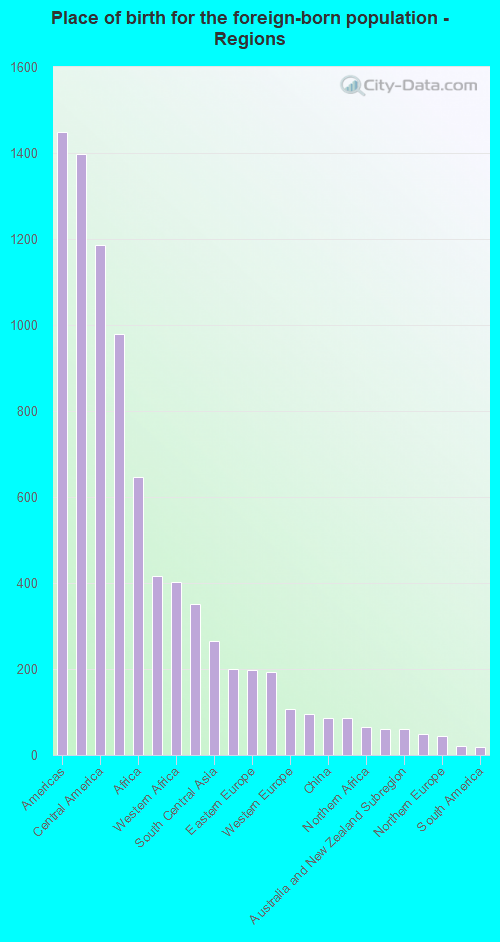
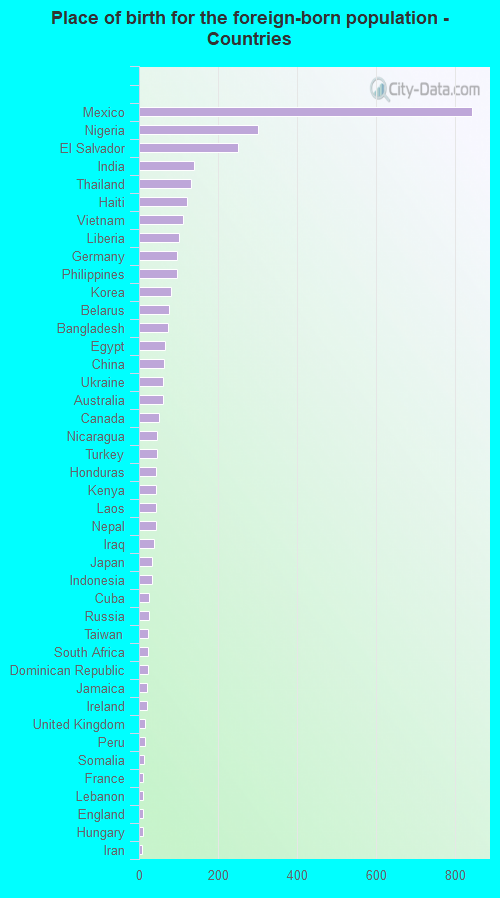
According to 2022 data, the most numerous races in Inver Grove Heights, MN are White alone (26,586 residents), Black alone (2,014 residents), and Hispanic (4,597 residents). 86.6% of Inver Grove Heights residents speak English at home. 9.7% of Inver Grove Heights, MN residents are foreign-born (3.8% born in Latin America, 2.6% born in Asia, 1.7% born in Africa), which is 17.4% greater than the foreign-born rate of 8.0% across the entire state of Minnesota.
Race distribution in Inver Grove Heights
2000 2022
4,337,143 88.2% White alone 168,813 3.4% Black alone 143,382 2.9% Hispanic 141,083 2.9% Asian alone 70,304 1.4% Two or more races 52,009 1.1% American Indian alone 5,031 0.1% Other race alone 1,714 0.03% Native Hawaiian and Other
4,356,347 76.2% White alone 395,179 6.9% Black alone 333,830 5.8% Hispanic 294,800 5.2% Asian alone 259,649 4.5% Two or more races 42,125 0.7% American Indian alone 32,976 0.6% Other race alone 2,278 0.04% Native Hawaiian and Other
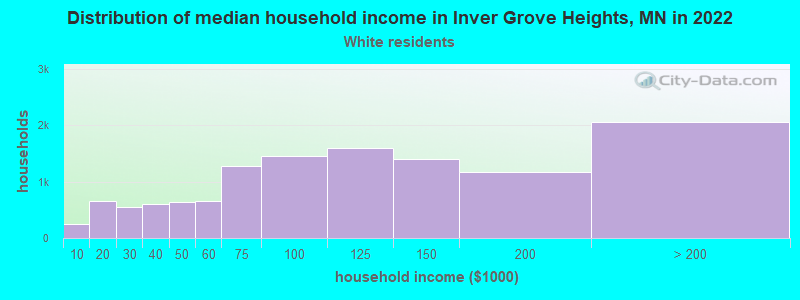
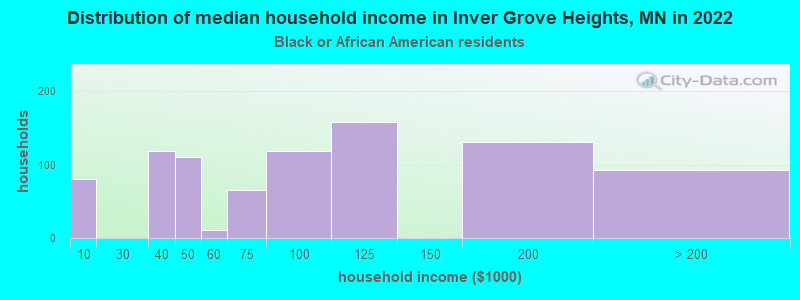
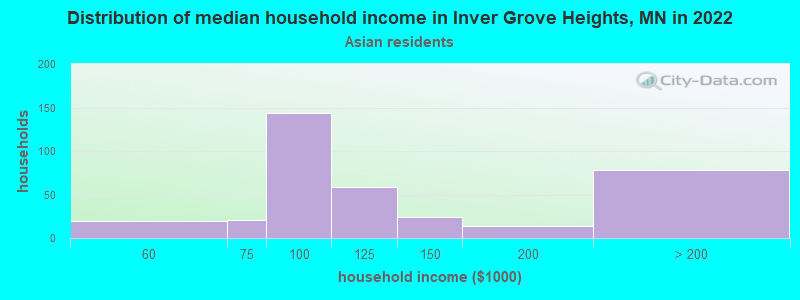
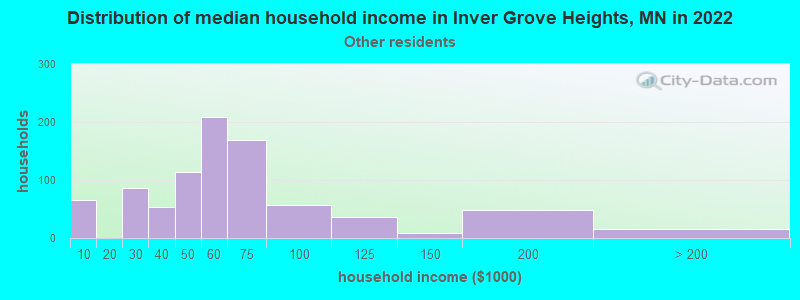
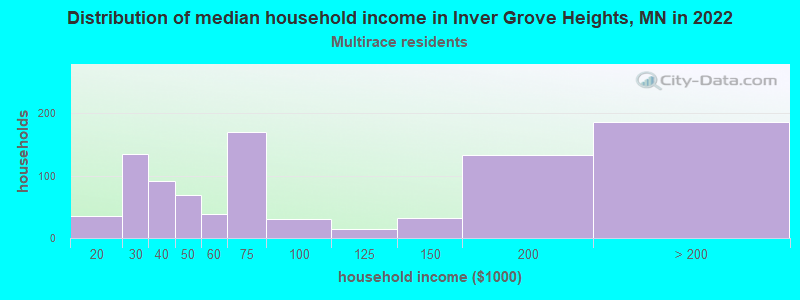
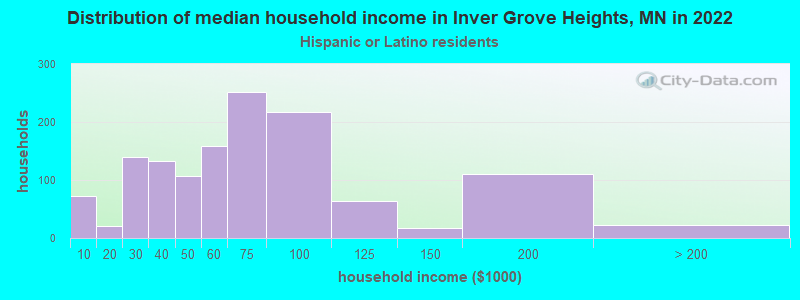
Income and house value in Inver Grove Heights Median household income in 2022 $100,677 White non-Hispanic householders$85,866 Black householders$90,564 Asian householders$66,500 Some other race householders$69,205 Two or more races householders$56,183 Hispanic or Latino race householdersMedian 2022 house value $379,987 White Non-Hispanic householders$348,845 Black or African American householders$359,837 American Indian or Alaska Native householders $596,936 Asian householders$309,590 Some other race householders$438,346 Two or more races householders$284,467 Hispanic or Latino householders
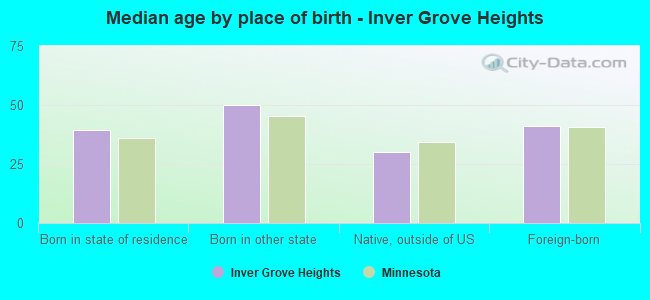
Median age by race in Inver Grove Heights
47.1 Median age for White residents46.7 47.8 31.6 Median age for Black or African American residents35.0 25.4 36.9 Median age for American Indian / Alaska Native residents62.9 36.5 32.1 Median age for Asian residents30.9 32.4 -744,336,568.8 Median age for Native Hawaiian / Pacific Islander residents-856,799,036.4 -534,959,349.1 25.1 Median age for Other race residents23.0 33.2 34.7 Median age for Two or more races residents34.0 39.6 47.9 Median age for White alone residents46.6 49.3 25.4 Median age for Hispanic or Latino residents22.4 26.6
Owner/renter occupied households by race in Inver Grove Heights
House owners and renters - White residents 9,272 75.3% Owner occupied3,048 24.7% Renter occupiedHouse owners and renters - Black or African American residents 253 32.7% Owner occupied522 67.3% Renter occupiedHouse owners and renters - American Indian / Alaska Native residents 5 100.0% Owner occupiedHouse owners and renters - Asian residents 317 75.4% Owner occupied104 24.6% Renter occupiedHouse owners and renters - Other race residents 532 60.6% Owner occupied346 39.4% Renter occupiedHouse owners and renters - Two or more races residents 661 71.0% Owner occupied270 29.0% Renter occupiedHouse owners and renters - White alone residents 9,199 76.0% Owner occupied2,901 24.0% Renter occupiedHouse owners and renters - Hispanic or Latino residents 727 50.5% Owner occupied712 49.5% Renter occupied
Language usage in Inver Grove Heights
English speakers - Total 86.6% of residents of Inver Grove Heights speak English at home.
7.7% of residents speak Spanish at home 1,449 55.0% Speak English very well1,184 45.0% Speak English less than very well5.6% of residents speak other language at home 1,359 70.0% Speak English very well583 30.0% Speak English less than very well
English speakers - Born in the United States 94.7% of residents of Inver Grove Heights speak English at home.
3.0% of residents speak Spanish at home 175 81.8% Speak English very well39 18.2% Speak English less than very well2.0% of residents speak other language at home 147 100.0% Speak English very well
English speakers - Native, born elsewhere 74.2% of residents of Inver Grove Heights speak English at home.
35.1% of residents speak Spanish at home 55 47.0% Speak English very well62 53.0% Speak English less than very well1.8% of residents speak other language at home 6 100.0% Speak English very well
English speakers - Foreign-born 24.7% of residents of Inver Grove Heights speak English at home.
40.1% of residents speak Spanish at home 370 25.8% Speak English very well1,066 74.2% Speak English less than very well38.5% of residents speak other language at home 879 63.8% Speak English very well498 36.2% Speak English less than very well
White (Caucasian) - Speak only English Native:
98.7% (24,808)Foreign-born:
42.8% (311)
White (Caucasian) - Speak another language Native:
1.4% (351)Foreign-born:
56.9% (414)
Black or African American - Speak only English Native:
78.6% (1,041)Foreign-born:
26.4% (173)
Black or African American - Speak another language Native:
22.5% (298)Foreign-born:
73.1% (479)
Asian - Speak only English Native:
91.9% (643)Foreign-born:
31.8% (247)
Asian - Speak another language Native:
16.6% (116)Foreign-born:
68.3% (532)
Other race - Speak only English Native:
27.7% (437)Foreign-born:
3.5% (44)
Other race - Speak another language Native:
73.8% (1,165)Foreign-born:
94.5% (1,195)
Two or more races - Speak only English Native:
95.0% (1,828)Foreign-born:
26.2% (75)
Two or more races - Speak another language Native:
6.1% (117)Foreign-born:
58.6% (168)
White alone - Speak only English Native:
99.1% (24,578)Foreign-born:
43.1% (270)
White alone - Speak another language Native:
1.0% (240)Foreign-born:
56.2% (352)
Hispanic or Latino - Speak only English Native:
53.3% (1,394)Foreign-born:
9.0% (144)
Hispanic or Latino - Speak another language Native:
46.8% (1,224)Foreign-born:
90.5% (1,453)
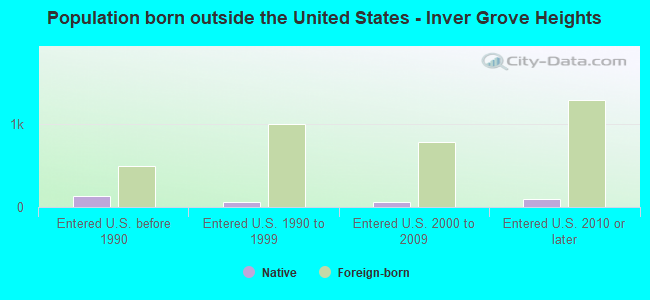
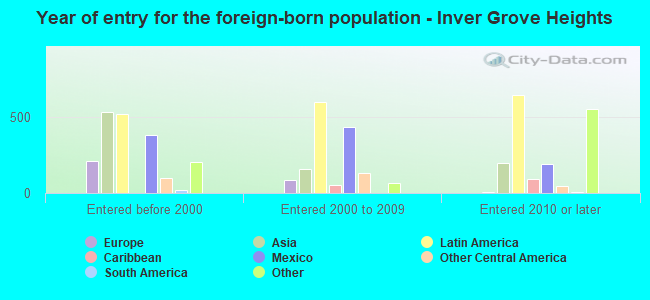
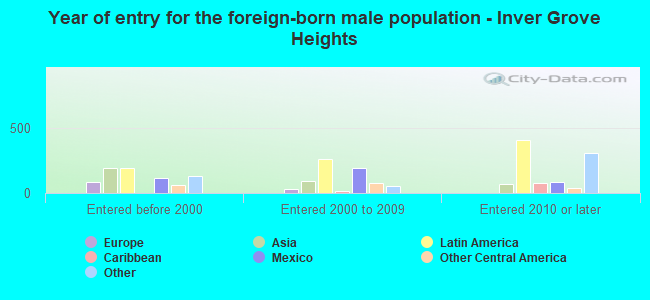
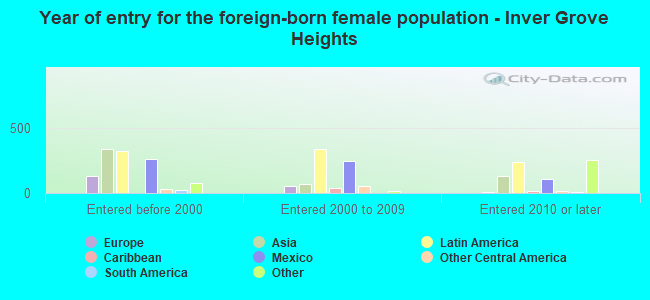
Foreign-born residents in Inver Grove Heights 3,487 residents are foreign born (3.8% Latin America , 2.6% Asia , 1.7% Africa ).
This city:
9.7%Minnesota:
8.5%
Marital status for residents in Inver Grove Heights Marital status - White (Caucasian) population 15 years and over
Males 30.0% Never married58.7% Now married0.1% Separated1.6% Widowed9.6% DivorcedFemales 24.7% Never married53.8% Now married0.7% Separated6.0% Widowed14.8% DivorcedWomen who gave birth in the past 12 months Now married:
74.6% (220)Unmarried:
25.4% (75)
Women who did not give birth in the past 12 months Now married:
45.5% (2,295)Unmarried:
54.5% (2,755)
Marital status - Black or African American population 15 years and over
Males 29.1% Never married56.3% Now married0.0% Separated0.0% Widowed14.6% DivorcedFemales 58.0% Never married25.2% Now married0.0% Separated7.3% Widowed9.5% DivorcedWomen who did not give birth in the past 12 months Now married:
26.9% (171)Unmarried:
73.1% (464)
Marital status - American Indian / Alaska Native population 15 years and over
Males 18.2% Never married81.8% Now married0.0% Separated0.0% Widowed0.0% DivorcedFemales 10.3% Never married13.8% Now married0.0% Separated0.0% Widowed75.9% DivorcedWomen who did not give birth in the past 12 months Now married:
0.0% (0)Unmarried:
100.0% (26)
Marital status - Asian population 15 years and over
Males 39.5% Never married54.3% Now married0.0% Separated0.0% Widowed6.2% DivorcedFemales 43.4% Never married51.9% Now married3.7% Separated1.0% Widowed0.0% DivorcedWomen who gave birth in the past 12 months Now married:
100.0% (17)Unmarried:
0.0% (0)
Women who did not give birth in the past 12 months Now married:
50.8% (289)Unmarried:
49.2% (281)
Marital status - Other race population 15 years and over
Males 30.4% Never married62.6% Now married4.9% Separated0.0% Widowed2.2% DivorcedFemales 40.4% Never married41.3% Now married6.9% Separated0.0% Widowed11.4% DivorcedWomen who gave birth in the past 12 months Now married:
100.0% (16)Unmarried:
0.0% (0)
Women who did not give birth in the past 12 months Now married:
43.5% (407)Unmarried:
56.5% (527)
Marital status - Two or more races population 15 years and over
Males 40.3% Never married54.7% Now married0.0% Separated0.0% Widowed5.0% DivorcedFemales 48.1% Never married47.1% Now married0.0% Separated3.1% Widowed1.7% DivorcedWomen who gave birth in the past 12 months Now married:
0.0% (0)Unmarried:
100.0% (36)
Women who did not give birth in the past 12 months Now married:
36.1% (226)Unmarried:
63.9% (399)
Marital status - White alone, not Hispanic / Latino population 15 years and over
Males 30.1% Never married58.7% Now married0.1% Separated1.6% Widowed9.6% DivorcedFemales 23.5% Never married54.3% Now married0.8% Separated6.2% Widowed15.2% DivorcedWomen who gave birth in the past 12 months Now married:
95.4% (220)Unmarried:
4.6% (11)
Women who did not give birth in the past 12 months Now married:
45.4% (2,216)Unmarried:
54.6% (2,661)
Marital status - Hispanic or Latino population 15 years and over
Males 30.8% Never married60.5% Now married3.1% Separated0.0% Widowed5.6% DivorcedFemales 46.0% Never married42.7% Now married3.4% Separated0.0% Widowed7.9% DivorcedWomen who gave birth in the past 12 months Now married:
15.7% (19)Unmarried:
84.3% (102)
Women who did not give birth in the past 12 months Now married:
41.7% (534)Unmarried:
58.3% (746)
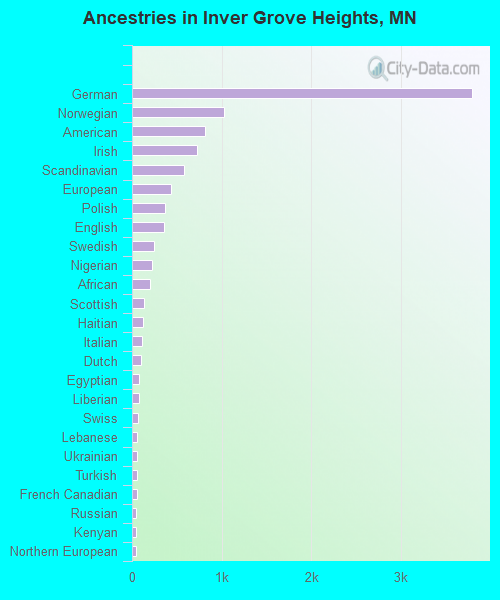
Ancestries in Inver Grove Heights
3,793 24.2% German1,030 6.6% Norwegian811 5.2% American723 4.6% Irish576 3.7% Scandinavian437 2.8% European371 2.4% Polish354 2.3% English242 1.5% Swedish225 1.4% Nigerian200 1.3% African132 0.8% Scottish126 0.8% Haitian111 0.7% Italian98 0.6% Dutch82 0.5% Egyptian81 0.5% Liberian65 0.4% Swiss61 0.4% Lebanese61 0.4% Ukrainian58 0.4% Turkish53 0.3% French Canadian47 0.3% Russian47 0.3% Kenyan45 0.3% Northern European42 0.3% Danish32 0.2% Greek31 0.2% Austrian28 0.2% French27 0.2% Czech25 0.2% Scotch-Irish25 0.2% Finnish23 0.1% British23 0.1% Eastern European21 0.1% Somali17 0.1% Slavic17 0.1% Welsh13 0.08% Jamaican12 0.08% Romanian11 0.07% Belgian10 0.06% Hungarian9 0.06% Slovene3 0.02% Sudanese
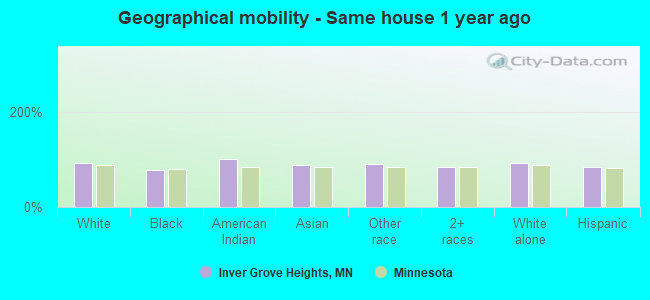
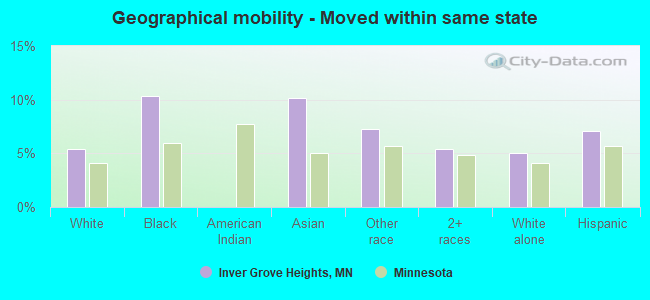
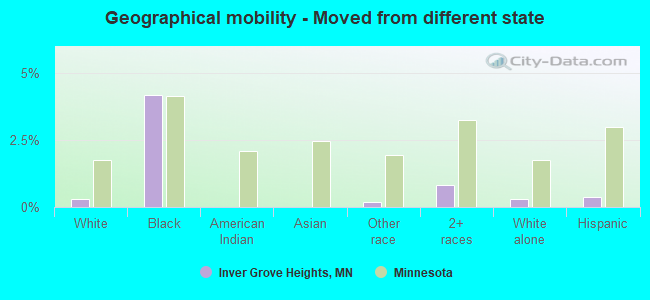
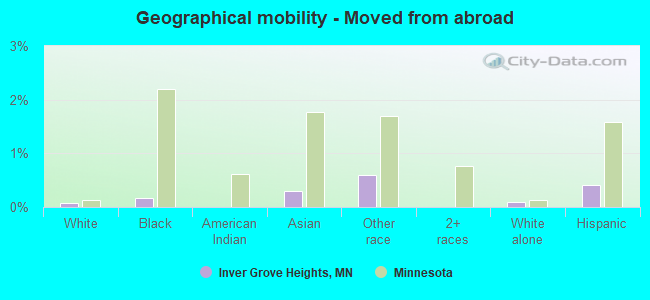
Geographical mobility in Inver Grove Heights Same house 1 year ago 24,814 92.0% White (Caucasian)1,562 78.4% Black or African American43 100.0% American Indian / Alaska Native1,322 87.6% Asian2,879 91.2% Other race1,881 84.1% Two or more races24,485 92.5% White alone, not Hispanic / Latino3,799 83.1% Hispanic or LatinoMoved within same county 712 2.6% White / Caucasian94 4.7% Black or African American9 0.6% Asian39 1.2% Other race131 5.9% Two or more races642 2.4% White alone, not Hispanic / Latino288 6.3% Hispanic or LatinoMoved within same state 1,449 5.4% White / Caucasian205 10.3% Black or African American153 10.2% Asian230 7.3% Other race122 5.4% Two or more races1,336 5.1% White alone, not Hispanic / Latino323 7.1% Hispanic or LatinoMoved from different state 84 0.3% White / Caucasian83 4.2% Black or African American6 0.2% Other race18 0.8% Two or more races78 0.3% White alone, not Hispanic / Latino17 0.4% Hispanic or LatinoMoved from abroad 21 0.1% White4 0.2% Black or African American4 0.3% Asian19 0.6% Other race24 0.1% White alone, not Hispanic / Latino19 0.4% Hispanic or Latino
Children Nativity (place of birth) in Inver Grove Heights
Children under 6 years - Living with two parents Both parents native 1,467 100.0% NativeBoth parents foreign-born 180 91.0% Native18 9.0% Foreign-bornOne native, one foreign-born parent 109 100.0% NativeChildren under 6 years - Living with one parent Native parent 235 100.0% NativeForeign-born parent 54 100.0% NativeChildren 6 to 17 years - Living with two parents Both parents native 2,881 100.0% NativeBoth parents foreign-born 541 67.5% Native261 32.5% Foreign-bornOne native, one foreign-born parent 341 100.0% NativeChildren 6 to 17 years - Living with one parent Native parent 931 100.0% NativeForeign-born parent 436 48.3% Native468 51.7% Foreign-born
Grandparents responsible for own grandchildren in Inver Grove Heights
Grandparents (30 to 59 years) White / Caucasian 19 32.0% Responsible for grandchildren40 68.0% Not responsible for grandchildrenAsian 8 100.0% Not responsible for grandchildrenOther race 8 100.0% Not responsible for grandchildrenWhite alone, not Hispanic / Latino 20 37.8% Responsible for grandchildren32 62.2% Not responsible for grandchildrenHispanic or Latino 17 100.0% Not responsible for grandchildrenGrandparents (60 years and over) White / Caucasian 123 59.8% Responsible for grandchildren83 40.2% Not responsible for grandchildrenAsian 23 100.0% Not responsible for grandchildrenOther race 47 100.0% Responsible for grandchildrenWhite alone, not Hispanic / Latino 123 59.0% Responsible for grandchildren85 41.0% Not responsible for grandchildrenHispanic or Latino 18 100.0% Responsible for grandchildren