Races in Indian River Estates, Florida (FL) Detailed Stats
Ancestries, Foreign-born residents, place of birth
Settings
X


Recent posts about races in Indian River Estates, Florida on our local forum with over 2,400,000 registered users:
 | Indian River Estates, Ft. Pierce Good or Bad (10 replies) |
| Recommendations for HOA communities in Vero Beach (12 replies) |
| Housing trends in Vero Beach (15 replies) |
| How is the rental market in White City (3 replies) |
| port st lucie home have they hit rock bottom? (32 replies) |
| Ft. Pierce... (14 replies) |
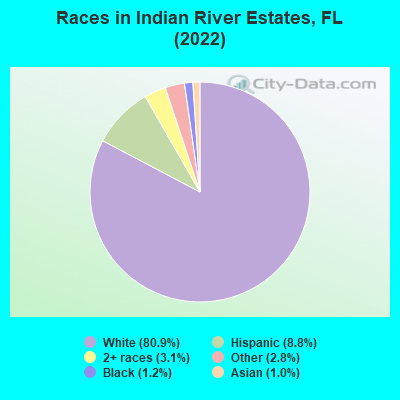
According to 2022 data, the most numerous races in Indian River Estates, FL are White alone (6,041 residents), Hispanic (656 residents), and Black alone (86 residents). 89.0% of Indian River Estates residents speak English at home. 8.4% of Indian River Estates, FL residents are foreign-born (2.7% born in Latin America, 2.6% born in North America, 1.8% born in Europe, 1.2% born in Asia), which is 150.0% less than the foreign-born rate of 21.0% across the entire state of Florida.
Race distribution in Indian River Estates
2000
2022

- 5,36192.5%White alone
- 2053.5%Hispanic
- 1342.3%Black alone
- 530.9%Two or more races
- 270.5%Asian alone
- 70.1%American Indian alone
- 40.07%Native Hawaiian and Other
Pacific Islander alone - 20.03%Other race alone

-
- 6,04180.9%White alone
- 6568.8%Hispanic
- 2303.1%Two or more races
- 2122.8%Other race alone
- 861.2%Black alone
- 761.0%Asian alone
2000
2022
-
- 10,458,50965.4%White alone
- 2,682,71516.8%Hispanic
- 2,264,26814.2%Black alone
- 261,6931.6%Asian alone
- 236,9541.5%Two or more races
- 42,3580.3%American Indian alone
- 28,9940.2%Other race alone
- 6,8870.04%Native Hawaiian and Other
Pacific Islander alone

-
- 11,309,40350.8%White alone
- 6,025,03927.1%Hispanic
- 3,241,01514.6%Black alone
- 861,6303.9%Two or more races
- 623,6922.8%Asian alone
- 152,0540.7%Other race alone
- 22,5040.1%American Indian alone
- 9,4860.04%Native Hawaiian and Other
Pacific Islander alone

Income and house value in Indian River Estates
- Median household income in 2022
- $46,868White non-Hispanic householders
- $11,147Black householders
- $76,466Hispanic or Latino race householders
- Median 2022 house value
- $290,663White Non-Hispanic householders
- $257,376Black or African American householders
- $326,010Asian householders
- $386,064Some other race householders
- $221,686Hispanic or Latino householders
Household income for White non-Hispanic householders

Household income for Black householders

Household income for Some other race householders

Household income for Two or more races householders

Household income for Hispanic or Latino race householders

Median age by race in Indian River Estates
- 52.3Median age for White residents
- 53.4Males
- 52.2Females
- 49.1Median age for Black or African American residents
- 50.9Males
- -645,446,506.9Females
- 14.5Median age for American Indian / Alaska Native residents
- 10.6Males
- -594,925,633.7Females
- 44.5Median age for Asian residents
- -717,695,472.5Males
- -668,109,667.4Females
- -660,215,053.1Median age for Native Hawaiian / Pacific Islander residents
- -662,309,367.5Males
- -668,008,047.6Females
- 16.8Median age for Other race residents
- 25.3Males
- 11.6Females
- 22.3Median age for Two or more races residents
- 21.6Males
- 22.8Females
- 52.0Median age for White alone residents
- 51.7Males
- 52.5Females
- 25.3Median age for Hispanic or Latino residents
- 42.7Males
- 24.6Females
Owner/renter occupied households by race in Indian River Estates
- House owners and renters - White residents
- 2,40891.8%Owner occupied
- 2168.2%Renter occupied
- House owners and renters - Black or African American residents
- 1420.0%Owner occupied
- 5780.0%Renter occupied
- House owners and renters - American Indian / Alaska Native residents
- 20100.0%Owner occupied
- House owners and renters - Asian residents
- 21100.0%Owner occupied
- House owners and renters - Other race residents
- 2359.3%Owner occupied
- 1640.7%Renter occupied
- House owners and renters - Two or more races residents
- 156100.0%Owner occupied
- House owners and renters - White alone residents
- 2,45391.1%Owner occupied
- 2388.9%Renter occupied
- House owners and renters - Hispanic or Latino residents
- 153100.0%Owner occupied
Language usage in Indian River Estates
- English speakers - Total
- 89.0% of residents of Indian River Estates speak English at home.
- 6.4% of residents speak Spanish at home
- 25554.0%Speak English very well
- 21746.0%Speak English less than very well
- 3.3% of residents speak other language at home
- 22592.2%Speak English very well
- 197.8%Speak English less than very well
All residents speak only English at home
- English speakers - Native, born elsewhere
- 0.0% of residents of Indian River Estates speak English at home.
- 108.6% of residents speak Spanish at home
- 76100.0%Speak English very well
- English speakers - Foreign-born
- 33.5% of residents of Indian River Estates speak English at home.
- 28.2% of residents speak Spanish at home
- 11260.9%Speak English very well
- 7239.1%Speak English less than very well
- 33.8% of residents speak other language at home
- 20191.0%Speak English very well
- 209.0%Speak English less than very well
White (Caucasian) - Speak only English
| Native: | 99.8% (5,682) |
| Foreign-born: | 60.8% (161) |
White (Caucasian) - Speak another language
| Native: | 1.0% (57) |
| Foreign-born: | 48.1% (127) |
American Indian / Alaska Native - Speak another language
| Native: | 100.0% (51) |
| Foreign-born: | 100.0% (60) |
Asian - Speak only English
| Native: | 98.5% (36) |
| Foreign-born: | 57.2% (22) |
Other race - Speak only English
| Native: | 100.0% (245) |
| Foreign-born: | 77.9% (40) |
Two or more races - Speak another language
| Native: | 43.8% (219) |
| Foreign-born: | 98.6% (82) |
White alone - Speak only English
| Native: | 98.9% (5,595) |
| Foreign-born: | 52.3% (181) |
White alone - Speak another language
| Native: | 0.9% (50) |
| Foreign-born: | 48.1% (166) |
Hispanic or Latino - Speak only English
| Native: | 37.7% (161) |
| Foreign-born: | 17.7% (36) |
Hispanic or Latino - Speak another language
| Native: | 61.6% (263) |
| Foreign-born: | 84.0% (170) |
Foreign-born residents in Indian River Estates
627 residents are foreign born (2.7% Latin America, 2.6% North America, 1.8% Europe, 1.2% Asia).
| This city: | 8.4% |
| Florida: | 21.1% |


Marital status for residents in Indian River Estates
Marital status - White (Caucasian) population 15 years and over
- Males
- 28.5%Never married
- 48.2%Now married
- 0.0%Separated
- 7.0%Widowed
- 16.2%Divorced
- Females
- 19.7%Never married
- 46.0%Now married
- 1.7%Separated
- 16.2%Widowed
- 16.4%Divorced
Women who did not give birth in the past 12 months
| Now married: | 43.7% (407) |
| Unmarried: | 56.2% (523) |
Marital status - Black or African American population 15 years and over
- Males
- 71.0%Never married
- 29.0%Now married
- 0.0%Separated
- 0.0%Widowed
- 0.0%Divorced
- Females
- 22.2%Never married
- 77.8%Now married
- 0.0%Separated
- 0.0%Widowed
- 0.0%Divorced
Women who did not give birth in the past 12 months
| Now married: | 0.0% (0) |
| Unmarried: | 100.0% (2) |
Marital status - American Indian / Alaska Native population 15 years and over
- Males
- 40.7%Never married
- 59.3%Now married
- 0.0%Separated
- 0.0%Widowed
- 0.0%Divorced
- Females
- 0.0%Never married
- 100.0%Now married
- 0.0%Separated
- 0.0%Widowed
- 0.0%Divorced
Women who did not give birth in the past 12 months
| Now married: | 100.0% (21) |
| Unmarried: | 0.0% (0) |
Marital status - Asian population 15 years and over
- Males
- 0.0%Never married
- 100.0%Now married
- 0.0%Separated
- 0.0%Widowed
- 0.0%Divorced
- Females
- 0.0%Never married
- 100.0%Now married
- 0.0%Separated
- 0.0%Widowed
- 0.0%Divorced
Women who did not give birth in the past 12 months
| Now married: | 100.0% (22) |
| Unmarried: | 0.0% (0) |
Marital status - Other race population 15 years and over
- Males
- 100.0%Never married
- 0.0%Now married
- 0.0%Separated
- 0.0%Widowed
- 0.0%Divorced
- Females
- 12.3%Never married
- 55.4%Now married
- 0.0%Separated
- 0.0%Widowed
- 32.3%Divorced
Women who gave birth in the past 12 months
| Now married: | 100.0% (4) |
| Unmarried: | 0.0% (0) |
Women who did not give birth in the past 12 months
| Now married: | 0.0% (0) |
| Unmarried: | 100.0% (42) |
Marital status - Two or more races population 15 years and over
- Males
- 52.6%Never married
- 47.4%Now married
- 0.0%Separated
- 0.0%Widowed
- 0.0%Divorced
- Females
- 73.2%Never married
- 14.0%Now married
- 0.0%Separated
- 7.8%Widowed
- 4.9%Divorced
Women who did not give birth in the past 12 months
| Now married: | 13.2% (52) |
| Unmarried: | 86.8% (345) |
Marital status - White alone, not Hispanic / Latino population 15 years and over
- Males
- 29.2%Never married
- 47.7%Now married
- 0.0%Separated
- 7.2%Widowed
- 15.9%Divorced
- Females
- 20.0%Never married
- 45.8%Now married
- 1.7%Separated
- 16.4%Widowed
- 16.0%Divorced
Women who did not give birth in the past 12 months
| Now married: | 43.8% (433) |
| Unmarried: | 56.2% (556) |
Marital status - Hispanic or Latino population 15 years and over
- Males
- 41.2%Never married
- 48.9%Now married
- 0.0%Separated
- 0.0%Widowed
- 9.9%Divorced
- Females
- 30.4%Never married
- 50.0%Now married
- 0.0%Separated
- 4.8%Widowed
- 14.8%Divorced
Women who gave birth in the past 12 months
| Now married: | 100.0% (3) |
| Unmarried: | 0.0% (0) |
Women who did not give birth in the past 12 months
| Now married: | 43.1% (60) |
| Unmarried: | 56.9% (79) |
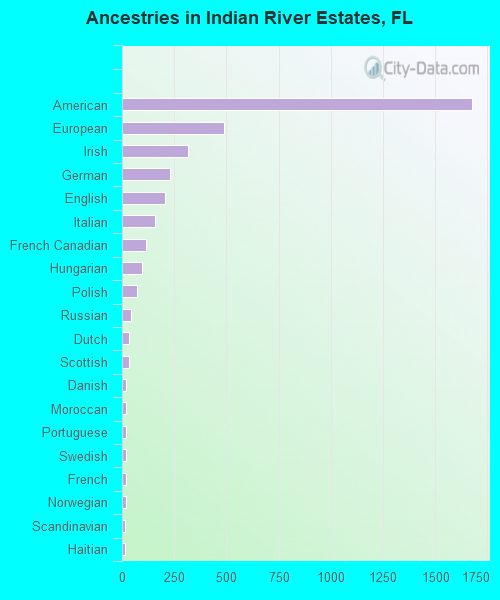
Ancestries in Indian River Estates

- 1,67537.2%American
- 49010.9%European
- 3187.1%Irish
- 2285.1%German
- 2064.6%English
- 1593.5%Italian
- 1132.5%French Canadian
- 952.1%Hungarian
- 711.6%Polish
- 431.0%Russian
- 330.7%Dutch
- 320.7%Scottish
- 210.5%Danish
- 200.4%Moroccan
- 200.4%Portuguese
- 200.4%Swedish
- 190.4%French
- 170.4%Norwegian
- 160.4%Scandinavian
- 160.4%Haitian
- 150.3%Scotch-Irish
- 140.3%Welsh
- 130.3%Latvian
- 120.3%Slovak
- 110.2%Yugoslavian
- 100.2%British
- 80.2%Eastern European
Geographical mobility in Indian River Estates

- Same house 1 year ago
- 5,72996.0%White (Caucasian)
- 8092.5%Black or African American
- 122100.0%American Indian / Alaska Native
- 2028.7%Asian
- 27994.3%Other race
- 689100.0%Two or more races
- 5,82396.3%White alone, not Hispanic / Latino
- 61794.5%Hispanic or Latino

-
- Moved within same county
- 771.3%White / Caucasian
- 4260.3%Asian
- 172.6%Two or more races
- 651.1%White alone, not Hispanic / Latino
- 243.7%Hispanic or Latino

-
- Moved within same state
- 1442.4%White / Caucasian
- 1402.3%White alone, not Hispanic / Latino

-
- Moved from different state
- 227.3%Other race
- 152.3%Hispanic or Latino

-
- Moved from abroad
- 140.2%White
- 190.3%White alone, not Hispanic / Latino

Children Nativity (place of birth) in Indian River Estates
Place of birth for residents in Indian River Estates
![Place of birth for the foreign-born population - Regions]()
- 387Americas
- 199Latin America
- 188Northern America
- 134Europe
- 92Central America
- 88Asia
- 88South Central Asia
- 78Eastern Europe
- 57Caribbean
- 48South America
- 45Northern Europe
- 16Africa
- 16Northern Africa
- 10Western Europe

![Place of birth for the foreign-born population - Countries]()
- 188Canada
- 78Russia
- 71India
- 57Mexico
- 42Cuba
- 34Costa Rica
- 18Norway
- 16Pakistan
- 16Morocco
- 15United Kingdom
- 15Haiti
- 15Venezuela
- 14Colombia
- 14Peru
- 10Scotland
- 10Germany
- 3Ecuador

Grandparents responsible for own grandchildren in Indian River Estates
Zip codes: 34952.