Races in Immokalee, Florida (FL) Detailed Stats
Data:
Races - White alone (%)
Races - White alone (% change since 2000)
Races - Black alone (%)
Races - Black alone (% change since 2000)
Races - American Indian alone (%)
Races - American Indian alone (% change since 2000)
Races - Asian alone (%)
Races - Asian alone (% change since 2000)
Races - Hispanic (%)
Races - Hispanic (% change since 2000)
Races - Native Hawaiian and Other Pacific Islander alone (%)
Races - Native Hawaiian and Other Pacific Islander alone (% change since 2000)
Races - Two or more races(%)
Races - Two or more races(% change since 2000)
Races - Other race alone (%)
Races - Other race alone (% change since 2000)
Racial diversity
Place of birth - Born in state of residence (%)
Place of birth - Born in state of residence (%) - White
Place of birth - Born in state of residence (%) - Black or African American
Place of birth - Born in state of residence (%) - Asian
Place of birth - Born in state of residence (%) - Hispanic or Latino
Place of birth - Born in state of residence (%) - American Indian and Alaska Native
Place of birth - Born in state of residence (%) - Multirace
Place of birth - Born in state of residence (%) - Other Race
Place of birth - Born in other state (%)
Place of birth - Born in other state (%) - White
Place of birth - Born in other state (%) - Black or African American
Place of birth - Born in other state (%) - Asian
Place of birth - Born in other state (%) - Hispanic or Latino
Place of birth - Born in other state (%) - American Indian and Alaska Native
Place of birth - Born in other state (%) - Multirace
Place of birth - Born in other state (%) - Other Race
Place of birth - Native, outside of US (%)
Place of birth - Native, outside of US (%) - White
Place of birth - Native, outside of US (%) - Black or African American
Place of birth - Native, outside of US (%) - Asian
Place of birth - Native, outside of US (%) - Hispanic or Latino
Place of birth - Native, outside of US (%) - American Indian and Alaska Native
Place of birth - Native, outside of US (%) - Multirace
Place of birth - Native, outside of US (%) - Other Race
Place of birth - Foreign born (%)
Place of birth - Foreign born (%) - White
Place of birth - Foreign born (%) - Black or African American
Place of birth - Foreign born (%) - Asian
Place of birth - Foreign born (%) - Hispanic or Latino
Place of birth - Foreign born (%) - American Indian and Alaska Native
Place of birth - Foreign born (%) - Multirace
Place of birth - Foreign born (%) - Other Race
Residents speaking English at home (%)
Residents speaking English at home - Born in the United States (%)
Residents speaking English at home - Native, born elsewhere (%)
Residents speaking English at home - Foreign born (%)
Residents speaking Spanish at home (%)
Residents speaking Spanish at home - Born in the United States (%)
Residents speaking Spanish at home - Native, born elsewhere (%)
Residents speaking Spanish at home - Foreign born (%)
Residents speaking other language at home (%)
Residents speaking other language at home - Born in the United States (%)
Residents speaking other language at home - Native, born elsewhere (%)
Residents speaking other language at home - Foreign born (%)
Marital status - Never married (%)
Marital status - Now married (%)
Marital status - Separated (%)
Marital status - Widowed (%)
Marital status - Divorced (%)
Ancestries Reported - Arab (%)
Ancestries Reported - Czech (%)
Ancestries Reported - Danish (%)
Ancestries Reported - Dutch (%)
Ancestries Reported - English (%)
Ancestries Reported - French (%)
Ancestries Reported - French Canadian (%)
Ancestries Reported - German (%)
Ancestries Reported - Greek (%)
Ancestries Reported - Hungarian (%)
Ancestries Reported - Irish (%)
Ancestries Reported - Italian (%)
Ancestries Reported - Lithuanian (%)
Ancestries Reported - Norwegian (%)
Ancestries Reported - Polish (%)
Ancestries Reported - Portuguese (%)
Ancestries Reported - Russian (%)
Ancestries Reported - Scotch-Irish (%)
Ancestries Reported - Scottish (%)
Ancestries Reported - Slovak (%)
Ancestries Reported - Subsaharan African (%)
Ancestries Reported - Swedish (%)
Ancestries Reported - Swiss (%)
Ancestries Reported - Ukrainian (%)
Ancestries Reported - United States (%)
Ancestries Reported - Welsh (%)
Ancestries Reported - West Indian (%)
Ancestries Reported - Other (%)
Geographical mobility - Same house 1 year ago (%)
Geographical mobility - Same house 1 year ago (%) - White
Geographical mobility - Same house 1 year ago (%) - Black or African American
Geographical mobility - Same house 1 year ago (%) - Asian
Geographical mobility - Same house 1 year ago (%) - Hispanic or Latino
Geographical mobility - Same house 1 year ago (%) - American Indian and Alaska Native
Geographical mobility - Same house 1 year ago (%) - Multirace
Geographical mobility - Same house 1 year ago (%) - Other Race
Geographical mobility - Moved within same county (%)
Geographical mobility - Moved within same county (%) - White
Geographical mobility - Moved within same county (%) - Black or African American
Geographical mobility - Moved within same county (%) - Asian
Geographical mobility - Moved within same county (%) - Hispanic or Latino
Geographical mobility - Moved within same county (%) - American Indian and Alaska Native
Geographical mobility - Moved within same county (%) - Multirace
Geographical mobility - Moved within same county (%) - Other Race
Geographical mobility - Moved from different county within same state (%)
Geographical mobility - Moved from different county within same state (%) - White
Geographical mobility - Moved from different county within same state (%) - Black or African American
Geographical mobility - Moved from different county within same state (%) - Asian
Geographical mobility - Moved from different county within same state (%) - Hispanic or Latino
Geographical mobility - Moved from different county within same state (%) - American Indian and Alaska Native
Geographical mobility - Moved from different county within same state (%) - Multirace
Geographical mobility - Moved from different county within same state (%) - Other Race
Geographical mobility - Moved from different state (%)
Geographical mobility - Moved from different state (%) - White
Geographical mobility - Moved from different state (%) - Black or African American
Geographical mobility - Moved from different state (%) - Asian
Geographical mobility - Moved from different state (%) - Hispanic or Latino
Geographical mobility - Moved from different state (%) - American Indian and Alaska Native
Geographical mobility - Moved from different state (%) - Multirace
Geographical mobility - Moved from different state (%) - Other Race
Geographical mobility - Moved from abroad (%)
Geographical mobility - Moved from abroad (%) - White
Geographical mobility - Moved from abroad (%) - Black or African American
Geographical mobility - Moved from abroad (%) - Asian
Geographical mobility - Moved from abroad (%) - Hispanic or Latino
Geographical mobility - Moved from abroad (%) - American Indian and Alaska Native
Geographical mobility - Moved from abroad (%) - Multirace
Geographical mobility - Moved from abroad (%) - Other Race
Place of birth for the foreign-born population - Ireland (%)
Place of birth for the foreign-born population - Denmark (%)
Place of birth for the foreign-born population - Norway (%)
Place of birth for the foreign-born population - Sweden (%)
Place of birth for the foreign-born population - United Kingdom (%)
Place of birth for the foreign-born population - England (%)
Place of birth for the foreign-born population - Scotland (%)
Place of birth for the foreign-born population - Other Northern Europe (%)
Place of birth for the foreign-born population - Austria (%)
Place of birth for the foreign-born population - Belgium (%)
Place of birth for the foreign-born population - France (%)
Place of birth for the foreign-born population - Germany (%)
Place of birth for the foreign-born population - Netherlands (%)
Place of birth for the foreign-born population - Switzerland (%)
Place of birth for the foreign-born population - Other Western Europe (%)
Place of birth for the foreign-born population - Greece (%)
Place of birth for the foreign-born population - Italy (%)
Place of birth for the foreign-born population - Portugal (%)
Place of birth for the foreign-born population - Spain (%)
Place of birth for the foreign-born population - Other Southern Europe (%)
Place of birth for the foreign-born population - Albania (%)
Place of birth for the foreign-born population - Belarus (%)
Place of birth for the foreign-born population - Bosnia and Herzegovina (%)
Place of birth for the foreign-born population - Bulgaria (%)
Place of birth for the foreign-born population - Croatia (%)
Place of birth for the foreign-born population - Czechoslovakia (%)
Place of birth for the foreign-born population - Hungary (%)
Place of birth for the foreign-born population - Latvia (%)
Place of birth for the foreign-born population - Lithuania (%)
Place of birth for the foreign-born population - North Macedonia (Macedonia) (%)
Place of birth for the foreign-born population - Moldova (%)
Place of birth for the foreign-born population - Poland (%)
Place of birth for the foreign-born population - Romania (%)
Place of birth for the foreign-born population - Russia (%)
Place of birth for the foreign-born population - Serbia (%)
Place of birth for the foreign-born population - Ukraine (%)
Place of birth for the foreign-born population - Other Eastern Europe (%)
Place of birth for the foreign-born population - China (%)
Place of birth for the foreign-born population - Hong Kong (%)
Place of birth for the foreign-born population - Taiwan (%)
Place of birth for the foreign-born population - Japan (%)
Place of birth for the foreign-born population - Korea (%)
Place of birth for the foreign-born population - Other Eastern Asia (%)
Place of birth for the foreign-born population - Afghanistan (%)
Place of birth for the foreign-born population - Bangladesh (%)
Place of birth for the foreign-born population - India (%)
Place of birth for the foreign-born population - Iran (%)
Place of birth for the foreign-born population - Kazakhstan (%)
Place of birth for the foreign-born population - Nepal (%)
Place of birth for the foreign-born population - Pakistan (%)
Place of birth for the foreign-born population - Sri Lanka (%)
Place of birth for the foreign-born population - Uzbekistan (%)
Place of birth for the foreign-born population - Other South Central Asia (%)
Place of birth for the foreign-born population - Burma (%)
Place of birth for the foreign-born population - Cambodia (%)
Place of birth for the foreign-born population - Indonesia (%)
Place of birth for the foreign-born population - Laos (%)
Place of birth for the foreign-born population - Malaysia (%)
Place of birth for the foreign-born population - Philippines (%)
Place of birth for the foreign-born population - Singapore (%)
Place of birth for the foreign-born population - Thailand (%)
Place of birth for the foreign-born population - Vietnam (%)
Place of birth for the foreign-born population - Other South Eastern Asia (%)
Place of birth for the foreign-born population - Armenia (%)
Place of birth for the foreign-born population - Iraq (%)
Place of birth for the foreign-born population - Israel (%)
Place of birth for the foreign-born population - Jordan (%)
Place of birth for the foreign-born population - Kuwait (%)
Place of birth for the foreign-born population - Lebanon (%)
Place of birth for the foreign-born population - Saudi Arabia (%)
Place of birth for the foreign-born population - Syria (%)
Place of birth for the foreign-born population - Turkey (%)
Place of birth for the foreign-born population - Yemen (%)
Place of birth for the foreign-born population - Other Western Asia (%)
Place of birth for the foreign-born population - Eritrea (%)
Place of birth for the foreign-born population - Ethiopia (%)
Place of birth for the foreign-born population - Kenya (%)
Place of birth for the foreign-born population - Somalia (%)
Place of birth for the foreign-born population - Uganda (%)
Place of birth for the foreign-born population - Zimbabwe (%)
Place of birth for the foreign-born population - Other Eastern Africa (%)
Place of birth for the foreign-born population - Cameroon (%)
Place of birth for the foreign-born population - Congo (%)
Place of birth for the foreign-born population - Democratic Republic of Congo (Zaire) (%)
Place of birth for the foreign-born population - Other Middle Africa (%)
Place of birth for the foreign-born population - Egypt (%)
Place of birth for the foreign-born population - Morocco (%)
Place of birth for the foreign-born population - Sudan (%)
Place of birth for the foreign-born population - Other Northern Africa (%)
Place of birth for the foreign-born population - South Africa (%)
Place of birth for the foreign-born population - Other Southern Africa (%)
Place of birth for the foreign-born population - Cabo Verde (%)
Place of birth for the foreign-born population - Ghana (%)
Place of birth for the foreign-born population - Liberia (%)
Place of birth for the foreign-born population - Nigeria (%)
Place of birth for the foreign-born population - Senegal (%)
Place of birth for the foreign-born population - Sierra Leone (%)
Place of birth for the foreign-born population - Other Western Africa (%)
Place of birth for the foreign-born population - Australia (%)
Place of birth for the foreign-born population - New Zealand (%)
Place of birth for the foreign-born population - Fiji (%)
Place of birth for the foreign-born population - Micronesia (%)
Place of birth for the foreign-born population - Bahamas (%)
Place of birth for the foreign-born population - Barbados (%)
Place of birth for the foreign-born population - Cuba (%)
Place of birth for the foreign-born population - Dominica (%)
Place of birth for the foreign-born population - Dominican Republic (%)
Place of birth for the foreign-born population - Grenada (%)
Place of birth for the foreign-born population - Haiti (%)
Place of birth for the foreign-born population - Jamaica (%)
Place of birth for the foreign-born population - St. Vincent and the Grenadines (%)
Place of birth for the foreign-born population - Trinidad and Tobago (%)
Place of birth for the foreign-born population - West Indies (%)
Place of birth for the foreign-born population - Other Caribbean (%)
Place of birth for the foreign-born population - Belize (%)
Place of birth for the foreign-born population - Costa Rica (%)
Place of birth for the foreign-born population - El Salvador (%)
Place of birth for the foreign-born population - Guatemala (%)
Place of birth for the foreign-born population - Honduras (%)
Place of birth for the foreign-born population - Mexico (%)
Place of birth for the foreign-born population - Nicaragua (%)
Place of birth for the foreign-born population - Panama (%)
Place of birth for the foreign-born population - Other Central America (%)
Place of birth for the foreign-born population - Argentina (%)
Place of birth for the foreign-born population - Bolivia (%)
Place of birth for the foreign-born population - Brazil (%)
Place of birth for the foreign-born population - Chile (%)
Place of birth for the foreign-born population - Colombia (%)
Place of birth for the foreign-born population - Ecuador (%)
Place of birth for the foreign-born population - Guyana (%)
Place of birth for the foreign-born population - Peru (%)
Place of birth for the foreign-born population - Uruguay (%)
Place of birth for the foreign-born population - Venezuela (%)
Place of birth for the foreign-born population - Other South America (%)
Place of birth for the foreign-born population - Canada (%)
Place of birth for the foreign-born population - Other Northern America (%)
Place of birth for the foreign-born population - Other (%)
Latest news about races in Immokalee, FL collected exclusively by city-data.com from local newspapers, TV, and radio stations
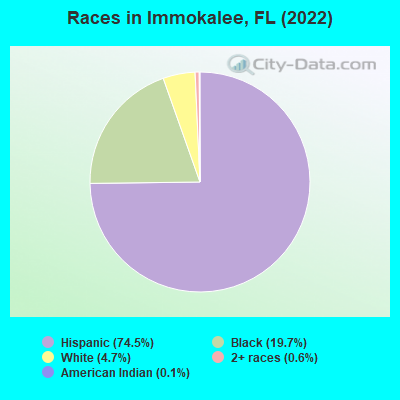
According to 2022 data, the most numerous races in Immokalee, FL are White alone (1,371 residents), Hispanic (21,651 residents), and Black alone (5,717 residents). 22.7% of Immokalee residents speak English at home. 38.2% of Immokalee, FL residents are foreign-born (37.9% born in Latin America), which is 45.0% greater than the foreign-born rate of 21.0% across the entire state of Florida.
Race distribution in Immokalee
2000 2022
10,458,509 65.4% White alone 2,682,715 16.8% Hispanic 2,264,268 14.2% Black alone 261,693 1.6% Asian alone 236,954 1.5% Two or more races 42,358 0.3% American Indian alone 28,994 0.2% Other race alone 6,887 0.04% Native Hawaiian and Other
11,309,403 50.8% White alone 6,025,039 27.1% Hispanic 3,241,015 14.6% Black alone 861,630 3.9% Two or more races 623,692 2.8% Asian alone 152,054 0.7% Other race alone 22,504 0.1% American Indian alone 9,486 0.04% Native Hawaiian and Other
Income and house value in Immokalee Median household income in 2022 $44,123 White non-Hispanic householders$44,555 Black householders$69,846 American Indian and Alaska Native householders$44,566 Some other race householders$58,798 Two or more races householders$49,687 Hispanic or Latino race householdersMedian 2022 house value $329,360 White Non-Hispanic householders$281,312 Black or African American householders$279,762 American Indian or Alaska Native householders $329,360 Asian householders$247,214 Some other race householders$229,389 Two or more races householders$249,151 Hispanic or Latino householders
Median age by race in Immokalee
27.4 Median age for White residents27.1 29.0 47.0 Median age for Black or African American residents50.5 43.3 23.5 Median age for American Indian / Alaska Native residents22.5 21.4 -693,674,484.0 Median age for Asian residents-700,515,083.9 -697,158,696.5 -679,849,340.2 Median age for Native Hawaiian / Pacific Islander residents-858,307,848.3 -666,666,666.0 30.0 Median age for Other race residents21.9 37.4 31.6 Median age for Two or more races residents33.6 26.4 45.0 Median age for White alone residents44.7 47.8 28.0 Median age for Hispanic or Latino residents28.7 27.2
Owner/renter occupied households by race in Immokalee
House owners and renters - White residents 960 50.7% Owner occupied934 49.3% Renter occupiedHouse owners and renters - Black or African American residents 455 19.6% Owner occupied1,871 80.4% Renter occupiedHouse owners and renters - American Indian / Alaska Native residents 183 48.9% Owner occupied191 51.1% Renter occupiedHouse owners and renters - Other race residents 246 60.3% Owner occupied162 39.7% Renter occupiedHouse owners and renters - Two or more races residents 1,229 33.4% Owner occupied2,452 66.6% Renter occupiedHouse owners and renters - White alone residents 191 57.5% Owner occupied142 42.5% Renter occupiedHouse owners and renters - Hispanic or Latino residents 2,087 42.8% Owner occupied2,785 57.2% Renter occupied
Language usage in Immokalee
English speakers - Total 22.7% of residents of Immokalee speak English at home.
63.5% of residents speak Spanish at home 9,902 58.6% Speak English very well6,993 41.4% Speak English less than very well13.5% of residents speak other language at home 1,787 49.7% Speak English very well1,812 50.3% Speak English less than very well
English speakers - Born in the United States 39.9% of residents of Immokalee speak English at home.
53.8% of residents speak Spanish at home 1,838 97.6% Speak English very well46 2.4% Speak English less than very well3.3% of residents speak other language at home 117 100.0% Speak English very well
English speakers - Native, born elsewhere 21.7% of residents of Immokalee speak English at home.
53.2% of residents speak Spanish at home 173 53.6% Speak English very well150 46.4% Speak English less than very well28.8% of residents speak other language at home 93 53.1% Speak English very well82 46.9% Speak English less than very well
English speakers - Foreign-born 3.9% of residents of Immokalee speak English at home.
74.0% of residents speak Spanish at home 1,865 23.2% Speak English very well6,179 76.8% Speak English less than very well23.8% of residents speak other language at home 922 35.7% Speak English very well1,663 64.3% Speak English less than very well
White (Caucasian) - Speak only English Native:
43.3% (2,395)Foreign-born:
1.4% (23)
White (Caucasian) - Speak another language Native:
36.6% (2,023)Foreign-born:
79.2% (1,331)
Black or African American - Speak only English Native:
64.3% (1,774)Foreign-born:
2.5% (72)
Black or African American - Speak another language Native:
35.1% (969)Foreign-born:
100.0% (2,819)
American Indian / Alaska Native - Speak another language Native:
100.0% (886)Foreign-born:
100.0% (1,838)
Other race - Speak only English Native:
28.3% (263)Foreign-born:
29.9% (149)
Other race - Speak another language Native:
71.7% (666)Foreign-born:
75.8% (378)
Two or more races - Speak only English Native:
19.6% (1,513)Foreign-born:
3.6% (209)
Two or more races - Speak another language Native:
79.0% (6,105)Foreign-born:
96.8% (5,606)
White alone - Speak another language Native:
14.9% (185)Foreign-born:
96.8% (18)
Hispanic or Latino - Speak only English Native:
24.5% (2,863)Foreign-born:
3.8% (309)
Hispanic or Latino - Speak another language Native:
75.0% (8,750)Foreign-born:
95.9% (7,736)
Foreign-born residents in Immokalee 11,096 residents are foreign born (37.9% Latin America ).
This city:
38.2%Florida:
21.1%
Marital status for residents in Immokalee Marital status - White (Caucasian) population 15 years and over
Males 57.3% Never married29.0% Now married1.1% Separated1.7% Widowed10.8% DivorcedFemales 44.0% Never married28.4% Now married7.8% Separated5.4% Widowed14.3% DivorcedWomen who gave birth in the past 12 months Now married:
48.5% (91)Unmarried:
51.5% (97)
Women who did not give birth in the past 12 months Now married:
28.3% (521)Unmarried:
71.7% (1,317)
Marital status - Black or African American population 15 years and over
Males 34.5% Never married46.1% Now married5.0% Separated3.6% Widowed10.8% DivorcedFemales 46.1% Never married31.6% Now married3.8% Separated5.6% Widowed13.0% DivorcedWomen who gave birth in the past 12 months Now married:
100.0% (5)Unmarried:
0.0% (0)
Women who did not give birth in the past 12 months Now married:
32.1% (505)Unmarried:
67.9% (1,067)
Marital status - American Indian / Alaska Native population 15 years and over
Males 59.8% Never married39.1% Now married0.0% Separated0.0% Widowed1.1% DivorcedFemales 52.9% Never married31.2% Now married0.0% Separated3.1% Widowed12.8% DivorcedWomen who gave birth in the past 12 months Now married:
3.0% (2)Unmarried:
97.0% (52)
Women who did not give birth in the past 12 months Now married:
30.6% (224)Unmarried:
69.4% (507)
Marital status - Other race population 15 years and over
Males 48.1% Never married44.8% Now married0.0% Separated0.0% Widowed7.1% DivorcedFemales 41.6% Never married40.4% Now married0.0% Separated4.0% Widowed14.0% DivorcedWomen who gave birth in the past 12 months Now married:
69.1% (50)Unmarried:
30.9% (23)
Women who did not give birth in the past 12 months Now married:
36.0% (140)Unmarried:
64.0% (248)
Marital status - Two or more races population 15 years and over
Males 57.1% Never married28.4% Now married5.8% Separated0.8% Widowed8.0% DivorcedFemales 48.2% Never married39.0% Now married3.0% Separated5.6% Widowed4.2% DivorcedWomen who gave birth in the past 12 months Now married:
62.1% (137)Unmarried:
37.9% (84)
Women who did not give birth in the past 12 months Now married:
31.0% (947)Unmarried:
69.0% (2,103)
Marital status - White alone, not Hispanic / Latino population 15 years and over
Males 68.5% Never married16.7% Now married1.5% Separated0.0% Widowed13.3% DivorcedFemales 17.1% Never married45.0% Now married15.0% Separated13.8% Widowed9.0% DivorcedWomen who gave birth in the past 12 months Now married:
100.0% (13)Unmarried:
0.0% (0)
Women who did not give birth in the past 12 months Now married:
58.5% (109)Unmarried:
41.5% (78)
Marital status - Hispanic or Latino population 15 years and over
Males 55.6% Never married31.7% Now married3.4% Separated1.1% Widowed8.1% DivorcedFemales 47.2% Never married33.7% Now married4.2% Separated4.9% Widowed10.0% DivorcedWomen who gave birth in the past 12 months Now married:
50.9% (243)Unmarried:
49.1% (235)
Women who did not give birth in the past 12 months Now married:
29.7% (1,500)Unmarried:
70.3% (3,555)
Ancestries in Immokalee
2,899 15.8% Haitian509 2.8% American288 1.6% African199 1.1% Irish38 0.2% German20 0.1% Romanian19 0.1% Scottish15 0.08% Syrian14 0.08% English12 0.07% Italian
Geographical mobility in Immokalee Same house 1 year ago 7,120 83.8% White (Caucasian)5,131 87.1% Black or African American2,576 100.0% American Indian / Alaska Native1,851 96.7% Other race12,723 88.8% Two or more races899 66.1% White alone, not Hispanic / Latino19,317 92.0% Hispanic or LatinoMoved within same county 513 6.0% White / Caucasian499 8.5% Black or African American7 0.3% American Indian / Alaska Native706 4.9% Two or more races59 4.3% White alone, not Hispanic / Latino627 3.0% Hispanic or LatinoMoved within same state 504 5.9% White / Caucasian68 1.2% Black or African American25 1.0% American Indian / Alaska Native10 0.5% Other race135 0.9% Two or more races253 18.6% White alone, not Hispanic / Latino270 1.3% Hispanic or LatinoMoved from different state 102 1.2% White / Caucasian8 0.1% Black or African American356 2.5% Two or more races71 5.2% White alone, not Hispanic / Latino520 2.5% Hispanic or LatinoMoved from abroad 131 1.5% White205 3.5% Black or African American82 4.3% Other race437 3.1% Two or more races41 3.0% White alone, not Hispanic / Latino483 2.3% Hispanic or Latino
Children Nativity (place of birth) in Immokalee
Children under 6 years - Living with two parents Both parents native 76 100.0% NativeBoth parents foreign-born 414 100.0% NativeOne native, one foreign-born parent 666 100.0% NativeChildren under 6 years - Living with one parent Native parent 552 100.0% NativeForeign-born parent 551 97.6% Native14 2.4% Foreign-bornChildren 6 to 17 years - Living with two parents Both parents native 382 99.7% Native1 0.3% Foreign-bornBoth parents foreign-born 1,670 89.5% Native195 10.5% Foreign-bornOne native, one foreign-born parent 479 95.8% Native21 4.2% Foreign-bornChildren 6 to 17 years - Living with one parent Native parent 941 100.0% NativeForeign-born parent 1,188 54.4% Native996 45.6% Foreign-born
Grandparents responsible for own grandchildren in Immokalee
Grandparents (30 to 59 years) White / Caucasian 20 18.1% Responsible for grandchildren90 81.9% Not responsible for grandchildrenBlack or African American 12 33.9% Responsible for grandchildren24 66.1% Not responsible for grandchildrenAmerican Indian / Alaska Native 24 100.0% Responsible for grandchildrenOther race 8 100.0% Responsible for grandchildrenTwo or more races 66 46.4% Responsible for grandchildren77 53.6% Not responsible for grandchildrenWhite alone, not Hispanic / Latino 4 100.0% Responsible for grandchildrenHispanic or Latino 197 67.6% Responsible for grandchildren95 32.4% Not responsible for grandchildrenGrandparents (60 years and over) White / Caucasian 93 57.4% Responsible for grandchildren69 42.6% Not responsible for grandchildrenBlack or African American 15 31.3% Responsible for grandchildren33 68.7% Not responsible for grandchildrenAmerican Indian / Alaska Native 46 100.0% Responsible for grandchildrenOther race 14 100.0% Not responsible for grandchildrenTwo or more races 146 58.3% Responsible for grandchildren104 41.7% Not responsible for grandchildrenWhite alone, not Hispanic / Latino 24 34.9% Responsible for grandchildren45 65.1% Not responsible for grandchildrenHispanic or Latino 240 74.9% Responsible for grandchildren81 25.1% Not responsible for grandchildren