Races in Idaho Falls, Idaho (ID) Detailed Stats
Data:
Races - White alone (%)
Races - White alone (% change since 2000)
Races - Black alone (%)
Races - Black alone (% change since 2000)
Races - American Indian alone (%)
Races - American Indian alone (% change since 2000)
Races - Asian alone (%)
Races - Asian alone (% change since 2000)
Races - Hispanic (%)
Races - Hispanic (% change since 2000)
Races - Native Hawaiian and Other Pacific Islander alone (%)
Races - Native Hawaiian and Other Pacific Islander alone (% change since 2000)
Races - Two or more races(%)
Races - Two or more races(% change since 2000)
Races - Other race alone (%)
Races - Other race alone (% change since 2000)
Racial diversity
Place of birth - Born in state of residence (%)
Place of birth - Born in state of residence (%) - White
Place of birth - Born in state of residence (%) - Black or African American
Place of birth - Born in state of residence (%) - Asian
Place of birth - Born in state of residence (%) - Hispanic or Latino
Place of birth - Born in state of residence (%) - American Indian and Alaska Native
Place of birth - Born in state of residence (%) - Multirace
Place of birth - Born in state of residence (%) - Other Race
Place of birth - Born in other state (%)
Place of birth - Born in other state (%) - White
Place of birth - Born in other state (%) - Black or African American
Place of birth - Born in other state (%) - Asian
Place of birth - Born in other state (%) - Hispanic or Latino
Place of birth - Born in other state (%) - American Indian and Alaska Native
Place of birth - Born in other state (%) - Multirace
Place of birth - Born in other state (%) - Other Race
Place of birth - Native, outside of US (%)
Place of birth - Native, outside of US (%) - White
Place of birth - Native, outside of US (%) - Black or African American
Place of birth - Native, outside of US (%) - Asian
Place of birth - Native, outside of US (%) - Hispanic or Latino
Place of birth - Native, outside of US (%) - American Indian and Alaska Native
Place of birth - Native, outside of US (%) - Multirace
Place of birth - Native, outside of US (%) - Other Race
Place of birth - Foreign born (%)
Place of birth - Foreign born (%) - White
Place of birth - Foreign born (%) - Black or African American
Place of birth - Foreign born (%) - Asian
Place of birth - Foreign born (%) - Hispanic or Latino
Place of birth - Foreign born (%) - American Indian and Alaska Native
Place of birth - Foreign born (%) - Multirace
Place of birth - Foreign born (%) - Other Race
Residents speaking English at home (%)
Residents speaking English at home - Born in the United States (%)
Residents speaking English at home - Native, born elsewhere (%)
Residents speaking English at home - Foreign born (%)
Residents speaking Spanish at home (%)
Residents speaking Spanish at home - Born in the United States (%)
Residents speaking Spanish at home - Native, born elsewhere (%)
Residents speaking Spanish at home - Foreign born (%)
Residents speaking other language at home (%)
Residents speaking other language at home - Born in the United States (%)
Residents speaking other language at home - Native, born elsewhere (%)
Residents speaking other language at home - Foreign born (%)
Marital status - Never married (%)
Marital status - Now married (%)
Marital status - Separated (%)
Marital status - Widowed (%)
Marital status - Divorced (%)
Ancestries Reported - Arab (%)
Ancestries Reported - Czech (%)
Ancestries Reported - Danish (%)
Ancestries Reported - Dutch (%)
Ancestries Reported - English (%)
Ancestries Reported - French (%)
Ancestries Reported - French Canadian (%)
Ancestries Reported - German (%)
Ancestries Reported - Greek (%)
Ancestries Reported - Hungarian (%)
Ancestries Reported - Irish (%)
Ancestries Reported - Italian (%)
Ancestries Reported - Lithuanian (%)
Ancestries Reported - Norwegian (%)
Ancestries Reported - Polish (%)
Ancestries Reported - Portuguese (%)
Ancestries Reported - Russian (%)
Ancestries Reported - Scotch-Irish (%)
Ancestries Reported - Scottish (%)
Ancestries Reported - Slovak (%)
Ancestries Reported - Subsaharan African (%)
Ancestries Reported - Swedish (%)
Ancestries Reported - Swiss (%)
Ancestries Reported - Ukrainian (%)
Ancestries Reported - United States (%)
Ancestries Reported - Welsh (%)
Ancestries Reported - West Indian (%)
Ancestries Reported - Other (%)
Geographical mobility - Same house 1 year ago (%)
Geographical mobility - Same house 1 year ago (%) - White
Geographical mobility - Same house 1 year ago (%) - Black or African American
Geographical mobility - Same house 1 year ago (%) - Asian
Geographical mobility - Same house 1 year ago (%) - Hispanic or Latino
Geographical mobility - Same house 1 year ago (%) - American Indian and Alaska Native
Geographical mobility - Same house 1 year ago (%) - Multirace
Geographical mobility - Same house 1 year ago (%) - Other Race
Geographical mobility - Moved within same county (%)
Geographical mobility - Moved within same county (%) - White
Geographical mobility - Moved within same county (%) - Black or African American
Geographical mobility - Moved within same county (%) - Asian
Geographical mobility - Moved within same county (%) - Hispanic or Latino
Geographical mobility - Moved within same county (%) - American Indian and Alaska Native
Geographical mobility - Moved within same county (%) - Multirace
Geographical mobility - Moved within same county (%) - Other Race
Geographical mobility - Moved from different county within same state (%)
Geographical mobility - Moved from different county within same state (%) - White
Geographical mobility - Moved from different county within same state (%) - Black or African American
Geographical mobility - Moved from different county within same state (%) - Asian
Geographical mobility - Moved from different county within same state (%) - Hispanic or Latino
Geographical mobility - Moved from different county within same state (%) - American Indian and Alaska Native
Geographical mobility - Moved from different county within same state (%) - Multirace
Geographical mobility - Moved from different county within same state (%) - Other Race
Geographical mobility - Moved from different state (%)
Geographical mobility - Moved from different state (%) - White
Geographical mobility - Moved from different state (%) - Black or African American
Geographical mobility - Moved from different state (%) - Asian
Geographical mobility - Moved from different state (%) - Hispanic or Latino
Geographical mobility - Moved from different state (%) - American Indian and Alaska Native
Geographical mobility - Moved from different state (%) - Multirace
Geographical mobility - Moved from different state (%) - Other Race
Geographical mobility - Moved from abroad (%)
Geographical mobility - Moved from abroad (%) - White
Geographical mobility - Moved from abroad (%) - Black or African American
Geographical mobility - Moved from abroad (%) - Asian
Geographical mobility - Moved from abroad (%) - Hispanic or Latino
Geographical mobility - Moved from abroad (%) - American Indian and Alaska Native
Geographical mobility - Moved from abroad (%) - Multirace
Geographical mobility - Moved from abroad (%) - Other Race
Place of birth for the foreign-born population - Ireland (%)
Place of birth for the foreign-born population - Denmark (%)
Place of birth for the foreign-born population - Norway (%)
Place of birth for the foreign-born population - Sweden (%)
Place of birth for the foreign-born population - United Kingdom (%)
Place of birth for the foreign-born population - England (%)
Place of birth for the foreign-born population - Scotland (%)
Place of birth for the foreign-born population - Other Northern Europe (%)
Place of birth for the foreign-born population - Austria (%)
Place of birth for the foreign-born population - Belgium (%)
Place of birth for the foreign-born population - France (%)
Place of birth for the foreign-born population - Germany (%)
Place of birth for the foreign-born population - Netherlands (%)
Place of birth for the foreign-born population - Switzerland (%)
Place of birth for the foreign-born population - Other Western Europe (%)
Place of birth for the foreign-born population - Greece (%)
Place of birth for the foreign-born population - Italy (%)
Place of birth for the foreign-born population - Portugal (%)
Place of birth for the foreign-born population - Spain (%)
Place of birth for the foreign-born population - Other Southern Europe (%)
Place of birth for the foreign-born population - Albania (%)
Place of birth for the foreign-born population - Belarus (%)
Place of birth for the foreign-born population - Bosnia and Herzegovina (%)
Place of birth for the foreign-born population - Bulgaria (%)
Place of birth for the foreign-born population - Croatia (%)
Place of birth for the foreign-born population - Czechoslovakia (%)
Place of birth for the foreign-born population - Hungary (%)
Place of birth for the foreign-born population - Latvia (%)
Place of birth for the foreign-born population - Lithuania (%)
Place of birth for the foreign-born population - North Macedonia (Macedonia) (%)
Place of birth for the foreign-born population - Moldova (%)
Place of birth for the foreign-born population - Poland (%)
Place of birth for the foreign-born population - Romania (%)
Place of birth for the foreign-born population - Russia (%)
Place of birth for the foreign-born population - Serbia (%)
Place of birth for the foreign-born population - Ukraine (%)
Place of birth for the foreign-born population - Other Eastern Europe (%)
Place of birth for the foreign-born population - China (%)
Place of birth for the foreign-born population - Hong Kong (%)
Place of birth for the foreign-born population - Taiwan (%)
Place of birth for the foreign-born population - Japan (%)
Place of birth for the foreign-born population - Korea (%)
Place of birth for the foreign-born population - Other Eastern Asia (%)
Place of birth for the foreign-born population - Afghanistan (%)
Place of birth for the foreign-born population - Bangladesh (%)
Place of birth for the foreign-born population - India (%)
Place of birth for the foreign-born population - Iran (%)
Place of birth for the foreign-born population - Kazakhstan (%)
Place of birth for the foreign-born population - Nepal (%)
Place of birth for the foreign-born population - Pakistan (%)
Place of birth for the foreign-born population - Sri Lanka (%)
Place of birth for the foreign-born population - Uzbekistan (%)
Place of birth for the foreign-born population - Other South Central Asia (%)
Place of birth for the foreign-born population - Burma (%)
Place of birth for the foreign-born population - Cambodia (%)
Place of birth for the foreign-born population - Indonesia (%)
Place of birth for the foreign-born population - Laos (%)
Place of birth for the foreign-born population - Malaysia (%)
Place of birth for the foreign-born population - Philippines (%)
Place of birth for the foreign-born population - Singapore (%)
Place of birth for the foreign-born population - Thailand (%)
Place of birth for the foreign-born population - Vietnam (%)
Place of birth for the foreign-born population - Other South Eastern Asia (%)
Place of birth for the foreign-born population - Armenia (%)
Place of birth for the foreign-born population - Iraq (%)
Place of birth for the foreign-born population - Israel (%)
Place of birth for the foreign-born population - Jordan (%)
Place of birth for the foreign-born population - Kuwait (%)
Place of birth for the foreign-born population - Lebanon (%)
Place of birth for the foreign-born population - Saudi Arabia (%)
Place of birth for the foreign-born population - Syria (%)
Place of birth for the foreign-born population - Turkey (%)
Place of birth for the foreign-born population - Yemen (%)
Place of birth for the foreign-born population - Other Western Asia (%)
Place of birth for the foreign-born population - Eritrea (%)
Place of birth for the foreign-born population - Ethiopia (%)
Place of birth for the foreign-born population - Kenya (%)
Place of birth for the foreign-born population - Somalia (%)
Place of birth for the foreign-born population - Uganda (%)
Place of birth for the foreign-born population - Zimbabwe (%)
Place of birth for the foreign-born population - Other Eastern Africa (%)
Place of birth for the foreign-born population - Cameroon (%)
Place of birth for the foreign-born population - Congo (%)
Place of birth for the foreign-born population - Democratic Republic of Congo (Zaire) (%)
Place of birth for the foreign-born population - Other Middle Africa (%)
Place of birth for the foreign-born population - Egypt (%)
Place of birth for the foreign-born population - Morocco (%)
Place of birth for the foreign-born population - Sudan (%)
Place of birth for the foreign-born population - Other Northern Africa (%)
Place of birth for the foreign-born population - South Africa (%)
Place of birth for the foreign-born population - Other Southern Africa (%)
Place of birth for the foreign-born population - Cabo Verde (%)
Place of birth for the foreign-born population - Ghana (%)
Place of birth for the foreign-born population - Liberia (%)
Place of birth for the foreign-born population - Nigeria (%)
Place of birth for the foreign-born population - Senegal (%)
Place of birth for the foreign-born population - Sierra Leone (%)
Place of birth for the foreign-born population - Other Western Africa (%)
Place of birth for the foreign-born population - Australia (%)
Place of birth for the foreign-born population - New Zealand (%)
Place of birth for the foreign-born population - Fiji (%)
Place of birth for the foreign-born population - Micronesia (%)
Place of birth for the foreign-born population - Bahamas (%)
Place of birth for the foreign-born population - Barbados (%)
Place of birth for the foreign-born population - Cuba (%)
Place of birth for the foreign-born population - Dominica (%)
Place of birth for the foreign-born population - Dominican Republic (%)
Place of birth for the foreign-born population - Grenada (%)
Place of birth for the foreign-born population - Haiti (%)
Place of birth for the foreign-born population - Jamaica (%)
Place of birth for the foreign-born population - St. Vincent and the Grenadines (%)
Place of birth for the foreign-born population - Trinidad and Tobago (%)
Place of birth for the foreign-born population - West Indies (%)
Place of birth for the foreign-born population - Other Caribbean (%)
Place of birth for the foreign-born population - Belize (%)
Place of birth for the foreign-born population - Costa Rica (%)
Place of birth for the foreign-born population - El Salvador (%)
Place of birth for the foreign-born population - Guatemala (%)
Place of birth for the foreign-born population - Honduras (%)
Place of birth for the foreign-born population - Mexico (%)
Place of birth for the foreign-born population - Nicaragua (%)
Place of birth for the foreign-born population - Panama (%)
Place of birth for the foreign-born population - Other Central America (%)
Place of birth for the foreign-born population - Argentina (%)
Place of birth for the foreign-born population - Bolivia (%)
Place of birth for the foreign-born population - Brazil (%)
Place of birth for the foreign-born population - Chile (%)
Place of birth for the foreign-born population - Colombia (%)
Place of birth for the foreign-born population - Ecuador (%)
Place of birth for the foreign-born population - Guyana (%)
Place of birth for the foreign-born population - Peru (%)
Place of birth for the foreign-born population - Uruguay (%)
Place of birth for the foreign-born population - Venezuela (%)
Place of birth for the foreign-born population - Other South America (%)
Place of birth for the foreign-born population - Canada (%)
Place of birth for the foreign-born population - Other Northern America (%)
Place of birth for the foreign-born population - Other (%)
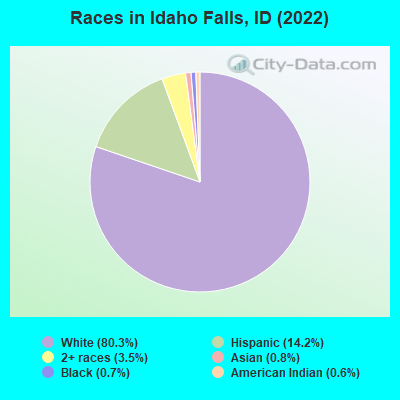
According to 2022 data, the most numerous races in Idaho Falls, ID are White alone (54,368 residents), Hispanic (9,597 residents), and Two or more races (2,361 residents). 90.4% of Idaho Falls residents speak English at home. 4.8% of Idaho Falls, ID residents are foreign-born (3.8% born in Latin America, 0.6% born in Asia), which is 4.9% less than the foreign-born rate of 5.0% across the entire state of Idaho.
Race distribution in Idaho Falls
2000 2022
1,139,291 88.0% White alone 101,690 7.9% Hispanic 18,261 1.4% Two or more races 15,789 1.2% American Indian alone 11,641 0.9% Asian alone 4,889 0.4% Black alone 1,192 0.09% Other race alone 1,200 0.09% Native Hawaiian and Other
1,531,219 79.0% White alone 261,921 13.5% Hispanic 81,112 4.2% Two or more races 25,174 1.3% Asian alone 15,825 0.8% American Indian alone 11,868 0.6% Black alone 8,752 0.5% Other race alone 3,162 0.2% Native Hawaiian and Other
Income and house value in Idaho Falls Median household income in 2022 $69,029 White non-Hispanic householders$72,651 Some other race householders$84,773 Two or more races householders$107,725 Hispanic or Latino race householdersMedian 2022 house value $340,635 White Non-Hispanic householders$386,657 Black or African American householders$340,635 American Indian or Alaska Native householders $488,131 Asian householders$252,364 Some other race householders$763,506 Two or more races householders$268,208 Hispanic or Latino householders
Median age by race in Idaho Falls
35.8 Median age for White residents34.7 36.8 40.6 Median age for Black or African American residents40.3 -666,666,666.0 41.7 Median age for American Indian / Alaska Native residents57.0 37.4 33.9 Median age for Asian residents28.9 34.0 -666,666,666.0 Median age for Native Hawaiian / Pacific Islander residents-666,666,666.0 -666,666,666.0 37.8 Median age for Other race residents37.1 48.4 29.4 Median age for Two or more races residents36.7 23.7 36.6 Median age for White alone residents35.0 39.5 29.2 Median age for Hispanic or Latino residents29.7 29.0
Owner/renter occupied households by race in Idaho Falls
House owners and renters - White residents 14,356 67.8% Owner occupied6,806 32.2% Renter occupiedHouse owners and renters - Black or African American residents 41 20.5% Owner occupied158 79.5% Renter occupiedHouse owners and renters - American Indian / Alaska Native residents 73 42.3% Owner occupied100 57.7% Renter occupiedHouse owners and renters - Asian residents 162 81.7% Owner occupied36 18.3% Renter occupiedHouse owners and renters - Other race residents 479 64.1% Owner occupied268 35.9% Renter occupiedHouse owners and renters - Two or more races residents 814 77.9% Owner occupied230 22.1% Renter occupiedHouse owners and renters - White alone residents 13,924 67.6% Owner occupied6,686 32.4% Renter occupiedHouse owners and renters - Hispanic or Latino residents 2,087 82.6% Owner occupied441 17.4% Renter occupied
Language usage in Idaho Falls
English speakers - Total 90.4% of residents of Idaho Falls speak English at home.
8.2% of residents speak Spanish at home 3,647 69.1% Speak English very well1,631 30.9% Speak English less than very well1.2% of residents speak other language at home 621 81.6% Speak English very well140 18.4% Speak English less than very well
English speakers - Born in the United States 94.2% of residents of Idaho Falls speak English at home.
4.6% of residents speak Spanish at home 1,081 90.5% Speak English very well114 9.5% Speak English less than very well0.6% of residents speak other language at home 118 80.8% Speak English very well28 19.2% Speak English less than very well
English speakers - Native, born elsewhere 90.5% of residents of Idaho Falls speak English at home.
26.5% of residents speak Spanish at home 90 76.9% Speak English very well27 23.1% Speak English less than very well14.7% of residents speak other language at home 58 89.2% Speak English very well7 10.8% Speak English less than very well
English speakers - Foreign-born 16.1% of residents of Idaho Falls speak English at home.
76.9% of residents speak Spanish at home 736 32.5% Speak English very well1,526 67.5% Speak English less than very well13.9% of residents speak other language at home 301 73.4% Speak English very well109 26.6% Speak English less than very well
White (Caucasian) - Speak only English Native:
98.1% (51,180)Foreign-born:
36.7% (204)
White (Caucasian) - Speak another language Native:
1.9% (1,007)Foreign-born:
63.3% (352)
Black or African American - Speak only English Native:
88.8% (202)Foreign-born:
46.6% (17)
Black or African American - Speak another language Native:
10.0% (23)Foreign-born:
55.1% (20)
American Indian / Alaska Native - Speak another language Native:
24.3% (134)Foreign-born:
98.9% (54)
Asian - Speak only English Native:
54.9% (130)Foreign-born:
52.1% (222)
Asian - Speak another language Native:
39.8% (94)Foreign-born:
52.8% (225)
Other race - Speak only English Native:
47.1% (1,191)Foreign-born:
16.4% (151)
Other race - Speak another language Native:
44.6% (1,129)Foreign-born:
96.9% (889)
Two or more races - Speak only English Native:
81.0% (4,191)Foreign-born:
18.7% (78)
Two or more races - Speak another language Native:
18.6% (964)Foreign-born:
83.5% (349)
White alone - Speak only English Native:
98.3% (48,776)Foreign-born:
70.4% (125)
White alone - Speak another language Native:
1.7% (825)Foreign-born:
28.0% (50)
Hispanic or Latino - Speak only English Native:
61.0% (4,092)Foreign-born:
3.1% (67)
Hispanic or Latino - Speak another language Native:
39.0% (2,611)Foreign-born:
96.9% (2,090)
Foreign-born residents in Idaho Falls 3,258 residents are foreign born (3.8% Latin America , 0.6% Asia ).
Marital status for residents in Idaho Falls Marital status - White (Caucasian) population 15 years and over
Males 29.0% Never married59.1% Now married0.5% Separated1.5% Widowed9.9% DivorcedFemales 17.2% Never married53.9% Now married0.6% Separated8.2% Widowed20.1% DivorcedWomen who gave birth in the past 12 months Now married:
90.6% (542)Unmarried:
9.4% (56)
Women who did not give birth in the past 12 months Now married:
61.2% (7,637)Unmarried:
38.8% (4,849)
Marital status - Black or African American population 15 years and over
Males 31.7% Never married53.9% Now married0.0% Separated0.0% Widowed14.4% DivorcedFemales 15.3% Never married49.2% Now married35.6% Separated0.0% Widowed0.0% DivorcedWomen who did not give birth in the past 12 months Now married:
78.6% (32)Unmarried:
21.4% (9)
Marital status - American Indian / Alaska Native population 15 years and over
Males 44.6% Never married26.7% Now married0.0% Separated4.4% Widowed24.3% DivorcedFemales 47.5% Never married37.5% Now married0.0% Separated2.5% Widowed12.5% DivorcedWomen who did not give birth in the past 12 months Now married:
40.3% (92)Unmarried:
59.7% (137)
Marital status - Asian population 15 years and over
Males 56.3% Never married43.7% Now married0.0% Separated0.0% Widowed0.0% DivorcedFemales 31.2% Never married54.5% Now married0.0% Separated2.7% Widowed11.7% DivorcedWomen who gave birth in the past 12 months Now married:
100.0% (45)Unmarried:
0.0% (0)
Women who did not give birth in the past 12 months Now married:
43.8% (100)Unmarried:
56.2% (129)
Marital status - Other race population 15 years and over
Males 58.7% Never married30.4% Now married4.0% Separated0.4% Widowed6.5% DivorcedFemales 49.5% Never married34.3% Now married2.9% Separated0.0% Widowed13.3% DivorcedWomen who gave birth in the past 12 months Now married:
100.0% (39)Unmarried:
0.0% (0)
Women who did not give birth in the past 12 months Now married:
31.3% (356)Unmarried:
68.7% (782)
Marital status - Two or more races population 15 years and over
Males 47.0% Never married44.8% Now married0.1% Separated0.4% Widowed7.7% DivorcedFemales 47.9% Never married33.9% Now married1.4% Separated4.0% Widowed12.8% DivorcedWomen who gave birth in the past 12 months Now married:
70.6% (94)Unmarried:
29.4% (39)
Women who did not give birth in the past 12 months Now married:
28.6% (406)Unmarried:
71.4% (1,011)
Marital status - White alone, not Hispanic / Latino population 15 years and over
Males 28.6% Never married59.2% Now married0.5% Separated1.5% Widowed10.2% DivorcedFemales 15.7% Never married54.1% Now married0.6% Separated8.6% Widowed21.0% DivorcedWomen who gave birth in the past 12 months Now married:
89.3% (469)Unmarried:
10.7% (56)
Women who did not give birth in the past 12 months Now married:
62.4% (7,242)Unmarried:
37.6% (4,373)
Marital status - Hispanic or Latino population 15 years and over
Males 53.8% Never married37.6% Now married2.9% Separated0.2% Widowed5.6% DivorcedFemales 45.0% Never married42.2% Now married1.4% Separated2.5% Widowed8.8% DivorcedWomen who gave birth in the past 12 months Now married:
53.1% (177)Unmarried:
46.9% (157)
Women who did not give birth in the past 12 months Now married:
37.0% (1,102)Unmarried:
63.0% (1,873)
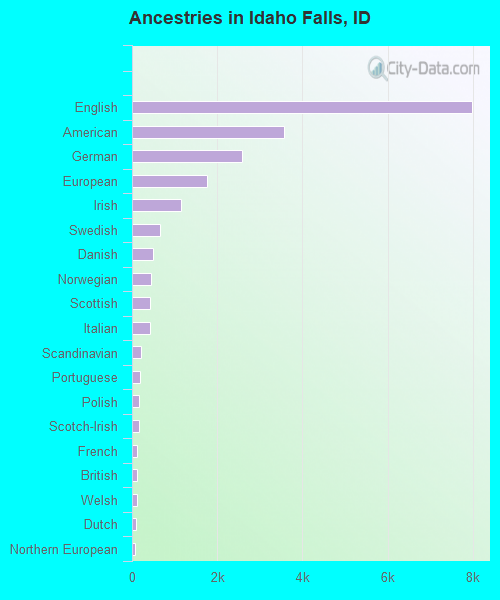
Ancestries in Idaho Falls
7,984 25.0% English3,571 11.2% American2,585 8.1% German1,752 5.5% European1,140 3.6% Irish669 2.1% Swedish501 1.6% Danish456 1.4% Norwegian431 1.4% Scottish430 1.3% Italian210 0.7% Scandinavian191 0.6% Portuguese173 0.5% Polish162 0.5% Scotch-Irish126 0.4% French125 0.4% British118 0.4% Welsh88 0.3% Dutch73 0.2% Northern European65 0.2% Greek62 0.2% Canadian43 0.1% Basque41 0.1% Swiss29 0.09% Hungarian25 0.08% French Canadian22 0.07% Finnish22 0.07% Romanian21 0.07% Czech21 0.07% Russian21 0.07% Ukrainian18 0.06% Eastern European17 0.05% Egyptian15 0.05% Lebanese14 0.04% Sierra Leonean12 0.04% Belgian12 0.04% Yugoslavian10 0.03% Armenian9 0.03% Brazilian7 0.02% Serbian6 0.02% Croatian5 0.02% Slovak5 0.02% Austrian4 0.01% Bulgarian3 0.01% African
Geographical mobility in Idaho Falls Same house 1 year ago 46,616 82.7% White (Caucasian)196 69.2% Black or African American573 83.9% American Indian / Alaska Native626 89.7% Asian20 100.0% Native Hawaiian / Pacific Islander3,992 83.9% Other race6,713 93.3% Two or more races44,684 82.9% White alone, not Hispanic / Latino10,039 86.8% Hispanic or LatinoMoved within same county 5,718 10.1% White / Caucasian75 26.7% Black or African American38 5.6% American Indian / Alaska Native362 7.6% Other race174 2.4% Two or more races5,462 10.1% White alone, not Hispanic / Latino811 7.0% Hispanic or LatinoMoved within same state 2,316 4.1% White / Caucasian19 6.7% Black or African American36 5.3% American Indian / Alaska Native16 2.4% Asian49 1.0% Other race191 2.7% Two or more races2,316 4.3% White alone, not Hispanic / Latino226 2.0% Hispanic or LatinoMoved from different state 1,504 2.7% White / Caucasian7 2.3% Black or African American15 2.2% Asian99 2.1% Other race181 2.5% Two or more races1,366 2.5% White alone, not Hispanic / Latino306 2.6% Hispanic or LatinoMoved from abroad 237 0.4% White54 7.8% Asian104 2.2% Other race97 0.2% White alone, not Hispanic / Latino113 1.0% Hispanic or Latino
Children Nativity (place of birth) in Idaho Falls
Children under 6 years - Living with two parents Both parents native 3,793 100.0% NativeBoth parents foreign-born 177 100.0% NativeOne native, one foreign-born parent 205 100.0% NativeChildren under 6 years - Living with one parent Native parent 1,081 100.0% NativeForeign-born parent 200 100.0% NativeChildren 6 to 17 years - Living with two parents Both parents native 7,481 99.5% Native37 0.5% Foreign-bornBoth parents foreign-born 369 86.2% Native59 13.8% Foreign-bornOne native, one foreign-born parent 722 100.0% NativeChildren 6 to 17 years - Living with one parent Native parent 3,101 100.0% NativeForeign-born parent 491 51.1% Native471 48.9% Foreign-born
Grandparents responsible for own grandchildren in Idaho Falls
Grandparents (30 to 59 years) White / Caucasian 309 62.7% Responsible for grandchildren184 37.3% Not responsible for grandchildrenBlack or African American 5 100.0% Not responsible for grandchildrenAmerican Indian / Alaska Native 9 100.0% Not responsible for grandchildrenOther race 29 42.5% Responsible for grandchildren40 57.5% Not responsible for grandchildrenTwo or more races 41 63.4% Responsible for grandchildren24 36.6% Not responsible for grandchildrenWhite alone, not Hispanic / Latino 332 64.9% Responsible for grandchildren180 35.1% Not responsible for grandchildrenHispanic or Latino 34 40.1% Responsible for grandchildren51 59.9% Not responsible for grandchildrenGrandparents (60 years and over) White / Caucasian 408 72.2% Responsible for grandchildren157 27.8% Not responsible for grandchildrenBlack or African American 8 100.0% Not responsible for grandchildrenOther race 28 100.0% Not responsible for grandchildrenTwo or more races 66 100.0% Responsible for grandchildrenWhite alone, not Hispanic / Latino 408 72.3% Responsible for grandchildren156 27.7% Not responsible for grandchildrenHispanic or Latino 55 73.6% Responsible for grandchildren20 26.4% Not responsible for grandchildren