Races in Hutchinson Island, Florida (FL) Detailed Stats
Ancestries, Foreign-born residents, place of birth
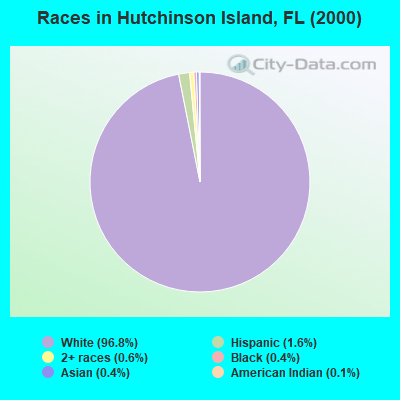
Race distribution in Hutchinson Island

- 8,04696.8%White alone
- 1311.6%Hispanic
- 500.6%Two or more races
- 350.4%Black alone
- 330.4%Asian alone
- 110.1%American Indian alone
- 40.05%Other race alone
- 20.02%Native Hawaiian and Other
Pacific Islander alone
2000
2022
-
- 10,458,50965.4%White alone
- 2,682,71516.8%Hispanic
- 2,264,26814.2%Black alone
- 261,6931.6%Asian alone
- 236,9541.5%Two or more races
- 42,3580.3%American Indian alone
- 28,9940.2%Other race alone
- 6,8870.04%Native Hawaiian and Other
Pacific Islander alone

-
- 11,309,40350.8%White alone
- 6,025,03927.1%Hispanic
- 3,241,01514.6%Black alone
- 861,6303.9%Two or more races
- 623,6922.8%Asian alone
- 152,0540.7%Other race alone
- 22,5040.1%American Indian alone
- 9,4860.04%Native Hawaiian and Other
Pacific Islander alone

Income and house value in Hutchinson Island
- Median household income in 2022
- $69,113White non-Hispanic householders
- $30,177Black householders
- $64,946American Indian and Alaska Native householders
- over $200,000Asian householders
- $101,813Some other race householders
- $41,199Two or more races householders
- $91,421Hispanic or Latino race householders
- Median 2022 house value
- $547,286White Non-Hispanic householders
- $137,138American Indian or Alaska Native householders
- $316,472Two or more races householders
- $316,472Hispanic or Latino householders
Household income for White non-Hispanic householders

Household income for Black householders

Household income for American Indian and Alaska Native householders

Household income for Asian householders

Household income for Two or more races householders

Household income for Hispanic or Latino race householders

Zip code: 34949