Races in Hudson, Ohio (OH) Detailed Stats
Data:
Races - White alone (%)
Races - White alone (% change since 2000)
Races - Black alone (%)
Races - Black alone (% change since 2000)
Races - American Indian alone (%)
Races - American Indian alone (% change since 2000)
Races - Asian alone (%)
Races - Asian alone (% change since 2000)
Races - Hispanic (%)
Races - Hispanic (% change since 2000)
Races - Native Hawaiian and Other Pacific Islander alone (%)
Races - Native Hawaiian and Other Pacific Islander alone (% change since 2000)
Races - Two or more races(%)
Races - Two or more races(% change since 2000)
Races - Other race alone (%)
Races - Other race alone (% change since 2000)
Racial diversity
Place of birth - Born in state of residence (%)
Place of birth - Born in state of residence (%) - White
Place of birth - Born in state of residence (%) - Black or African American
Place of birth - Born in state of residence (%) - Asian
Place of birth - Born in state of residence (%) - Hispanic or Latino
Place of birth - Born in state of residence (%) - American Indian and Alaska Native
Place of birth - Born in state of residence (%) - Multirace
Place of birth - Born in state of residence (%) - Other Race
Place of birth - Born in other state (%)
Place of birth - Born in other state (%) - White
Place of birth - Born in other state (%) - Black or African American
Place of birth - Born in other state (%) - Asian
Place of birth - Born in other state (%) - Hispanic or Latino
Place of birth - Born in other state (%) - American Indian and Alaska Native
Place of birth - Born in other state (%) - Multirace
Place of birth - Born in other state (%) - Other Race
Place of birth - Native, outside of US (%)
Place of birth - Native, outside of US (%) - White
Place of birth - Native, outside of US (%) - Black or African American
Place of birth - Native, outside of US (%) - Asian
Place of birth - Native, outside of US (%) - Hispanic or Latino
Place of birth - Native, outside of US (%) - American Indian and Alaska Native
Place of birth - Native, outside of US (%) - Multirace
Place of birth - Native, outside of US (%) - Other Race
Place of birth - Foreign born (%)
Place of birth - Foreign born (%) - White
Place of birth - Foreign born (%) - Black or African American
Place of birth - Foreign born (%) - Asian
Place of birth - Foreign born (%) - Hispanic or Latino
Place of birth - Foreign born (%) - American Indian and Alaska Native
Place of birth - Foreign born (%) - Multirace
Place of birth - Foreign born (%) - Other Race
Residents speaking English at home (%)
Residents speaking English at home - Born in the United States (%)
Residents speaking English at home - Native, born elsewhere (%)
Residents speaking English at home - Foreign born (%)
Residents speaking Spanish at home (%)
Residents speaking Spanish at home - Born in the United States (%)
Residents speaking Spanish at home - Native, born elsewhere (%)
Residents speaking Spanish at home - Foreign born (%)
Residents speaking other language at home (%)
Residents speaking other language at home - Born in the United States (%)
Residents speaking other language at home - Native, born elsewhere (%)
Residents speaking other language at home - Foreign born (%)
Marital status - Never married (%)
Marital status - Now married (%)
Marital status - Separated (%)
Marital status - Widowed (%)
Marital status - Divorced (%)
Ancestries Reported - Arab (%)
Ancestries Reported - Czech (%)
Ancestries Reported - Danish (%)
Ancestries Reported - Dutch (%)
Ancestries Reported - English (%)
Ancestries Reported - French (%)
Ancestries Reported - French Canadian (%)
Ancestries Reported - German (%)
Ancestries Reported - Greek (%)
Ancestries Reported - Hungarian (%)
Ancestries Reported - Irish (%)
Ancestries Reported - Italian (%)
Ancestries Reported - Lithuanian (%)
Ancestries Reported - Norwegian (%)
Ancestries Reported - Polish (%)
Ancestries Reported - Portuguese (%)
Ancestries Reported - Russian (%)
Ancestries Reported - Scotch-Irish (%)
Ancestries Reported - Scottish (%)
Ancestries Reported - Slovak (%)
Ancestries Reported - Subsaharan African (%)
Ancestries Reported - Swedish (%)
Ancestries Reported - Swiss (%)
Ancestries Reported - Ukrainian (%)
Ancestries Reported - United States (%)
Ancestries Reported - Welsh (%)
Ancestries Reported - West Indian (%)
Ancestries Reported - Other (%)
Geographical mobility - Same house 1 year ago (%)
Geographical mobility - Same house 1 year ago (%) - White
Geographical mobility - Same house 1 year ago (%) - Black or African American
Geographical mobility - Same house 1 year ago (%) - Asian
Geographical mobility - Same house 1 year ago (%) - Hispanic or Latino
Geographical mobility - Same house 1 year ago (%) - American Indian and Alaska Native
Geographical mobility - Same house 1 year ago (%) - Multirace
Geographical mobility - Same house 1 year ago (%) - Other Race
Geographical mobility - Moved within same county (%)
Geographical mobility - Moved within same county (%) - White
Geographical mobility - Moved within same county (%) - Black or African American
Geographical mobility - Moved within same county (%) - Asian
Geographical mobility - Moved within same county (%) - Hispanic or Latino
Geographical mobility - Moved within same county (%) - American Indian and Alaska Native
Geographical mobility - Moved within same county (%) - Multirace
Geographical mobility - Moved within same county (%) - Other Race
Geographical mobility - Moved from different county within same state (%)
Geographical mobility - Moved from different county within same state (%) - White
Geographical mobility - Moved from different county within same state (%) - Black or African American
Geographical mobility - Moved from different county within same state (%) - Asian
Geographical mobility - Moved from different county within same state (%) - Hispanic or Latino
Geographical mobility - Moved from different county within same state (%) - American Indian and Alaska Native
Geographical mobility - Moved from different county within same state (%) - Multirace
Geographical mobility - Moved from different county within same state (%) - Other Race
Geographical mobility - Moved from different state (%)
Geographical mobility - Moved from different state (%) - White
Geographical mobility - Moved from different state (%) - Black or African American
Geographical mobility - Moved from different state (%) - Asian
Geographical mobility - Moved from different state (%) - Hispanic or Latino
Geographical mobility - Moved from different state (%) - American Indian and Alaska Native
Geographical mobility - Moved from different state (%) - Multirace
Geographical mobility - Moved from different state (%) - Other Race
Geographical mobility - Moved from abroad (%)
Geographical mobility - Moved from abroad (%) - White
Geographical mobility - Moved from abroad (%) - Black or African American
Geographical mobility - Moved from abroad (%) - Asian
Geographical mobility - Moved from abroad (%) - Hispanic or Latino
Geographical mobility - Moved from abroad (%) - American Indian and Alaska Native
Geographical mobility - Moved from abroad (%) - Multirace
Geographical mobility - Moved from abroad (%) - Other Race
Place of birth for the foreign-born population - Ireland (%)
Place of birth for the foreign-born population - Denmark (%)
Place of birth for the foreign-born population - Norway (%)
Place of birth for the foreign-born population - Sweden (%)
Place of birth for the foreign-born population - United Kingdom (%)
Place of birth for the foreign-born population - England (%)
Place of birth for the foreign-born population - Scotland (%)
Place of birth for the foreign-born population - Other Northern Europe (%)
Place of birth for the foreign-born population - Austria (%)
Place of birth for the foreign-born population - Belgium (%)
Place of birth for the foreign-born population - France (%)
Place of birth for the foreign-born population - Germany (%)
Place of birth for the foreign-born population - Netherlands (%)
Place of birth for the foreign-born population - Switzerland (%)
Place of birth for the foreign-born population - Other Western Europe (%)
Place of birth for the foreign-born population - Greece (%)
Place of birth for the foreign-born population - Italy (%)
Place of birth for the foreign-born population - Portugal (%)
Place of birth for the foreign-born population - Spain (%)
Place of birth for the foreign-born population - Other Southern Europe (%)
Place of birth for the foreign-born population - Albania (%)
Place of birth for the foreign-born population - Belarus (%)
Place of birth for the foreign-born population - Bosnia and Herzegovina (%)
Place of birth for the foreign-born population - Bulgaria (%)
Place of birth for the foreign-born population - Croatia (%)
Place of birth for the foreign-born population - Czechoslovakia (%)
Place of birth for the foreign-born population - Hungary (%)
Place of birth for the foreign-born population - Latvia (%)
Place of birth for the foreign-born population - Lithuania (%)
Place of birth for the foreign-born population - North Macedonia (Macedonia) (%)
Place of birth for the foreign-born population - Moldova (%)
Place of birth for the foreign-born population - Poland (%)
Place of birth for the foreign-born population - Romania (%)
Place of birth for the foreign-born population - Russia (%)
Place of birth for the foreign-born population - Serbia (%)
Place of birth for the foreign-born population - Ukraine (%)
Place of birth for the foreign-born population - Other Eastern Europe (%)
Place of birth for the foreign-born population - China (%)
Place of birth for the foreign-born population - Hong Kong (%)
Place of birth for the foreign-born population - Taiwan (%)
Place of birth for the foreign-born population - Japan (%)
Place of birth for the foreign-born population - Korea (%)
Place of birth for the foreign-born population - Other Eastern Asia (%)
Place of birth for the foreign-born population - Afghanistan (%)
Place of birth for the foreign-born population - Bangladesh (%)
Place of birth for the foreign-born population - India (%)
Place of birth for the foreign-born population - Iran (%)
Place of birth for the foreign-born population - Kazakhstan (%)
Place of birth for the foreign-born population - Nepal (%)
Place of birth for the foreign-born population - Pakistan (%)
Place of birth for the foreign-born population - Sri Lanka (%)
Place of birth for the foreign-born population - Uzbekistan (%)
Place of birth for the foreign-born population - Other South Central Asia (%)
Place of birth for the foreign-born population - Burma (%)
Place of birth for the foreign-born population - Cambodia (%)
Place of birth for the foreign-born population - Indonesia (%)
Place of birth for the foreign-born population - Laos (%)
Place of birth for the foreign-born population - Malaysia (%)
Place of birth for the foreign-born population - Philippines (%)
Place of birth for the foreign-born population - Singapore (%)
Place of birth for the foreign-born population - Thailand (%)
Place of birth for the foreign-born population - Vietnam (%)
Place of birth for the foreign-born population - Other South Eastern Asia (%)
Place of birth for the foreign-born population - Armenia (%)
Place of birth for the foreign-born population - Iraq (%)
Place of birth for the foreign-born population - Israel (%)
Place of birth for the foreign-born population - Jordan (%)
Place of birth for the foreign-born population - Kuwait (%)
Place of birth for the foreign-born population - Lebanon (%)
Place of birth for the foreign-born population - Saudi Arabia (%)
Place of birth for the foreign-born population - Syria (%)
Place of birth for the foreign-born population - Turkey (%)
Place of birth for the foreign-born population - Yemen (%)
Place of birth for the foreign-born population - Other Western Asia (%)
Place of birth for the foreign-born population - Eritrea (%)
Place of birth for the foreign-born population - Ethiopia (%)
Place of birth for the foreign-born population - Kenya (%)
Place of birth for the foreign-born population - Somalia (%)
Place of birth for the foreign-born population - Uganda (%)
Place of birth for the foreign-born population - Zimbabwe (%)
Place of birth for the foreign-born population - Other Eastern Africa (%)
Place of birth for the foreign-born population - Cameroon (%)
Place of birth for the foreign-born population - Congo (%)
Place of birth for the foreign-born population - Democratic Republic of Congo (Zaire) (%)
Place of birth for the foreign-born population - Other Middle Africa (%)
Place of birth for the foreign-born population - Egypt (%)
Place of birth for the foreign-born population - Morocco (%)
Place of birth for the foreign-born population - Sudan (%)
Place of birth for the foreign-born population - Other Northern Africa (%)
Place of birth for the foreign-born population - South Africa (%)
Place of birth for the foreign-born population - Other Southern Africa (%)
Place of birth for the foreign-born population - Cabo Verde (%)
Place of birth for the foreign-born population - Ghana (%)
Place of birth for the foreign-born population - Liberia (%)
Place of birth for the foreign-born population - Nigeria (%)
Place of birth for the foreign-born population - Senegal (%)
Place of birth for the foreign-born population - Sierra Leone (%)
Place of birth for the foreign-born population - Other Western Africa (%)
Place of birth for the foreign-born population - Australia (%)
Place of birth for the foreign-born population - New Zealand (%)
Place of birth for the foreign-born population - Fiji (%)
Place of birth for the foreign-born population - Micronesia (%)
Place of birth for the foreign-born population - Bahamas (%)
Place of birth for the foreign-born population - Barbados (%)
Place of birth for the foreign-born population - Cuba (%)
Place of birth for the foreign-born population - Dominica (%)
Place of birth for the foreign-born population - Dominican Republic (%)
Place of birth for the foreign-born population - Grenada (%)
Place of birth for the foreign-born population - Haiti (%)
Place of birth for the foreign-born population - Jamaica (%)
Place of birth for the foreign-born population - St. Vincent and the Grenadines (%)
Place of birth for the foreign-born population - Trinidad and Tobago (%)
Place of birth for the foreign-born population - West Indies (%)
Place of birth for the foreign-born population - Other Caribbean (%)
Place of birth for the foreign-born population - Belize (%)
Place of birth for the foreign-born population - Costa Rica (%)
Place of birth for the foreign-born population - El Salvador (%)
Place of birth for the foreign-born population - Guatemala (%)
Place of birth for the foreign-born population - Honduras (%)
Place of birth for the foreign-born population - Mexico (%)
Place of birth for the foreign-born population - Nicaragua (%)
Place of birth for the foreign-born population - Panama (%)
Place of birth for the foreign-born population - Other Central America (%)
Place of birth for the foreign-born population - Argentina (%)
Place of birth for the foreign-born population - Bolivia (%)
Place of birth for the foreign-born population - Brazil (%)
Place of birth for the foreign-born population - Chile (%)
Place of birth for the foreign-born population - Colombia (%)
Place of birth for the foreign-born population - Ecuador (%)
Place of birth for the foreign-born population - Guyana (%)
Place of birth for the foreign-born population - Peru (%)
Place of birth for the foreign-born population - Uruguay (%)
Place of birth for the foreign-born population - Venezuela (%)
Place of birth for the foreign-born population - Other South America (%)
Place of birth for the foreign-born population - Canada (%)
Place of birth for the foreign-born population - Other Northern America (%)
Place of birth for the foreign-born population - Other (%)
Latest news about races in Hudson, OH collected exclusively by city-data.com from local newspapers, TV, and radio stations
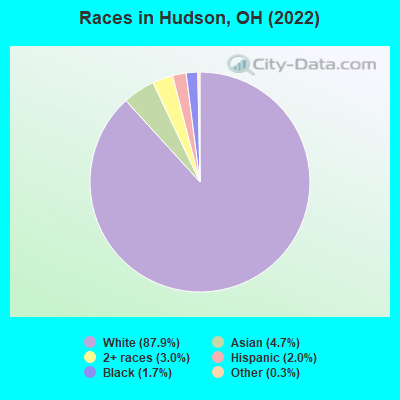
According to 2022 data, the most numerous races in Hudson, OH are White alone (20,094 residents), Black alone (398 residents), and Two or more races (697 residents). 92.9% of Hudson residents speak English at home. 6.6% of Hudson, OH residents are foreign-born (3.9% born in Asia, 1.6% born in Europe), which is 39.0% greater than the foreign-born rate of 4.0% across the entire state of Ohio.
Race distribution in Hudson
2000 2022
9,538,111 84.0% White alone 1,290,662 11.4% Black alone 217,123 1.9% Hispanic 137,770 1.2% Two or more races 131,670 1.2% Asian alone 21,985 0.2% American Indian alone 13,483 0.1% Other race alone 2,336 0.02% Native Hawaiian and Other
8,948,793 76.1% White alone 1,401,403 11.9% Black alone 529,291 4.5% Two or more races 517,232 4.4% Hispanic 293,387 2.5% Asian alone 52,805 0.4% Other race alone 9,785 0.08% American Indian alone 3,362 0.03% Native Hawaiian and Other
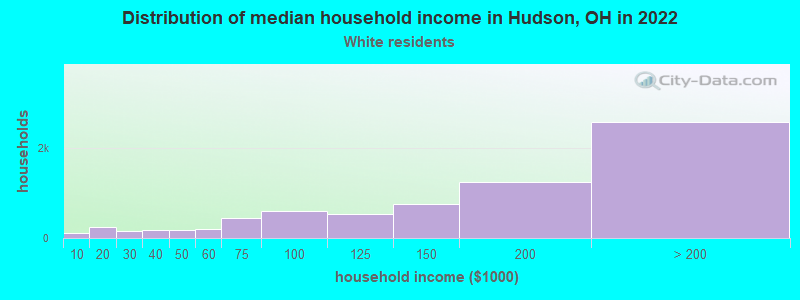
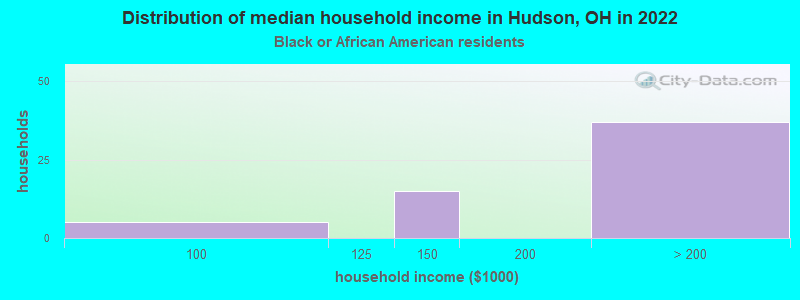
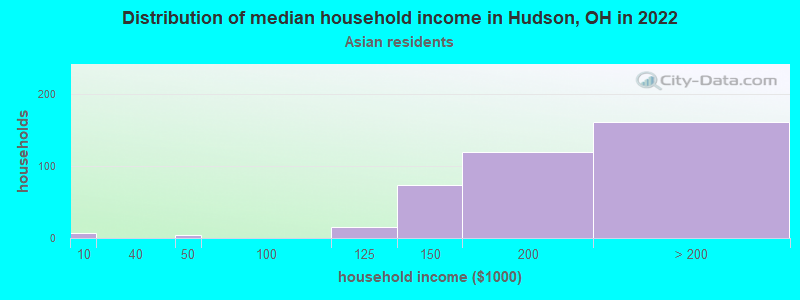
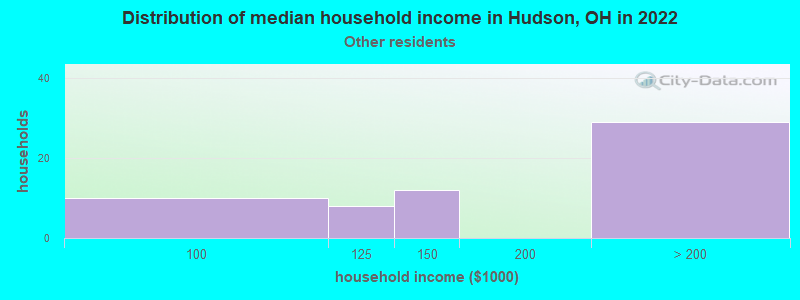
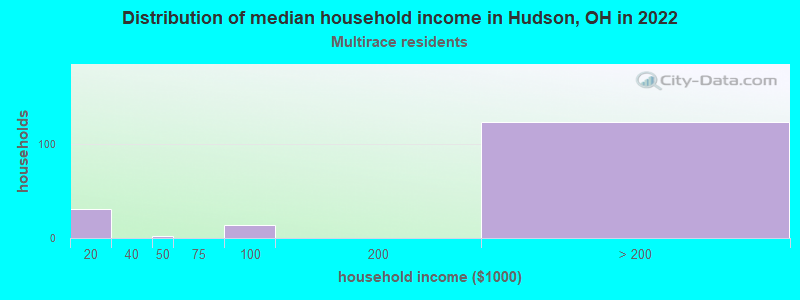
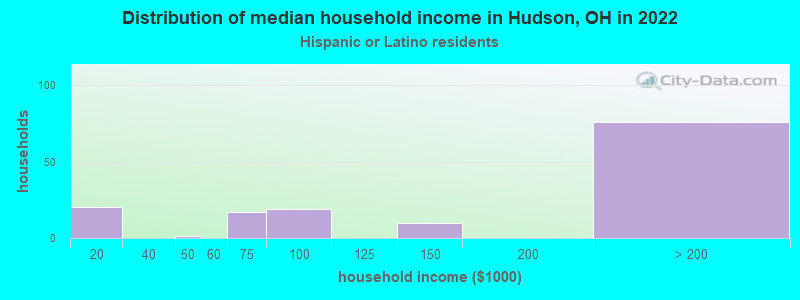
Income and house value in Hudson Median household income in 2022 $152,903 White non-Hispanic householdersover $200,000 Black householders$125,345 Asian householdersover $200,000 Two or more races householdersover $200,000 Hispanic or Latino race householdersMedian 2022 house value $452,399 White Non-Hispanic householders$297,851 Black or African American householders$181,035 American Indian or Alaska Native householders $435,248 Asian householders$428,769 Some other race householders$790,841 Two or more races householders$428,769 Hispanic or Latino householders
Median age by race in Hudson
45.0 Median age for White residents43.9 46.2 22.4 Median age for Black or African American residents22.9 19.3 -502,953,586.0 Median age for American Indian / Alaska Native residents-668,371,695.8 -390,759,075.5 45.2 Median age for Asian residents47.3 43.8 -800,387,596.1 Median age for Native Hawaiian / Pacific Islander residents-666,666,666.0 -805,394,989.6 56.1 Median age for Other race residents37.0 57.2 14.4 Median age for Two or more races residents14.2 14.4 45.1 Median age for White alone residents43.9 46.3 31.6 Median age for Hispanic or Latino residents38.1 21.9
Owner/renter occupied households by race in Hudson
House owners and renters - White residents 6,616 88.7% Owner occupied843 11.3% Renter occupiedHouse owners and renters - Black or African American residents 15 25.6% Owner occupied44 74.4% Renter occupiedHouse owners and renters - American Indian / Alaska Native residents 11 100.0% Owner occupiedHouse owners and renters - Asian residents 393 98.8% Owner occupied5 1.2% Renter occupiedHouse owners and renters - Other race residents 36 100.0% Owner occupiedHouse owners and renters - Two or more races residents 148 100.0% Owner occupiedHouse owners and renters - White alone residents 6,556 88.6% Owner occupied845 11.4% Renter occupiedHouse owners and renters - Hispanic or Latino residents 148 100.0% Owner occupied
Language usage in Hudson
English speakers - Total 92.9% of residents of Hudson speak English at home.
0.6% of residents speak Spanish at home 81 65.9% Speak English very well42 34.1% Speak English less than very well6.4% of residents speak other language at home 990 72.6% Speak English very well373 27.4% Speak English less than very well
English speakers - Born in the United States 98.8% of residents of Hudson speak English at home.
0.5% of residents speak Spanish at home 33 100.0% Speak English very well0.8% of residents speak other language at home 58 100.0% Speak English very well
All residents speak only English at home
English speakers - Foreign-born 24.6% of residents of Hudson speak English at home.
2.1% of residents speak Spanish at home 31 100.0% Speak English very well71.3% of residents speak other language at home 715 66.8% Speak English very well356 33.2% Speak English less than very well
White (Caucasian) - Speak only English Native:
98.1% (17,899)Foreign-born:
39.6% (278)
White (Caucasian) - Speak another language Native:
1.9% (355)Foreign-born:
58.7% (413)
Asian - Speak only English Native:
77.4% (133)Foreign-born:
10.9% (89)
Asian - Speak another language Native:
35.4% (61)Foreign-born:
88.9% (722)
Other race - Speak only English Native:
92.3% (119)Foreign-born:
78.7% (10)
Two or more races - Speak another language Native:
0.7% (6)Foreign-born:
100.0% (20)
White alone - Speak only English Native:
97.9% (17,723)Foreign-born:
39.4% (265)
White alone - Speak another language Native:
2.3% (412)Foreign-born:
59.6% (400)
Hispanic or Latino - Speak only English Native:
100.0% (404)Foreign-born:
44.9% (24)
Hispanic or Latino - Speak another language Native:
3.4% (14)Foreign-born:
53.2% (29)
Foreign-born residents in Hudson 1,498 residents are foreign born (3.9% Asia , 1.6% Europe ).
Marital status for residents in Hudson Marital status - White (Caucasian) population 15 years and over
Males 19.6% Never married73.0% Now married0.0% Separated2.3% Widowed5.1% DivorcedFemales 16.9% Never married68.7% Now married0.6% Separated6.7% Widowed7.1% DivorcedWomen who gave birth in the past 12 months Now married:
88.3% (131)Unmarried:
11.7% (17)
Women who did not give birth in the past 12 months Now married:
60.3% (2,149)Unmarried:
39.7% (1,416)
Marital status - Black or African American population 15 years and over
Males 74.1% Never married25.3% Now married0.0% Separated0.0% Widowed0.6% DivorcedFemales 68.4% Never married27.6% Now married0.0% Separated1.5% Widowed2.6% DivorcedWomen who did not give birth in the past 12 months Now married:
16.8% (27)Unmarried:
83.2% (135)
Marital status - Asian population 15 years and over
Males 10.1% Never married81.8% Now married0.0% Separated0.0% Widowed8.2% DivorcedFemales 10.8% Never married84.5% Now married0.0% Separated3.2% Widowed1.5% DivorcedWomen who gave birth in the past 12 months Now married:
100.0% (20)Unmarried:
0.0% (0)
Women who did not give birth in the past 12 months Now married:
76.2% (174)Unmarried:
23.8% (54)
Marital status - Other race population 15 years and over
Males 38.3% Never married61.7% Now married0.0% Separated0.0% Widowed0.0% DivorcedFemales 28.6% Never married71.4% Now married0.0% Separated0.0% Widowed0.0% DivorcedWomen who did not give birth in the past 12 months Now married:
100.0% (15)Unmarried:
0.0% (0)
Marital status - Two or more races population 15 years and over
Males 46.7% Never married45.2% Now married0.0% Separated0.0% Widowed8.1% DivorcedFemales 39.1% Never married55.7% Now married0.0% Separated0.0% Widowed5.2% DivorcedWomen who gave birth in the past 12 months Now married:
100.0% (5)Unmarried:
0.0% (0)
Women who did not give birth in the past 12 months Now married:
54.0% (110)Unmarried:
46.0% (94)
Marital status - White alone, not Hispanic / Latino population 15 years and over
Males 19.7% Never married73.0% Now married0.0% Separated2.3% Widowed5.0% DivorcedFemales 17.0% Never married68.7% Now married0.6% Separated6.6% Widowed7.1% DivorcedWomen who gave birth in the past 12 months Now married:
88.3% (132)Unmarried:
11.7% (17)
Women who did not give birth in the past 12 months Now married:
60.5% (2,158)Unmarried:
39.5% (1,412)
Marital status - Hispanic or Latino population 15 years and over
Males 19.1% Never married73.9% Now married0.0% Separated0.0% Widowed7.0% DivorcedFemales 25.5% Never married52.3% Now married0.0% Separated10.1% Widowed12.1% DivorcedWomen who gave birth in the past 12 months Now married:
100.0% (4)Unmarried:
0.0% (0)
Women who did not give birth in the past 12 months Now married:
36.1% (29)Unmarried:
63.9% (52)
Ancestries in Hudson
1,261 14.1% English1,200 13.5% German922 10.3% Italian803 9.0% Irish550 6.2% American469 5.3% European466 5.2% Slovak398 4.5% Polish175 2.0% Scottish116 1.3% Swedish112 1.3% Hungarian108 1.2% Lebanese95 1.1% Israeli80 0.9% Scotch-Irish77 0.9% Russian75 0.8% Romanian74 0.8% French69 0.8% British67 0.8% Eastern European62 0.7% Slovene58 0.7% Greek54 0.6% Danish44 0.5% Croatian44 0.5% Czech40 0.4% French Canadian38 0.4% Ukrainian36 0.4% Czechoslovakian32 0.4% Egyptian28 0.3% Norwegian25 0.3% Arab25 0.3% Slavic22 0.2% Austrian18 0.2% Welsh15 0.2% Bulgarian15 0.2% Serbian15 0.2% Syrian15 0.2% Portuguese12 0.1% Dutch11 0.1% Scandinavian11 0.1% Swiss11 0.1% Kenyan9 0.1% African7 0.08% Canadian7 0.08% Armenian5 0.06% Northern European5 0.06% Belgian4 0.04% Latvian
Children Nativity (place of birth) in Hudson
Children under 6 years - Living with two parents Both parents native 1,391 100.0% NativeBoth parents foreign-born 129 97.6% Native3 2.4% Foreign-bornOne native, one foreign-born parent 36 100.0% NativeChildren under 6 years - Living with one parent Native parent 124 100.0% NativeForeign-born parent 22 100.0% NativeChildren 6 to 17 years - Living with two parents Both parents native 3,370 98.4% Native53 1.6% Foreign-bornBoth parents foreign-born 222 87.1% Native33 12.9% Foreign-bornOne native, one foreign-born parent 324 99.1% Native3 0.9% Foreign-bornChildren 6 to 17 years - Living with one parent Native parent 365 100.0% NativeForeign-born parent 19 43.0% Native25 57.0% Foreign-born
Grandparents responsible for own grandchildren in Hudson
Grandparents (30 to 59 years) White / Caucasian 6 51.0% Responsible for grandchildren6 49.0% Not responsible for grandchildrenBlack or African American 15 100.0% Responsible for grandchildrenWhite alone, not Hispanic / Latino 6 51.2% Responsible for grandchildren6 48.8% Not responsible for grandchildrenGrandparents (60 years and over) White / Caucasian 35 38.2% Responsible for grandchildren57 61.8% Not responsible for grandchildrenWhite alone, not Hispanic / Latino 35 38.1% Responsible for grandchildren57 61.9% Not responsible for grandchildren