Races in Horsham, Pennsylvania (PA) Detailed Stats
Data:
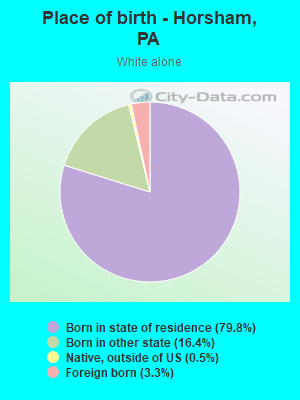
Races - White alone (%)
Races - White alone (% change since 2000)
Races - Black alone (%)
Races - Black alone (% change since 2000)
Races - American Indian alone (%)
Races - American Indian alone (% change since 2000)
Races - Asian alone (%)
Races - Asian alone (% change since 2000)
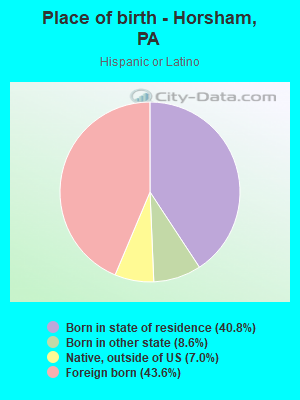
Races - Hispanic (%)
Races - Hispanic (% change since 2000)
Races - Native Hawaiian and Other Pacific Islander alone (%)
Races - Native Hawaiian and Other Pacific Islander alone (% change since 2000)
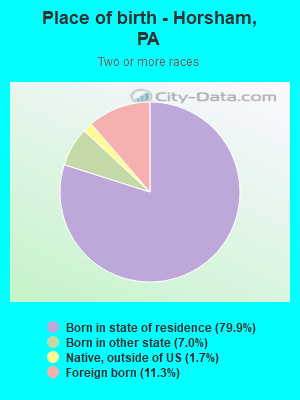
Races - Two or more races(%)
Races - Two or more races(% change since 2000)
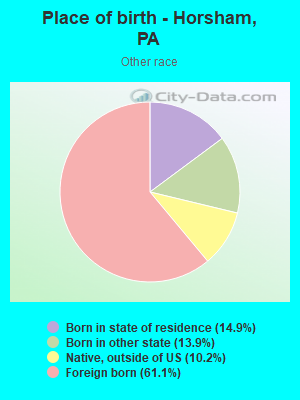
Races - Other race alone (%)
Races - Other race alone (% change since 2000)
Racial diversity
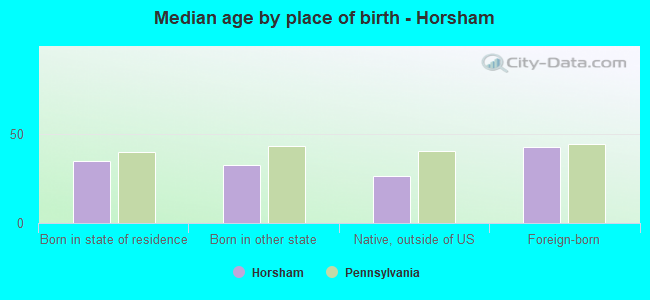
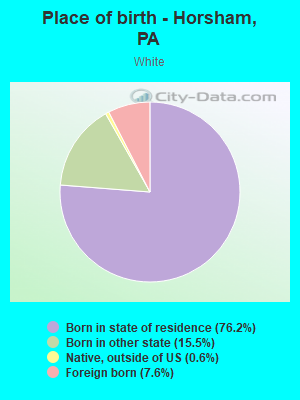
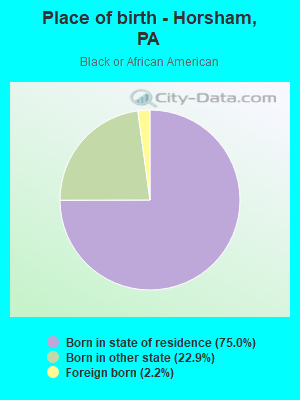
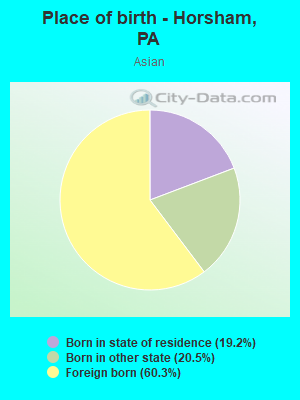
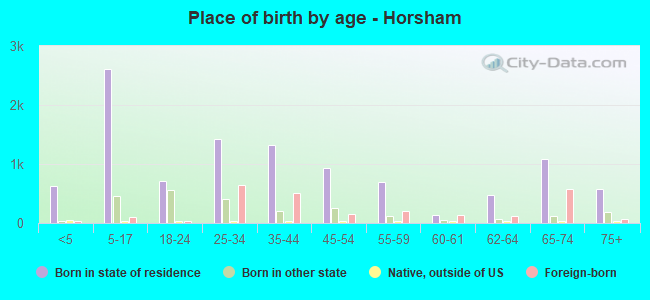
Place of birth - Born in state of residence (%)
Place of birth - Born in state of residence (%) - White
Place of birth - Born in state of residence (%) - Black or African American
Place of birth - Born in state of residence (%) - Asian
Place of birth - Born in state of residence (%) - Hispanic or Latino
Place of birth - Born in state of residence (%) - American Indian and Alaska Native
Place of birth - Born in state of residence (%) - Multirace
Place of birth - Born in state of residence (%) - Other Race
Place of birth - Born in other state (%)
Place of birth - Born in other state (%) - White
Place of birth - Born in other state (%) - Black or African American
Place of birth - Born in other state (%) - Asian
Place of birth - Born in other state (%) - Hispanic or Latino
Place of birth - Born in other state (%) - American Indian and Alaska Native
Place of birth - Born in other state (%) - Multirace
Place of birth - Born in other state (%) - Other Race
Place of birth - Native, outside of US (%)
Place of birth - Native, outside of US (%) - White
Place of birth - Native, outside of US (%) - Black or African American
Place of birth - Native, outside of US (%) - Asian
Place of birth - Native, outside of US (%) - Hispanic or Latino
Place of birth - Native, outside of US (%) - American Indian and Alaska Native
Place of birth - Native, outside of US (%) - Multirace
Place of birth - Native, outside of US (%) - Other Race
Place of birth - Foreign born (%)
Place of birth - Foreign born (%) - White
Place of birth - Foreign born (%) - Black or African American
Place of birth - Foreign born (%) - Asian
Place of birth - Foreign born (%) - Hispanic or Latino
Place of birth - Foreign born (%) - American Indian and Alaska Native
Place of birth - Foreign born (%) - Multirace
Place of birth - Foreign born (%) - Other Race
Residents speaking English at home (%)
Residents speaking English at home - Born in the United States (%)
Residents speaking English at home - Native, born elsewhere (%)
Residents speaking English at home - Foreign born (%)
Residents speaking Spanish at home (%)
Residents speaking Spanish at home - Born in the United States (%)
Residents speaking Spanish at home - Native, born elsewhere (%)
Residents speaking Spanish at home - Foreign born (%)
Residents speaking other language at home (%)
Residents speaking other language at home - Born in the United States (%)
Residents speaking other language at home - Native, born elsewhere (%)
Residents speaking other language at home - Foreign born (%)
Marital status - Never married (%)
Marital status - Now married (%)
Marital status - Separated (%)
Marital status - Widowed (%)
Marital status - Divorced (%)
Ancestries Reported - Arab (%)
Ancestries Reported - Czech (%)
Ancestries Reported - Danish (%)
Ancestries Reported - Dutch (%)
Ancestries Reported - English (%)
Ancestries Reported - French (%)
Ancestries Reported - French Canadian (%)
Ancestries Reported - German (%)
Ancestries Reported - Greek (%)
Ancestries Reported - Hungarian (%)
Ancestries Reported - Irish (%)
Ancestries Reported - Italian (%)
Ancestries Reported - Lithuanian (%)
Ancestries Reported - Norwegian (%)
Ancestries Reported - Polish (%)
Ancestries Reported - Portuguese (%)
Ancestries Reported - Russian (%)
Ancestries Reported - Scotch-Irish (%)
Ancestries Reported - Scottish (%)
Ancestries Reported - Slovak (%)
Ancestries Reported - Subsaharan African (%)
Ancestries Reported - Swedish (%)
Ancestries Reported - Swiss (%)
Ancestries Reported - Ukrainian (%)
Ancestries Reported - United States (%)
Ancestries Reported - Welsh (%)
Ancestries Reported - West Indian (%)
Ancestries Reported - Other (%)
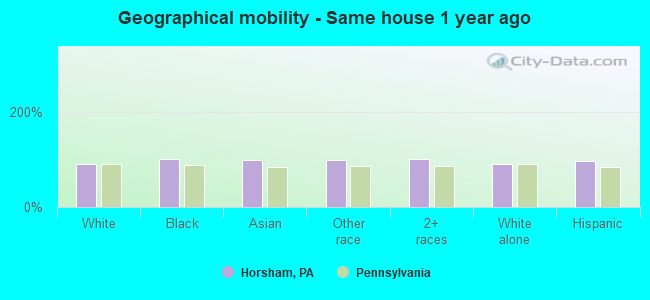
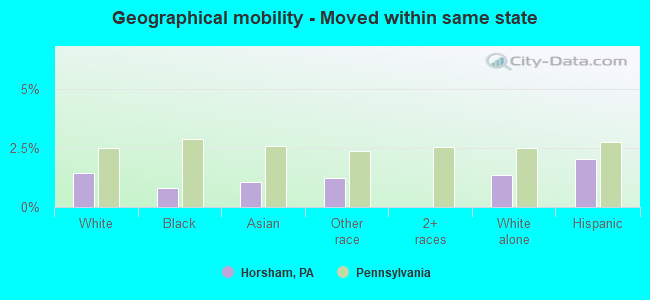
Geographical mobility - Same house 1 year ago (%)
Geographical mobility - Same house 1 year ago (%) - White
Geographical mobility - Same house 1 year ago (%) - Black or African American
Geographical mobility - Same house 1 year ago (%) - Asian
Geographical mobility - Same house 1 year ago (%) - Hispanic or Latino
Geographical mobility - Same house 1 year ago (%) - American Indian and Alaska Native
Geographical mobility - Same house 1 year ago (%) - Multirace
Geographical mobility - Same house 1 year ago (%) - Other Race
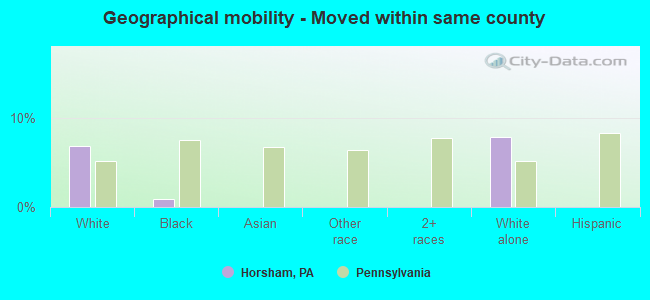
Geographical mobility - Moved within same county (%)
Geographical mobility - Moved within same county (%) - White
Geographical mobility - Moved within same county (%) - Black or African American
Geographical mobility - Moved within same county (%) - Asian
Geographical mobility - Moved within same county (%) - Hispanic or Latino
Geographical mobility - Moved within same county (%) - American Indian and Alaska Native
Geographical mobility - Moved within same county (%) - Multirace
Geographical mobility - Moved within same county (%) - Other Race
Geographical mobility - Moved from different county within same state (%)
Geographical mobility - Moved from different county within same state (%) - White
Geographical mobility - Moved from different county within same state (%) - Black or African American
Geographical mobility - Moved from different county within same state (%) - Asian
Geographical mobility - Moved from different county within same state (%) - Hispanic or Latino
Geographical mobility - Moved from different county within same state (%) - American Indian and Alaska Native
Geographical mobility - Moved from different county within same state (%) - Multirace
Geographical mobility - Moved from different county within same state (%) - Other Race
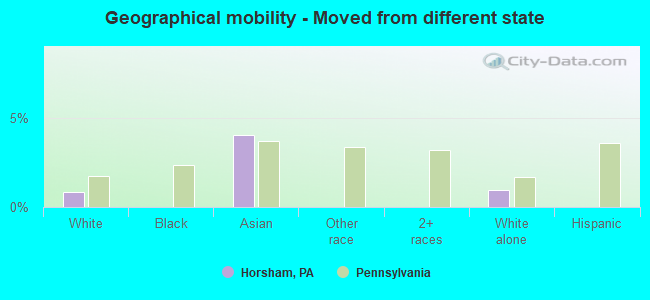
Geographical mobility - Moved from different state (%)
Geographical mobility - Moved from different state (%) - White
Geographical mobility - Moved from different state (%) - Black or African American
Geographical mobility - Moved from different state (%) - Asian
Geographical mobility - Moved from different state (%) - Hispanic or Latino
Geographical mobility - Moved from different state (%) - American Indian and Alaska Native
Geographical mobility - Moved from different state (%) - Multirace
Geographical mobility - Moved from different state (%) - Other Race
Geographical mobility - Moved from abroad (%)
Geographical mobility - Moved from abroad (%) - White
Geographical mobility - Moved from abroad (%) - Black or African American
Geographical mobility - Moved from abroad (%) - Asian
Geographical mobility - Moved from abroad (%) - Hispanic or Latino
Geographical mobility - Moved from abroad (%) - American Indian and Alaska Native
Geographical mobility - Moved from abroad (%) - Multirace
Geographical mobility - Moved from abroad (%) - Other Race
Place of birth for the foreign-born population - Ireland (%)
Place of birth for the foreign-born population - Denmark (%)
Place of birth for the foreign-born population - Norway (%)
Place of birth for the foreign-born population - Sweden (%)
Place of birth for the foreign-born population - United Kingdom (%)
Place of birth for the foreign-born population - England (%)
Place of birth for the foreign-born population - Scotland (%)
Place of birth for the foreign-born population - Other Northern Europe (%)
Place of birth for the foreign-born population - Austria (%)
Place of birth for the foreign-born population - Belgium (%)
Place of birth for the foreign-born population - France (%)
Place of birth for the foreign-born population - Germany (%)
Place of birth for the foreign-born population - Netherlands (%)
Place of birth for the foreign-born population - Switzerland (%)
Place of birth for the foreign-born population - Other Western Europe (%)
Place of birth for the foreign-born population - Greece (%)
Place of birth for the foreign-born population - Italy (%)
Place of birth for the foreign-born population - Portugal (%)
Place of birth for the foreign-born population - Spain (%)
Place of birth for the foreign-born population - Other Southern Europe (%)
Place of birth for the foreign-born population - Albania (%)
Place of birth for the foreign-born population - Belarus (%)
Place of birth for the foreign-born population - Bosnia and Herzegovina (%)
Place of birth for the foreign-born population - Bulgaria (%)
Place of birth for the foreign-born population - Croatia (%)
Place of birth for the foreign-born population - Czechoslovakia (%)
Place of birth for the foreign-born population - Hungary (%)
Place of birth for the foreign-born population - Latvia (%)
Place of birth for the foreign-born population - Lithuania (%)
Place of birth for the foreign-born population - North Macedonia (Macedonia) (%)
Place of birth for the foreign-born population - Moldova (%)
Place of birth for the foreign-born population - Poland (%)
Place of birth for the foreign-born population - Romania (%)
Place of birth for the foreign-born population - Russia (%)
Place of birth for the foreign-born population - Serbia (%)
Place of birth for the foreign-born population - Ukraine (%)
Place of birth for the foreign-born population - Other Eastern Europe (%)
Place of birth for the foreign-born population - China (%)
Place of birth for the foreign-born population - Hong Kong (%)
Place of birth for the foreign-born population - Taiwan (%)
Place of birth for the foreign-born population - Japan (%)
Place of birth for the foreign-born population - Korea (%)
Place of birth for the foreign-born population - Other Eastern Asia (%)
Place of birth for the foreign-born population - Afghanistan (%)
Place of birth for the foreign-born population - Bangladesh (%)
Place of birth for the foreign-born population - India (%)
Place of birth for the foreign-born population - Iran (%)
Place of birth for the foreign-born population - Kazakhstan (%)
Place of birth for the foreign-born population - Nepal (%)
Place of birth for the foreign-born population - Pakistan (%)
Place of birth for the foreign-born population - Sri Lanka (%)
Place of birth for the foreign-born population - Uzbekistan (%)
Place of birth for the foreign-born population - Other South Central Asia (%)
Place of birth for the foreign-born population - Burma (%)
Place of birth for the foreign-born population - Cambodia (%)
Place of birth for the foreign-born population - Indonesia (%)
Place of birth for the foreign-born population - Laos (%)
Place of birth for the foreign-born population - Malaysia (%)
Place of birth for the foreign-born population - Philippines (%)
Place of birth for the foreign-born population - Singapore (%)
Place of birth for the foreign-born population - Thailand (%)
Place of birth for the foreign-born population - Vietnam (%)
Place of birth for the foreign-born population - Other South Eastern Asia (%)
Place of birth for the foreign-born population - Armenia (%)
Place of birth for the foreign-born population - Iraq (%)
Place of birth for the foreign-born population - Israel (%)
Place of birth for the foreign-born population - Jordan (%)
Place of birth for the foreign-born population - Kuwait (%)
Place of birth for the foreign-born population - Lebanon (%)
Place of birth for the foreign-born population - Saudi Arabia (%)
Place of birth for the foreign-born population - Syria (%)
Place of birth for the foreign-born population - Turkey (%)
Place of birth for the foreign-born population - Yemen (%)
Place of birth for the foreign-born population - Other Western Asia (%)
Place of birth for the foreign-born population - Eritrea (%)
Place of birth for the foreign-born population - Ethiopia (%)
Place of birth for the foreign-born population - Kenya (%)
Place of birth for the foreign-born population - Somalia (%)
Place of birth for the foreign-born population - Uganda (%)
Place of birth for the foreign-born population - Zimbabwe (%)
Place of birth for the foreign-born population - Other Eastern Africa (%)
Place of birth for the foreign-born population - Cameroon (%)
Place of birth for the foreign-born population - Congo (%)
Place of birth for the foreign-born population - Democratic Republic of Congo (Zaire) (%)
Place of birth for the foreign-born population - Other Middle Africa (%)
Place of birth for the foreign-born population - Egypt (%)
Place of birth for the foreign-born population - Morocco (%)
Place of birth for the foreign-born population - Sudan (%)
Place of birth for the foreign-born population - Other Northern Africa (%)
Place of birth for the foreign-born population - South Africa (%)
Place of birth for the foreign-born population - Other Southern Africa (%)
Place of birth for the foreign-born population - Cabo Verde (%)
Place of birth for the foreign-born population - Ghana (%)
Place of birth for the foreign-born population - Liberia (%)
Place of birth for the foreign-born population - Nigeria (%)
Place of birth for the foreign-born population - Senegal (%)
Place of birth for the foreign-born population - Sierra Leone (%)
Place of birth for the foreign-born population - Other Western Africa (%)
Place of birth for the foreign-born population - Australia (%)
Place of birth for the foreign-born population - New Zealand (%)
Place of birth for the foreign-born population - Fiji (%)
Place of birth for the foreign-born population - Micronesia (%)
Place of birth for the foreign-born population - Bahamas (%)
Place of birth for the foreign-born population - Barbados (%)
Place of birth for the foreign-born population - Cuba (%)
Place of birth for the foreign-born population - Dominica (%)
Place of birth for the foreign-born population - Dominican Republic (%)
Place of birth for the foreign-born population - Grenada (%)
Place of birth for the foreign-born population - Haiti (%)
Place of birth for the foreign-born population - Jamaica (%)
Place of birth for the foreign-born population - St. Vincent and the Grenadines (%)
Place of birth for the foreign-born population - Trinidad and Tobago (%)
Place of birth for the foreign-born population - West Indies (%)
Place of birth for the foreign-born population - Other Caribbean (%)
Place of birth for the foreign-born population - Belize (%)
Place of birth for the foreign-born population - Costa Rica (%)
Place of birth for the foreign-born population - El Salvador (%)
Place of birth for the foreign-born population - Guatemala (%)
Place of birth for the foreign-born population - Honduras (%)
Place of birth for the foreign-born population - Mexico (%)
Place of birth for the foreign-born population - Nicaragua (%)
Place of birth for the foreign-born population - Panama (%)
Place of birth for the foreign-born population - Other Central America (%)
Place of birth for the foreign-born population - Argentina (%)
Place of birth for the foreign-born population - Bolivia (%)
Place of birth for the foreign-born population - Brazil (%)
Place of birth for the foreign-born population - Chile (%)
Place of birth for the foreign-born population - Colombia (%)
Place of birth for the foreign-born population - Ecuador (%)
Place of birth for the foreign-born population - Guyana (%)
Place of birth for the foreign-born population - Peru (%)
Place of birth for the foreign-born population - Uruguay (%)
Place of birth for the foreign-born population - Venezuela (%)
Place of birth for the foreign-born population - Other South America (%)
Place of birth for the foreign-born population - Canada (%)
Place of birth for the foreign-born population - Other Northern America (%)
Place of birth for the foreign-born population - Other (%)
Latest news about races in Horsham, PA collected exclusively by city-data.com from local newspapers, TV, and radio stations
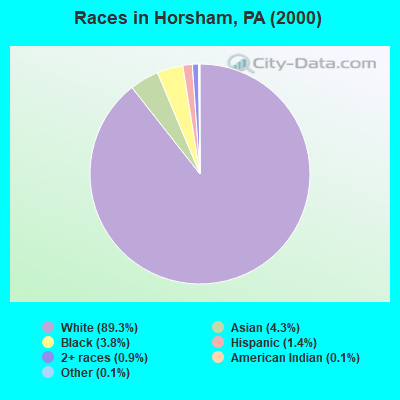
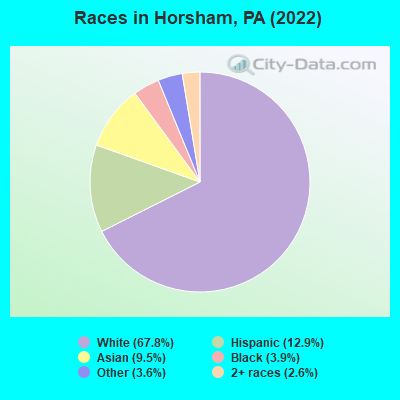
According to 2022 data, the most numerous races in Horsham, PA are White alone (10,734 residents), Black alone (624 residents), and Hispanic (2,042 residents). 79.9% of Horsham residents speak English at home. 16.5% of Horsham, PA residents are foreign-born (7.8% born in Latin America, 6.7% born in Asia), which is 57.6% greater than the foreign-born rate of 7.0% across the entire state of Pennsylvania.
Race distribution in Horsham
2000 2022
10,322,455 84.1% White alone 1,202,437 9.8% Black alone 394,088 3.2% Hispanic 218,296 1.8% Asian alone 113,097 0.9% Two or more races 13,086 0.1% Other race alone 14,904 0.1% American Indian alone 2,691 0.02% Native Hawaiian and Other
9,487,228 73.1% White alone 1,311,581 10.1% Black alone 1,115,997 8.6% Hispanic 493,942 3.8% Two or more races 487,124 3.8% Asian alone 63,582 0.5% Other race alone 10,130 0.08% American Indian alone 2,424 0.02% Native Hawaiian and Other
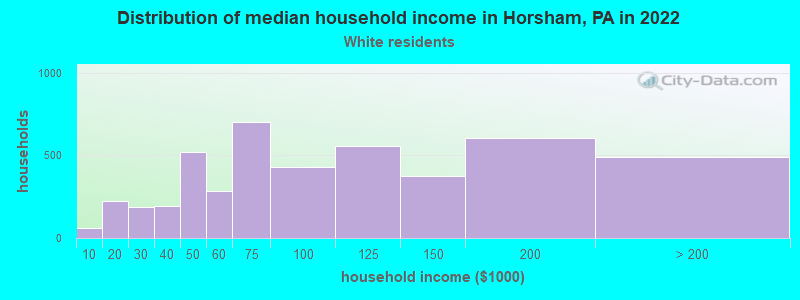
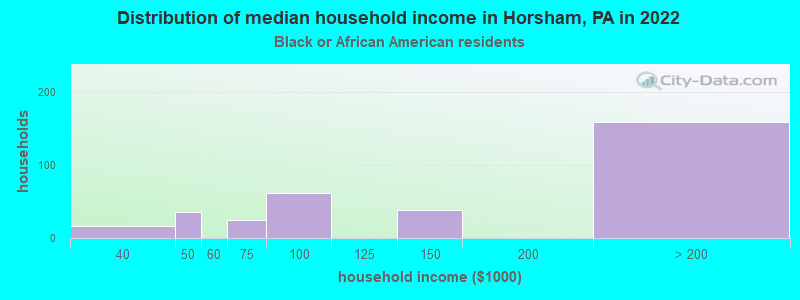
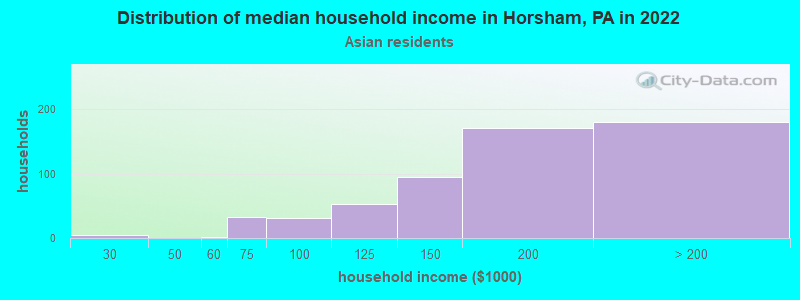
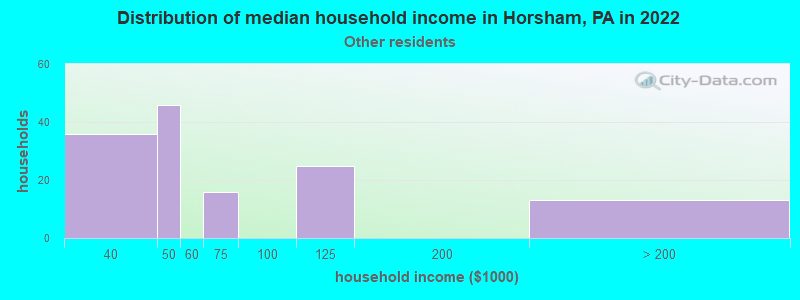
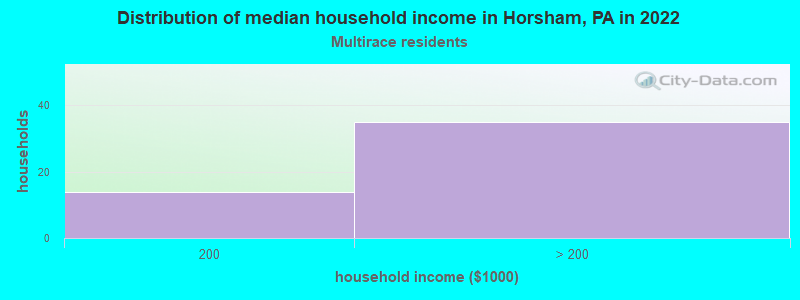
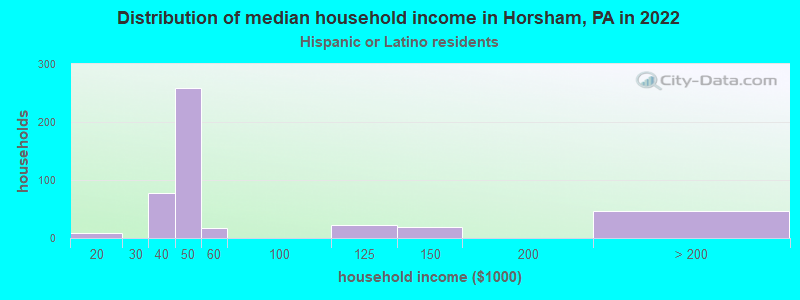
Income and house value in Horsham Median household income in 2022 $90,765 White non-Hispanic householders$187,581 Asian householdersover $200,000 Two or more races householders$45,999 Hispanic or Latino race householdersMedian 2022 house value $383,724 White Non-Hispanic householders$373,065 Black or African American householders $353,307 Asian householders$487,455 Some other race householders$316,910 Two or more races householders$258,156 Hispanic or Latino householders
Median age by race in Horsham
36.6 Median age for White residents36.4 37.9 32.7 Median age for Black or African American residents24.8 51.6 -626,180,836.1 Median age for American Indian / Alaska Native residents-1,098,934,549.9 -577,519,379.3 39.4 Median age for Asian residents43.0 35.4 -680,432,644.4 Median age for Native Hawaiian / Pacific Islander residents-649,523,808.9 -747,474,746.7 26.1 Median age for Other race residents56.6 22.9 17.3 Median age for Two or more races residents17.7 12.7 39.7 Median age for White alone residents38.8 41.2 26.3 Median age for Hispanic or Latino residents26.1 18.1
Owner/renter occupied households by race in Horsham
House owners and renters - White residents 3,328 71.3% Owner occupied1,339 28.7% Renter occupiedHouse owners and renters - Black or African American residents 160 46.8% Owner occupied181 53.2% Renter occupiedHouse owners and renters - Asian residents 361 63.3% Owner occupied209 36.7% Renter occupiedHouse owners and renters - Other race residents 48 44.0% Owner occupied61 56.0% Renter occupiedHouse owners and renters - Two or more races residents 50 100.0% Owner occupiedHouse owners and renters - White alone residents 3,299 76.3% Owner occupied1,026 23.7% Renter occupiedHouse owners and renters - Hispanic or Latino residents 86 18.9% Owner occupied368 81.1% Renter occupied
Language usage in Horsham
English speakers - Total 79.9% of residents of Horsham speak English at home.
10.6% of residents speak Spanish at home 1,150 72.0% Speak English very well447 28.0% Speak English less than very well9.4% of residents speak other language at home 1,017 71.2% Speak English very well411 28.8% Speak English less than very well
English speakers - Born in the United States 93.4% of residents of Horsham speak English at home.
0.3% of residents speak Spanish at home 8 100.0% Speak English very well6.2% of residents speak other language at home 31 20.4% Speak English very well121 79.6% Speak English less than very well
English speakers - Native, born elsewhere 56.7% of residents of Horsham speak English at home.
37.3% of residents speak Spanish at home 25 50.0% Speak English very well25 50.0% Speak English less than very well
English speakers - Foreign-born 21.6% of residents of Horsham speak English at home.
32.6% of residents speak Spanish at home 484 59.2% Speak English very well333 40.8% Speak English less than very well43.7% of residents speak other language at home 820 74.9% Speak English very well275 25.1% Speak English less than very well
White (Caucasian) - Speak only English Native:
93.3% (10,015)Foreign-born:
12.9% (117)
White (Caucasian) - Speak another language Native:
6.2% (669)Foreign-born:
84.9% (768)
Black or African American - Speak another language Native:
0.9% (6)Foreign-born:
90.9% (12)
Asian - Speak only English Native:
45.7% (194)Foreign-born:
7.2% (65)
Asian - Speak another language Native:
54.1% (230)Foreign-born:
92.4% (843)
Other race - Speak only English Native:
73.6% (231)Foreign-born:
80.9% (479)
Other race - Speak another language Native:
7.9% (25)Foreign-born:
37.4% (221)
Two or more races - Speak only English Native:
96.5% (398)Foreign-born:
40.7% (22)
Two or more races - Speak another language Native:
1.7% (7)Foreign-born:
58.7% (32)
White alone - Speak only English Native:
98.9% (9,817)Foreign-born:
33.8% (120)
White alone - Speak another language Native:
1.0% (103)Foreign-born:
66.3% (235)
Hispanic or Latino - Speak another language Native:
67.7% (741)Foreign-born:
100.0% (884)
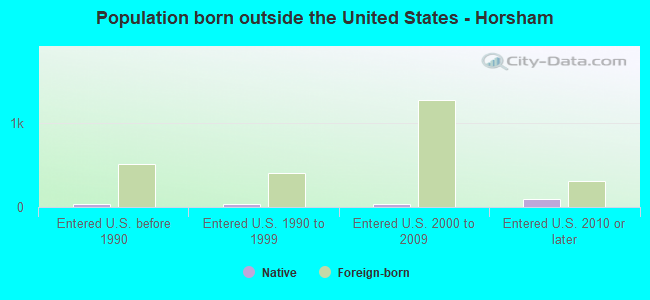
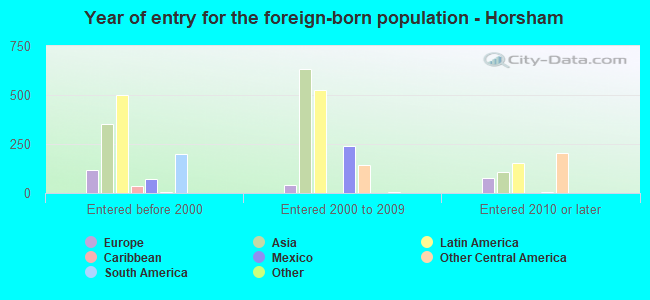
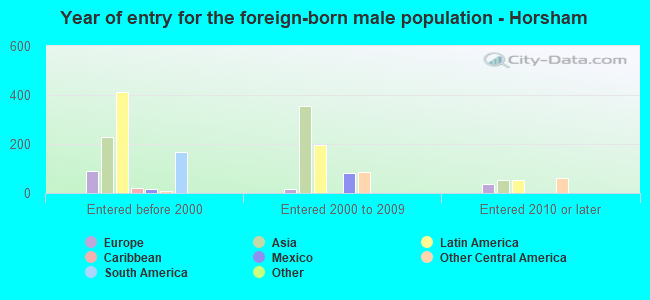
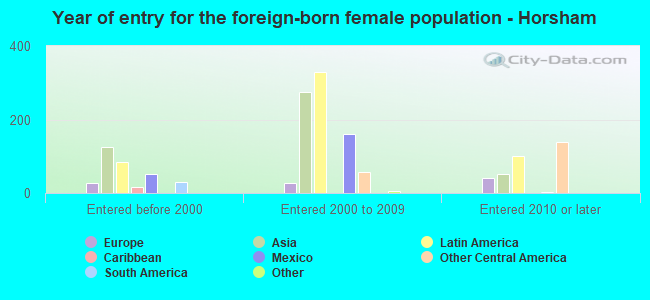
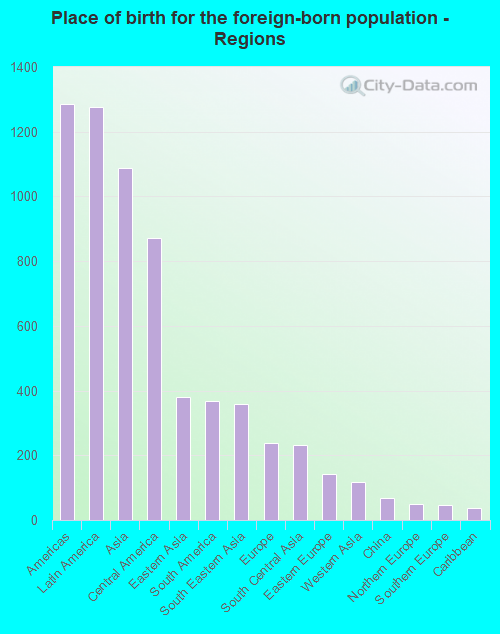
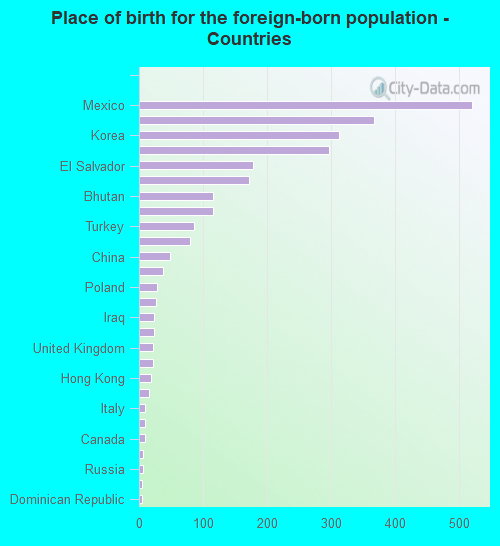
Foreign-born residents in Horsham 2,615 residents are foreign born (7.8% Latin America , 6.7% Asia ).
This city:
16.5%Pennsylvania:
7.3%
Marital status for residents in Horsham Marital status - White (Caucasian) population 15 years and over
Males 31.3% Never married56.0% Now married3.9% Separated3.5% Widowed5.3% DivorcedFemales 31.7% Never married47.9% Now married1.6% Separated7.5% Widowed11.4% DivorcedWomen who gave birth in the past 12 months Now married:
100.0% (73)Unmarried:
0.0% (0)
Women who did not give birth in the past 12 months Now married:
43.1% (1,221)Unmarried:
56.9% (1,613)
Marital status - Black or African American population 15 years and over
Males 79.1% Never married7.4% Now married2.0% Separated0.4% Widowed11.1% DivorcedFemales 30.1% Never married37.6% Now married0.0% Separated0.0% Widowed32.3% DivorcedWomen who did not give birth in the past 12 months Now married:
49.7% (92)Unmarried:
50.3% (93)
Marital status - Asian population 15 years and over
Males 29.6% Never married67.4% Now married3.0% Separated0.0% Widowed0.0% DivorcedFemales 29.0% Never married63.4% Now married0.0% Separated0.0% Widowed7.6% DivorcedWomen who did not give birth in the past 12 months Now married:
47.8% (164)Unmarried:
52.2% (179)
Marital status - Other race population 15 years and over
Males 24.6% Never married75.4% Now married0.0% Separated0.0% Widowed0.0% DivorcedFemales 88.6% Never married9.1% Now married0.0% Separated2.3% Widowed0.0% DivorcedWomen who did not give birth in the past 12 months Now married:
0.0% (0)Unmarried:
100.0% (246)
Marital status - Two or more races population 15 years and over
Males 65.7% Never married34.3% Now married0.0% Separated0.0% Widowed0.0% DivorcedFemales 22.5% Never married73.0% Now married0.0% Separated4.5% Widowed0.0% DivorcedWomen who did not give birth in the past 12 months Now married:
74.0% (96)Unmarried:
26.0% (34)
Marital status - White alone, not Hispanic / Latino population 15 years and over
Males 31.7% Never married54.2% Now married4.3% Separated3.9% Widowed5.9% DivorcedFemales 33.3% Never married45.1% Now married1.7% Separated7.9% Widowed12.1% DivorcedWomen who gave birth in the past 12 months Now married:
100.0% (74)Unmarried:
0.0% (0)
Women who did not give birth in the past 12 months Now married:
36.4% (911)Unmarried:
63.6% (1,592)
Marital status - Hispanic or Latino population 15 years and over
Males 34.6% Never married65.4% Now married0.0% Separated0.0% Widowed0.0% DivorcedFemales 26.4% Never married67.3% Now married0.0% Separated3.7% Widowed2.6% DivorcedWomen who did not give birth in the past 12 months Now married:
71.4% (357)Unmarried:
28.6% (143)
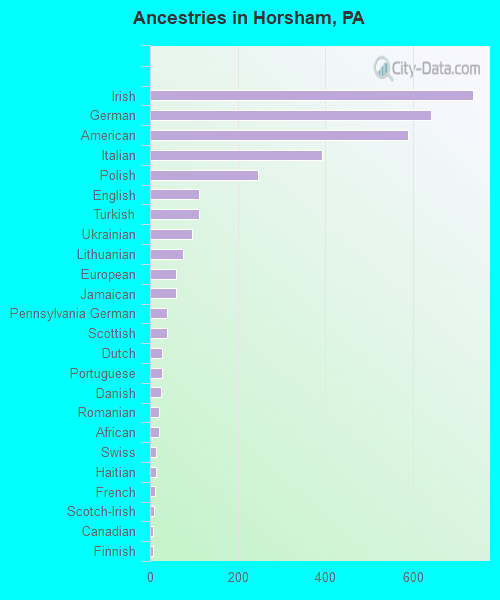
Ancestries in Horsham
736 11.4% Irish640 9.9% German589 9.1% American393 6.1% Italian246 3.8% Polish111 1.7% English111 1.7% Turkish95 1.5% Ukrainian75 1.2% Lithuanian60 0.9% European60 0.9% Jamaican38 0.6% Pennsylvania German38 0.6% Scottish28 0.4% Dutch28 0.4% Portuguese24 0.4% Danish21 0.3% Romanian20 0.3% African13 0.2% Swiss13 0.2% Haitian11 0.2% French9 0.1% Scotch-Irish7 0.1% Canadian7 0.1% Finnish5 0.08% Lebanese
Children Nativity (place of birth) in Horsham
Children under 6 years - Living with two parents Both parents native 613 100.0% Native0 0.0% Foreign-bornBoth parents foreign-born 133 99.2% Native1 0.8% Foreign-bornOne native, one foreign-born parent 13 100.0% NativeChildren under 6 years - Living with one parent Native parent 61 100.0% NativeForeign-born parent 61 100.0% NativeChildren 6 to 17 years - Living with two parents Both parents native 1,130 100.0% NativeBoth parents foreign-born 571 99.2% Native5 0.8% Foreign-bornOne native, one foreign-born parent 85 100.0% NativeChildren 6 to 17 years - Living with one parent Native parent 746 100.0% NativeForeign-born parent 348 65.0% Native187 35.0% Foreign-born
Grandparents responsible for own grandchildren in Horsham
Grandparents (30 to 59 years) Asian 21 100.0% Not responsible for grandchildren
Grandparents (60 years and over) Asian 180 100.0% Not responsible for grandchildren