Races in Horizon West, Florida (FL) Detailed Stats
Data:
Races - White alone (%)
Races - White alone (% change since 2000)
Races - Black alone (%)
Races - Black alone (% change since 2000)
Races - American Indian alone (%)
Races - American Indian alone (% change since 2000)
Races - Asian alone (%)
Races - Asian alone (% change since 2000)
Races - Hispanic (%)
Races - Hispanic (% change since 2000)
Races - Native Hawaiian and Other Pacific Islander alone (%)
Races - Native Hawaiian and Other Pacific Islander alone (% change since 2000)
Races - Two or more races(%)
Races - Two or more races(% change since 2000)
Races - Other race alone (%)
Races - Other race alone (% change since 2000)
Racial diversity
Place of birth - Born in state of residence (%)
Place of birth - Born in state of residence (%) - White
Place of birth - Born in state of residence (%) - Black or African American
Place of birth - Born in state of residence (%) - Asian
Place of birth - Born in state of residence (%) - Hispanic or Latino
Place of birth - Born in state of residence (%) - American Indian and Alaska Native
Place of birth - Born in state of residence (%) - Multirace
Place of birth - Born in state of residence (%) - Other Race
Place of birth - Born in other state (%)
Place of birth - Born in other state (%) - White
Place of birth - Born in other state (%) - Black or African American
Place of birth - Born in other state (%) - Asian
Place of birth - Born in other state (%) - Hispanic or Latino
Place of birth - Born in other state (%) - American Indian and Alaska Native
Place of birth - Born in other state (%) - Multirace
Place of birth - Born in other state (%) - Other Race
Place of birth - Native, outside of US (%)
Place of birth - Native, outside of US (%) - White
Place of birth - Native, outside of US (%) - Black or African American
Place of birth - Native, outside of US (%) - Asian
Place of birth - Native, outside of US (%) - Hispanic or Latino
Place of birth - Native, outside of US (%) - American Indian and Alaska Native
Place of birth - Native, outside of US (%) - Multirace
Place of birth - Native, outside of US (%) - Other Race
Place of birth - Foreign born (%)
Place of birth - Foreign born (%) - White
Place of birth - Foreign born (%) - Black or African American
Place of birth - Foreign born (%) - Asian
Place of birth - Foreign born (%) - Hispanic or Latino
Place of birth - Foreign born (%) - American Indian and Alaska Native
Place of birth - Foreign born (%) - Multirace
Place of birth - Foreign born (%) - Other Race
Residents speaking English at home (%)
Residents speaking English at home - Born in the United States (%)
Residents speaking English at home - Native, born elsewhere (%)
Residents speaking English at home - Foreign born (%)
Residents speaking Spanish at home (%)
Residents speaking Spanish at home - Born in the United States (%)
Residents speaking Spanish at home - Native, born elsewhere (%)
Residents speaking Spanish at home - Foreign born (%)
Residents speaking other language at home (%)
Residents speaking other language at home - Born in the United States (%)
Residents speaking other language at home - Native, born elsewhere (%)
Residents speaking other language at home - Foreign born (%)
Marital status - Never married (%)
Marital status - Now married (%)
Marital status - Separated (%)
Marital status - Widowed (%)
Marital status - Divorced (%)
Ancestries Reported - Arab (%)
Ancestries Reported - Czech (%)
Ancestries Reported - Danish (%)
Ancestries Reported - Dutch (%)
Ancestries Reported - English (%)
Ancestries Reported - French (%)
Ancestries Reported - French Canadian (%)
Ancestries Reported - German (%)
Ancestries Reported - Greek (%)
Ancestries Reported - Hungarian (%)
Ancestries Reported - Irish (%)
Ancestries Reported - Italian (%)
Ancestries Reported - Lithuanian (%)
Ancestries Reported - Norwegian (%)
Ancestries Reported - Polish (%)
Ancestries Reported - Portuguese (%)
Ancestries Reported - Russian (%)
Ancestries Reported - Scotch-Irish (%)
Ancestries Reported - Scottish (%)
Ancestries Reported - Slovak (%)
Ancestries Reported - Subsaharan African (%)
Ancestries Reported - Swedish (%)
Ancestries Reported - Swiss (%)
Ancestries Reported - Ukrainian (%)
Ancestries Reported - United States (%)
Ancestries Reported - Welsh (%)
Ancestries Reported - West Indian (%)
Ancestries Reported - Other (%)
Geographical mobility - Same house 1 year ago (%)
Geographical mobility - Same house 1 year ago (%) - White
Geographical mobility - Same house 1 year ago (%) - Black or African American
Geographical mobility - Same house 1 year ago (%) - Asian
Geographical mobility - Same house 1 year ago (%) - Hispanic or Latino
Geographical mobility - Same house 1 year ago (%) - American Indian and Alaska Native
Geographical mobility - Same house 1 year ago (%) - Multirace
Geographical mobility - Same house 1 year ago (%) - Other Race
Geographical mobility - Moved within same county (%)
Geographical mobility - Moved within same county (%) - White
Geographical mobility - Moved within same county (%) - Black or African American
Geographical mobility - Moved within same county (%) - Asian
Geographical mobility - Moved within same county (%) - Hispanic or Latino
Geographical mobility - Moved within same county (%) - American Indian and Alaska Native
Geographical mobility - Moved within same county (%) - Multirace
Geographical mobility - Moved within same county (%) - Other Race
Geographical mobility - Moved from different county within same state (%)
Geographical mobility - Moved from different county within same state (%) - White
Geographical mobility - Moved from different county within same state (%) - Black or African American
Geographical mobility - Moved from different county within same state (%) - Asian
Geographical mobility - Moved from different county within same state (%) - Hispanic or Latino
Geographical mobility - Moved from different county within same state (%) - American Indian and Alaska Native
Geographical mobility - Moved from different county within same state (%) - Multirace
Geographical mobility - Moved from different county within same state (%) - Other Race
Geographical mobility - Moved from different state (%)
Geographical mobility - Moved from different state (%) - White
Geographical mobility - Moved from different state (%) - Black or African American
Geographical mobility - Moved from different state (%) - Asian
Geographical mobility - Moved from different state (%) - Hispanic or Latino
Geographical mobility - Moved from different state (%) - American Indian and Alaska Native
Geographical mobility - Moved from different state (%) - Multirace
Geographical mobility - Moved from different state (%) - Other Race
Geographical mobility - Moved from abroad (%)
Geographical mobility - Moved from abroad (%) - White
Geographical mobility - Moved from abroad (%) - Black or African American
Geographical mobility - Moved from abroad (%) - Asian
Geographical mobility - Moved from abroad (%) - Hispanic or Latino
Geographical mobility - Moved from abroad (%) - American Indian and Alaska Native
Geographical mobility - Moved from abroad (%) - Multirace
Geographical mobility - Moved from abroad (%) - Other Race
Place of birth for the foreign-born population - Ireland (%)
Place of birth for the foreign-born population - Denmark (%)
Place of birth for the foreign-born population - Norway (%)
Place of birth for the foreign-born population - Sweden (%)
Place of birth for the foreign-born population - United Kingdom (%)
Place of birth for the foreign-born population - England (%)
Place of birth for the foreign-born population - Scotland (%)
Place of birth for the foreign-born population - Other Northern Europe (%)
Place of birth for the foreign-born population - Austria (%)
Place of birth for the foreign-born population - Belgium (%)
Place of birth for the foreign-born population - France (%)
Place of birth for the foreign-born population - Germany (%)
Place of birth for the foreign-born population - Netherlands (%)
Place of birth for the foreign-born population - Switzerland (%)
Place of birth for the foreign-born population - Other Western Europe (%)
Place of birth for the foreign-born population - Greece (%)
Place of birth for the foreign-born population - Italy (%)
Place of birth for the foreign-born population - Portugal (%)
Place of birth for the foreign-born population - Spain (%)
Place of birth for the foreign-born population - Other Southern Europe (%)
Place of birth for the foreign-born population - Albania (%)
Place of birth for the foreign-born population - Belarus (%)
Place of birth for the foreign-born population - Bosnia and Herzegovina (%)
Place of birth for the foreign-born population - Bulgaria (%)
Place of birth for the foreign-born population - Croatia (%)
Place of birth for the foreign-born population - Czechoslovakia (%)
Place of birth for the foreign-born population - Hungary (%)
Place of birth for the foreign-born population - Latvia (%)
Place of birth for the foreign-born population - Lithuania (%)
Place of birth for the foreign-born population - North Macedonia (Macedonia) (%)
Place of birth for the foreign-born population - Moldova (%)
Place of birth for the foreign-born population - Poland (%)
Place of birth for the foreign-born population - Romania (%)
Place of birth for the foreign-born population - Russia (%)
Place of birth for the foreign-born population - Serbia (%)
Place of birth for the foreign-born population - Ukraine (%)
Place of birth for the foreign-born population - Other Eastern Europe (%)
Place of birth for the foreign-born population - China (%)
Place of birth for the foreign-born population - Hong Kong (%)
Place of birth for the foreign-born population - Taiwan (%)
Place of birth for the foreign-born population - Japan (%)
Place of birth for the foreign-born population - Korea (%)
Place of birth for the foreign-born population - Other Eastern Asia (%)
Place of birth for the foreign-born population - Afghanistan (%)
Place of birth for the foreign-born population - Bangladesh (%)
Place of birth for the foreign-born population - India (%)
Place of birth for the foreign-born population - Iran (%)
Place of birth for the foreign-born population - Kazakhstan (%)
Place of birth for the foreign-born population - Nepal (%)
Place of birth for the foreign-born population - Pakistan (%)
Place of birth for the foreign-born population - Sri Lanka (%)
Place of birth for the foreign-born population - Uzbekistan (%)
Place of birth for the foreign-born population - Other South Central Asia (%)
Place of birth for the foreign-born population - Burma (%)
Place of birth for the foreign-born population - Cambodia (%)
Place of birth for the foreign-born population - Indonesia (%)
Place of birth for the foreign-born population - Laos (%)
Place of birth for the foreign-born population - Malaysia (%)
Place of birth for the foreign-born population - Philippines (%)
Place of birth for the foreign-born population - Singapore (%)
Place of birth for the foreign-born population - Thailand (%)
Place of birth for the foreign-born population - Vietnam (%)
Place of birth for the foreign-born population - Other South Eastern Asia (%)
Place of birth for the foreign-born population - Armenia (%)
Place of birth for the foreign-born population - Iraq (%)
Place of birth for the foreign-born population - Israel (%)
Place of birth for the foreign-born population - Jordan (%)
Place of birth for the foreign-born population - Kuwait (%)
Place of birth for the foreign-born population - Lebanon (%)
Place of birth for the foreign-born population - Saudi Arabia (%)
Place of birth for the foreign-born population - Syria (%)
Place of birth for the foreign-born population - Turkey (%)
Place of birth for the foreign-born population - Yemen (%)
Place of birth for the foreign-born population - Other Western Asia (%)
Place of birth for the foreign-born population - Eritrea (%)
Place of birth for the foreign-born population - Ethiopia (%)
Place of birth for the foreign-born population - Kenya (%)
Place of birth for the foreign-born population - Somalia (%)
Place of birth for the foreign-born population - Uganda (%)
Place of birth for the foreign-born population - Zimbabwe (%)
Place of birth for the foreign-born population - Other Eastern Africa (%)
Place of birth for the foreign-born population - Cameroon (%)
Place of birth for the foreign-born population - Congo (%)
Place of birth for the foreign-born population - Democratic Republic of Congo (Zaire) (%)
Place of birth for the foreign-born population - Other Middle Africa (%)
Place of birth for the foreign-born population - Egypt (%)
Place of birth for the foreign-born population - Morocco (%)
Place of birth for the foreign-born population - Sudan (%)
Place of birth for the foreign-born population - Other Northern Africa (%)
Place of birth for the foreign-born population - South Africa (%)
Place of birth for the foreign-born population - Other Southern Africa (%)
Place of birth for the foreign-born population - Cabo Verde (%)
Place of birth for the foreign-born population - Ghana (%)
Place of birth for the foreign-born population - Liberia (%)
Place of birth for the foreign-born population - Nigeria (%)
Place of birth for the foreign-born population - Senegal (%)
Place of birth for the foreign-born population - Sierra Leone (%)
Place of birth for the foreign-born population - Other Western Africa (%)
Place of birth for the foreign-born population - Australia (%)
Place of birth for the foreign-born population - New Zealand (%)
Place of birth for the foreign-born population - Fiji (%)
Place of birth for the foreign-born population - Micronesia (%)
Place of birth for the foreign-born population - Bahamas (%)
Place of birth for the foreign-born population - Barbados (%)
Place of birth for the foreign-born population - Cuba (%)
Place of birth for the foreign-born population - Dominica (%)
Place of birth for the foreign-born population - Dominican Republic (%)
Place of birth for the foreign-born population - Grenada (%)
Place of birth for the foreign-born population - Haiti (%)
Place of birth for the foreign-born population - Jamaica (%)
Place of birth for the foreign-born population - St. Vincent and the Grenadines (%)
Place of birth for the foreign-born population - Trinidad and Tobago (%)
Place of birth for the foreign-born population - West Indies (%)
Place of birth for the foreign-born population - Other Caribbean (%)
Place of birth for the foreign-born population - Belize (%)
Place of birth for the foreign-born population - Costa Rica (%)
Place of birth for the foreign-born population - El Salvador (%)
Place of birth for the foreign-born population - Guatemala (%)
Place of birth for the foreign-born population - Honduras (%)
Place of birth for the foreign-born population - Mexico (%)
Place of birth for the foreign-born population - Nicaragua (%)
Place of birth for the foreign-born population - Panama (%)
Place of birth for the foreign-born population - Other Central America (%)
Place of birth for the foreign-born population - Argentina (%)
Place of birth for the foreign-born population - Bolivia (%)
Place of birth for the foreign-born population - Brazil (%)
Place of birth for the foreign-born population - Chile (%)
Place of birth for the foreign-born population - Colombia (%)
Place of birth for the foreign-born population - Ecuador (%)
Place of birth for the foreign-born population - Guyana (%)
Place of birth for the foreign-born population - Peru (%)
Place of birth for the foreign-born population - Uruguay (%)
Place of birth for the foreign-born population - Venezuela (%)
Place of birth for the foreign-born population - Other South America (%)
Place of birth for the foreign-born population - Canada (%)
Place of birth for the foreign-born population - Other Northern America (%)
Place of birth for the foreign-born population - Other (%)
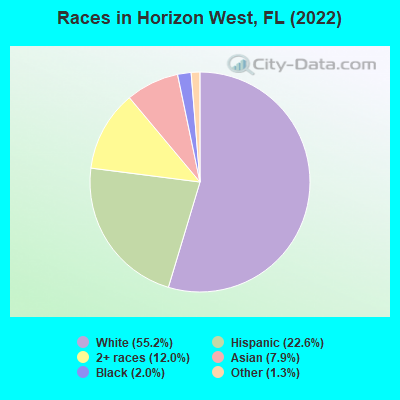
According to 2022 data, the most numerous races in Horizon West, FL are White alone (32,898 residents), Hispanic (13,448 residents), and Black alone (1,164 residents). 65.3% of Horizon West residents speak English at home.
Race distribution in Horizon West 32,898 55.2% White alone 13,448 22.6% Hispanic 7,162 12.0% Two or more races 4,698 7.9% Asian alone 1,164 2.0% Black alone 753 1.3% Other race alone 10 0.02% American Indian alone
2000 2022
10,458,509 65.4% White alone 2,682,715 16.8% Hispanic 2,264,268 14.2% Black alone 261,693 1.6% Asian alone 236,954 1.5% Two or more races 42,358 0.3% American Indian alone 28,994 0.2% Other race alone 6,887 0.04% Native Hawaiian and Other
11,309,403 50.8% White alone 6,025,039 27.1% Hispanic 3,241,015 14.6% Black alone 861,630 3.9% Two or more races 623,692 2.8% Asian alone 152,054 0.7% Other race alone 22,504 0.1% American Indian alone 9,486 0.04% Native Hawaiian and Other
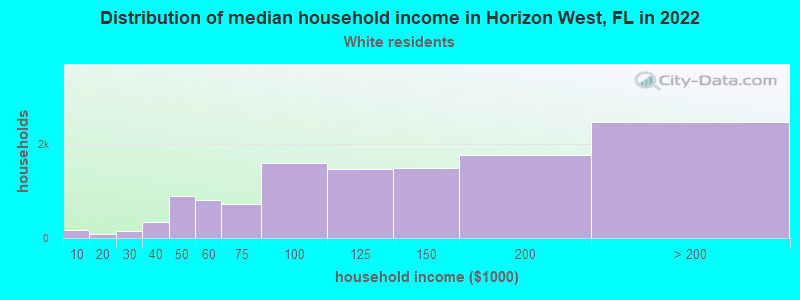
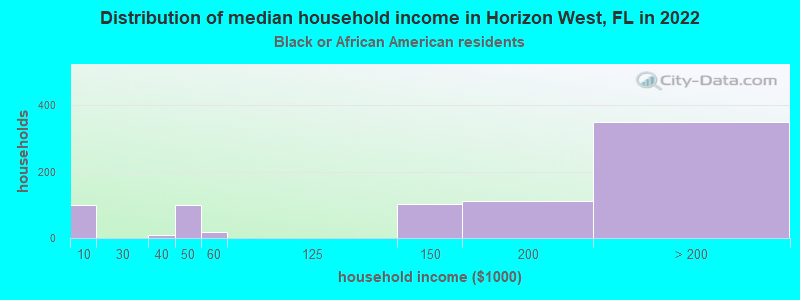
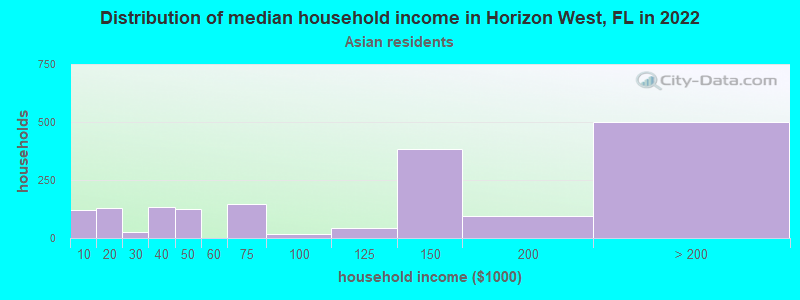
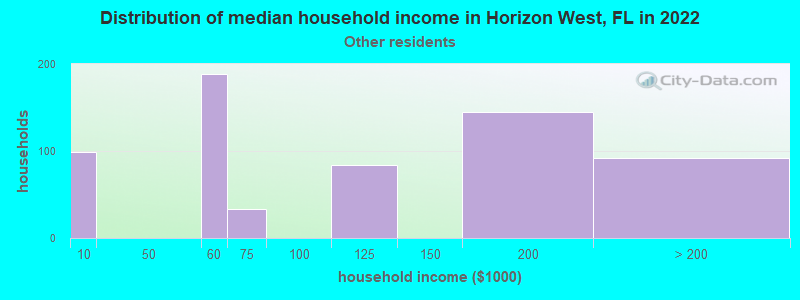
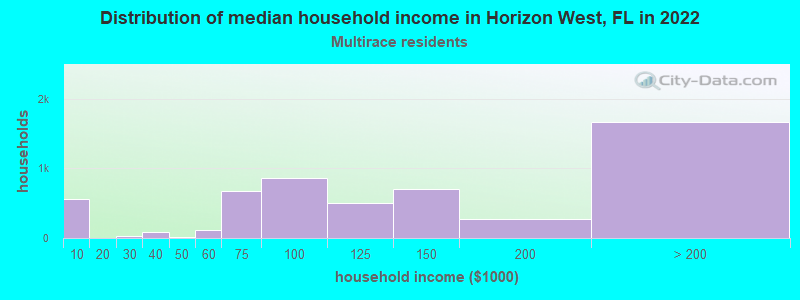
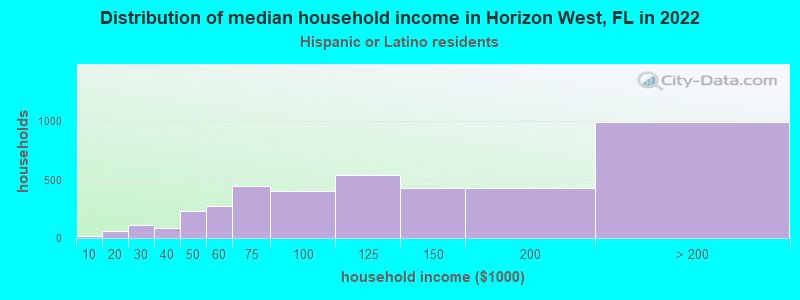
Income and house value in Horizon West Median household income in 2022 $111,456 White non-Hispanic householders$139,250 Black householders$116,653 Asian householders$112,945 Two or more races householders$117,484 Hispanic or Latino race householders
Median age by race in Horizon West
37.0 Median age for White residents39.7 34.1 38.2 Median age for Black or African American residents41.1 36.5 36.4 Median age for American Indian / Alaska Native residents-735,632,183.2 31.4 43.4 Median age for Asian residents43.0 42.7 -679,790,025.6 Median age for Native Hawaiian / Pacific Islander residents-1,327,635,326.3 -611,111,110.5 30.7 Median age for Other race residents32.8 30.1 31.2 Median age for Two or more races residents33.5 27.3 36.3 Median age for White alone residents38.4 33.7 33.7 Median age for Hispanic or Latino residents33.4 34.5
Owner/renter occupied households by race in Horizon West
House owners and renters - White residents 8,186 69.5% Owner occupied3,597 30.5% Renter occupiedHouse owners and renters - Black or African American residents 675 88.5% Owner occupied88 11.5% Renter occupiedHouse owners and renters - American Indian / Alaska Native residents 18 100.0% Owner occupiedHouse owners and renters - Asian residents 1,648 91.5% Owner occupied153 8.5% Renter occupiedHouse owners and renters - Other race residents 428 65.9% Owner occupied221 34.1% Renter occupiedHouse owners and renters - Two or more races residents 2,591 48.9% Owner occupied2,713 51.1% Renter occupiedHouse owners and renters - White alone residents 8,327 68.7% Owner occupied3,790 31.3% Renter occupiedHouse owners and renters - Hispanic or Latino residents 2,005 51.0% Owner occupied1,924 49.0% Renter occupied
Language usage in Horizon West
English speakers - Total 65.3% of residents of Horizon West speak English at home.
14.9% of residents speak Spanish at home 5,891 72.1% Speak English very well2,283 27.9% Speak English less than very well20.6% of residents speak other language at home 6,441 56.8% Speak English very well4,908 43.2% Speak English less than very well
English speakers - Born in the United States 88.2% of residents of Horizon West speak English at home.
7.2% of residents speak Spanish at home 1,851 96.8% Speak English very well61 3.2% Speak English less than very well4.3% of residents speak other language at home 901 78.4% Speak English very well248 21.6% Speak English less than very well
English speakers - Native, born elsewhere 39.7% of residents of Horizon West speak English at home.
37.5% of residents speak Spanish at home 535 66.1% Speak English very well274 33.9% Speak English less than very well33.7% of residents speak other language at home 199 27.4% Speak English very well528 72.6% Speak English less than very well
English speakers - Foreign-born 15.4% of residents of Horizon West speak English at home.
31.0% of residents speak Spanish at home 2,845 58.6% Speak English very well2,012 41.4% Speak English less than very well53.6% of residents speak other language at home 4,093 48.7% Speak English very well4,312 51.3% Speak English less than very well
White (Caucasian) - Speak only English Native:
98.2% (25,358)Foreign-born:
24.1% (688)
White (Caucasian) - Speak another language Native:
5.9% (1,524)Foreign-born:
76.8% (2,193)
Black or African American - Speak only English Native:
87.6% (1,033)Foreign-born:
49.5% (65)
Black or African American - Speak another language Native:
12.6% (148)Foreign-born:
50.9% (67)
American Indian / Alaska Native - Speak another language Native:
78.2% (282)Foreign-born:
93.5% (42)
Asian - Speak only English Native:
28.4% (249)Foreign-born:
31.4% (1,169)
Asian - Speak another language Native:
66.0% (578)Foreign-born:
69.4% (2,586)
Other race - Speak only English Native:
48.1% (633)Foreign-born:
1.9% (26)
Other race - Speak another language Native:
54.1% (712)Foreign-born:
100.0% (1,336)
Two or more races - Speak only English Native:
72.2% (6,613)Foreign-born:
3.4% (275)
Two or more races - Speak another language Native:
26.1% (2,387)Foreign-born:
96.8% (7,848)
White alone - Speak only English Native:
92.8% (25,267)Foreign-born:
21.1% (673)
White alone - Speak another language Native:
7.0% (1,899)Foreign-born:
79.8% (2,544)
Hispanic or Latino - Speak only English Native:
60.9% (4,005)Foreign-born:
5.1% (269)
Hispanic or Latino - Speak another language Native:
43.8% (2,883)Foreign-born:
94.9% (4,965)
Foreign-born residents in Horizon West
Marital status for residents in Horizon West Marital status - White (Caucasian) population 15 years and over
Males 25.8% Never married65.9% Now married1.2% Separated0.8% Widowed6.3% DivorcedFemales 27.8% Never married57.5% Now married1.1% Separated1.4% Widowed12.1% DivorcedWomen who gave birth in the past 12 months Now married:
100.0% (157)Unmarried:
0.0% (0)
Women who did not give birth in the past 12 months Now married:
57.2% (5,039)Unmarried:
42.8% (3,768)
Marital status - Black or African American population 15 years and over
Males 10.5% Never married89.5% Now married0.0% Separated0.0% Widowed0.0% DivorcedFemales 69.5% Never married18.5% Now married0.0% Separated0.0% Widowed12.0% DivorcedWomen who did not give birth in the past 12 months Now married:
15.9% (69)Unmarried:
84.1% (364)
Marital status - American Indian / Alaska Native population 15 years and over
Males 0.0% Never married100.0% Now married0.0% Separated0.0% Widowed0.0% DivorcedFemales 20.4% Never married79.6% Now married0.0% Separated0.0% Widowed0.0% DivorcedWomen who did not give birth in the past 12 months Now married:
79.6% (313)Unmarried:
20.4% (80)
Marital status - Asian population 15 years and over
Males 5.6% Never married79.6% Now married0.0% Separated0.0% Widowed14.8% DivorcedFemales 10.0% Never married58.2% Now married0.0% Separated15.4% Widowed16.4% DivorcedWomen who gave birth in the past 12 months Now married:
100.0% (15)Unmarried:
0.0% (0)
Women who did not give birth in the past 12 months Now married:
62.4% (903)Unmarried:
37.6% (545)
Marital status - Other race population 15 years and over
Males 48.0% Never married49.3% Now married0.0% Separated0.0% Widowed2.8% DivorcedFemales 18.2% Never married69.0% Now married0.0% Separated0.0% Widowed12.8% DivorcedWomen who gave birth in the past 12 months Now married:
100.0% (77)Unmarried:
0.0% (0)
Women who did not give birth in the past 12 months Now married:
61.1% (377)Unmarried:
38.9% (240)
Marital status - Two or more races population 15 years and over
Males 24.3% Never married74.2% Now married0.0% Separated0.0% Widowed1.5% DivorcedFemales 28.1% Never married60.5% Now married0.0% Separated0.0% Widowed11.4% DivorcedWomen who gave birth in the past 12 months Now married:
100.0% (60)Unmarried:
0.0% (0)
Women who did not give birth in the past 12 months Now married:
57.5% (2,854)Unmarried:
42.5% (2,108)
Marital status - White alone, not Hispanic / Latino population 15 years and over
Males 24.7% Never married67.3% Now married0.9% Separated0.9% Widowed6.3% DivorcedFemales 29.5% Never married57.2% Now married0.8% Separated1.2% Widowed11.4% DivorcedWomen who gave birth in the past 12 months Now married:
100.0% (148)Unmarried:
0.0% (0)
Women who did not give birth in the past 12 months Now married:
56.6% (5,373)Unmarried:
43.4% (4,116)
Marital status - Hispanic or Latino population 15 years and over
Males 32.7% Never married62.2% Now married1.3% Separated0.0% Widowed3.8% DivorcedFemales 24.8% Never married58.2% Now married1.2% Separated1.0% Widowed14.7% DivorcedWomen who gave birth in the past 12 months Now married:
100.0% (98)Unmarried:
0.0% (0)
Women who did not give birth in the past 12 months Now married:
56.7% (2,276)Unmarried:
43.3% (1,739)
Ancestries in Horizon West
5,619 17.8% American3,808 12.1% Brazilian1,506 4.8% Italian1,368 4.3% German797 2.5% English729 2.3% Irish709 2.2% European503 1.6% Dutch294 0.9% Polish283 0.9% Portuguese236 0.7% Iranian208 0.7% Lebanese200 0.6% Hungarian196 0.6% Nigerian193 0.6% British143 0.5% Scottish121 0.4% Egyptian102 0.3% Moroccan102 0.3% French Canadian100 0.3% Austrian100 0.3% Jamaican97 0.3% Ethiopian81 0.3% Swedish73 0.2% Latvian69 0.2% Russian67 0.2% Norwegian65 0.2% Greek63 0.2% Bulgarian58 0.2% Armenian53 0.2% Turkish48 0.2% Scandinavian47 0.1% Croatian45 0.1% Eastern European44 0.1% French38 0.1% Northern European38 0.1% Ukrainian26 0.08% Finnish25 0.08% Romanian3 0.01% Scotch-Irish
Geographical mobility in Horizon West Same house 1 year ago 24,629 80.1% White (Caucasian)1,092 78.2% Black or African American378 98.3% American Indian / Alaska Native3,865 82.1% Asian2,389 81.0% Other race14,989 80.3% Two or more races26,246 80.4% White alone, not Hispanic / Latino11,439 86.5% Hispanic or LatinoMoved within same county 2,294 7.5% White / Caucasian92 6.6% Black or African American293 6.2% Asian566 3.0% Two or more races2,469 7.6% White alone, not Hispanic / Latino518 3.9% Hispanic or LatinoMoved within same state 697 2.3% White / Caucasian23 1.7% Black or African American75 1.6% Asian195 6.6% Other race263 1.4% Two or more races590 1.8% White alone, not Hispanic / Latino342 2.6% Hispanic or LatinoMoved from different state 2,872 9.3% White / Caucasian27 2.0% Black or African American14 3.7% American Indian / Alaska Native169 3.6% Asian407 13.8% Other race1,645 8.8% Two or more races3,151 9.7% White alone, not Hispanic / LatinoMoved from abroad 496 1.6% White144 10.3% Black or African American239 5.1% Asian77 2.6% Other race1,163 6.2% Two or more races365 1.1% White alone, not Hispanic / Latino904 6.8% Hispanic or Latino
Children Nativity (place of birth) in Horizon West
Children under 6 years - Living with two parents Both parents native 3,226 100.0% NativeBoth parents foreign-born 394 49.4% Native403 50.6% Foreign-bornOne native, one foreign-born parent 616 100.0% NativeChildren under 6 years - Living with one parent Native parent 153 99.8% Native0 0.2% Foreign-bornForeign-born parent 194 95.8% Native9 4.2% Foreign-bornChildren 6 to 17 years - Living with two parents Both parents native 6,568 99.9% Native7 0.1% Foreign-bornBoth parents foreign-born 1,834 58.8% Native1,283 41.2% Foreign-bornOne native, one foreign-born parent 1,129 98.7% Native14 1.3% Foreign-bornChildren 6 to 17 years - Living with one parent Native parent 952 100.0% NativeForeign-born parent 754 56.1% Native589 43.9% Foreign-born
Place of birth for residents in Horizon West 9,892 Americas9,764 Latin America8,400 South America3,582 Asia1,848 Europe1,472 Eastern Asia1,469 South Central Asia1,218 China790 Central America703 Eastern Europe689 Western Europe602 South Eastern Asia572 Caribbean454 Northern Europe418 Africa176 Eastern Africa136 Northern Africa128 Northern America104 Middle Africa38 Western Asia4,314 Brazil2,097 Venezuela1,391 India1,190 China896 Colombia675 Mexico656 Netherlands529 Uruguay316 Philippines300 Dominican Republic293 Bulgaria285 Vietnam280 England253 Korea231 Argentina199 Peru175 Poland155 Cuba131 Guyana128 Canada116 Jamaica115 Panama106 Zimbabwe102 United Kingdom87 Morocco68 Belarus62 Hungary56 Croatia53 Sweden49 Egypt46 Russia43 Iran38 Turkey34 Pakistan33 Ethiopia28 Hong Kong18 Uganda18 Ireland17 Tanzania17 France15 Germany
Grandparents responsible for own grandchildren in Horizon West
Grandparents (30 to 59 years) White / Caucasian 11 100.0% Not responsible for grandchildrenAsian 52 100.0% Not responsible for grandchildrenTwo or more races 148 100.0% Not responsible for grandchildrenWhite alone, not Hispanic / Latino 16 100.0% Not responsible for grandchildrenHispanic or Latino 67 100.0% Not responsible for grandchildrenGrandparents (60 years and over) White / Caucasian 148 100.0% Not responsible for grandchildrenAsian 90 24.1% Responsible for grandchildren283 75.9% Not responsible for grandchildrenTwo or more races 105 100.0% Not responsible for grandchildrenWhite alone, not Hispanic / Latino 171 100.0% Not responsible for grandchildrenHispanic or Latino 306 100.0% Not responsible for grandchildren