Races in Hoquiam, Washington (WA) Detailed Stats
Ancestries, Foreign-born residents, place of birth
Settings
X


Recent posts about races in Hoquiam, Washington on our local forum with over 2,400,000 registered users:
 | Aberdeen and Hoquiam (39 replies) |
| What is it like living on the Puget Sound? (39 replies) |
| Puget Sound hoping (78 replies) |
| Downtown Seattle Association seems a bit confused (11 replies) |
| Ocean Shores--good, bad and the ugly (107 replies) |
| Good idea to buy a house in Aberdeen? (11 replies) |
Latest news about races in Hoquiam, WA collected exclusively by city-data.com from local newspapers, TV, and radio stations
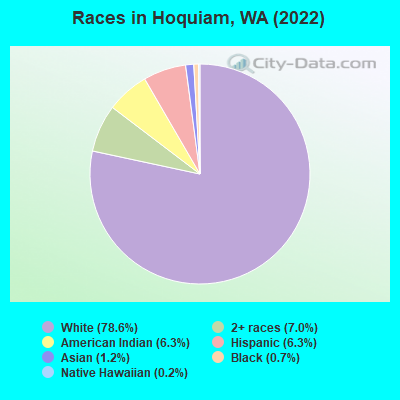
According to 2022 data, the most numerous races in Hoquiam, WA are White alone (6,996 residents), Hispanic (557 residents), and Asian alone (107 residents). 92.5% of Hoquiam residents speak English at home. 3.1% of Hoquiam, WA residents are foreign-born (1.5% born in Latin America, 1.3% born in Asia), which is 383.7% less than the foreign-born rate of 15.0% across the entire state of Washington.
Race distribution in Hoquiam
2000
2022

- 7,86486.4%White alone
- 5235.7%Hispanic
- 3353.7%American Indian alone
- 2372.6%Two or more races
- 1031.1%Asian alone
- 260.3%Black alone
- 60.07%Native Hawaiian and Other
Pacific Islander alone - 30.03%Other race alone

-
- 6,99678.6%White alone
- 6227.0%Two or more races
- 5576.3%Hispanic
- 5576.3%American Indian alone
- 1071.2%Asian alone
- 630.7%Black alone
- 190.2%Native Hawaiian and Other
Pacific Islander alone
2000
2022
-
- 4,652,49078.9%White alone
- 441,5097.5%Hispanic
- 319,4015.4%Asian alone
- 184,6313.1%Black alone
- 175,9263.0%Two or more races
- 85,3961.4%American Indian alone
- 22,7790.4%Native Hawaiian and Other
Pacific Islander alone - 11,9890.2%Other race alone

-
- 4,941,45663.5%White alone
- 1,093,31314.0%Hispanic
- 755,8329.7%Asian alone
- 523,4486.7%Two or more races
- 299,5373.8%Black alone
- 69,0240.9%American Indian alone
- 52,2310.7%Native Hawaiian and Other
Pacific Islander alone - 50,9450.7%Other race alone

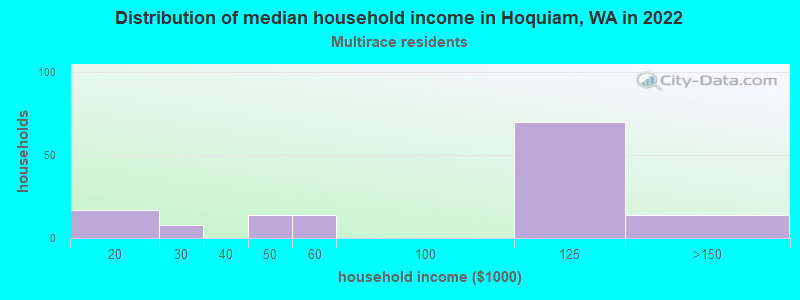
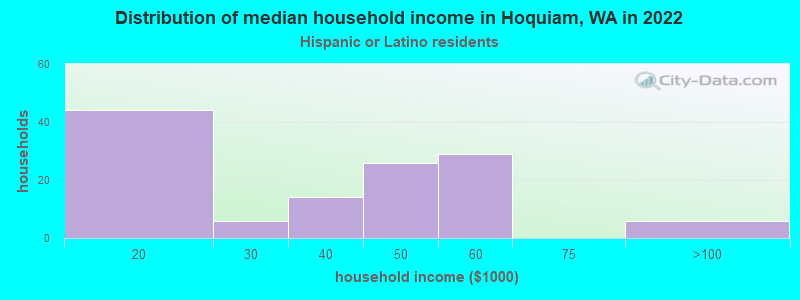
Income and house value in Hoquiam
- Median household income in 2022
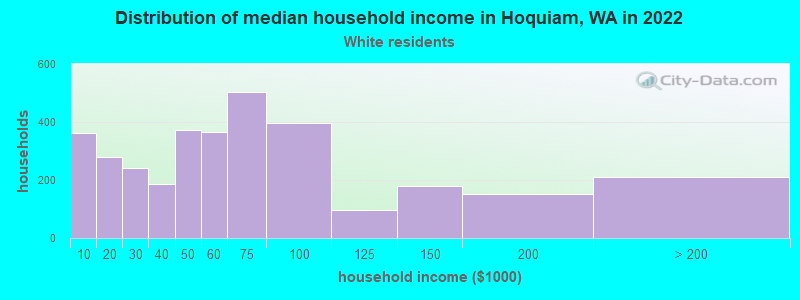
- $51,269White non-Hispanic householders
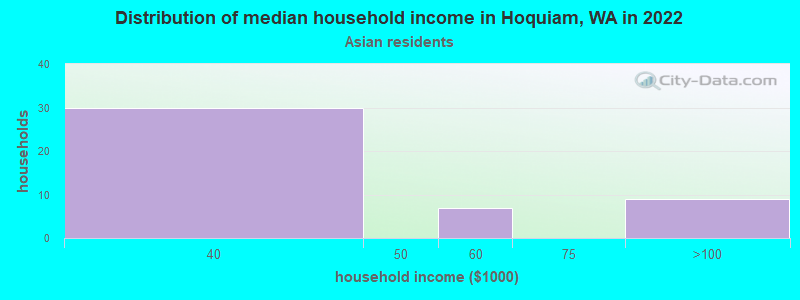
- $32,226Asian householders
- $115,245Two or more races householders
- $39,994Hispanic or Latino race householders
- Median 2022 house value
- $195,190White Non-Hispanic householders
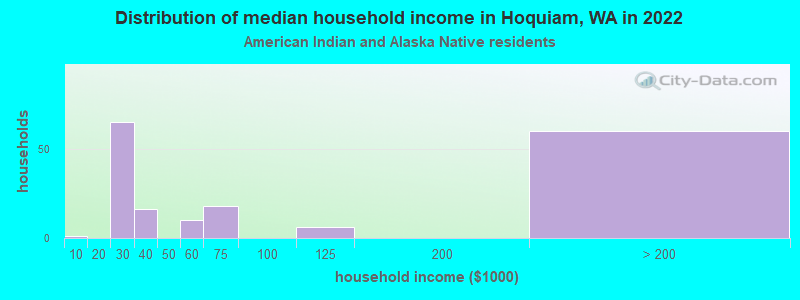
- $192,338American Indian or Alaska Native householders
- $205,559Asian householders
- $157,603Some other race householders
- $125,979Two or more races householders
- $172,897Hispanic or Latino householders
Household income for White non-Hispanic householders
Household income for American Indian and Alaska Native householders
Household income for Asian householders
Household income for Two or more races householders
Household income for Hispanic or Latino race householders
Median age by race in Hoquiam
- 44.8Median age for White residents
- 40.6Males
- 46.9Females
- 50.8Median age for Black or African American residents
- 12.4Males
- -711,934,155.7Females
- 16.3Median age for American Indian / Alaska Native residents
- 14.7Males
- 14.4Females
- 38.9Median age for Asian residents
- 38.9Males
- 61.8Females
- -681,388,011.9Median age for Native Hawaiian / Pacific Islander residents
- -696,774,192.9Males
- -666,666,666.0Females
- 33.8Median age for Other race residents
- -969,696,968.7Males
- 33.6Females
- 36.8Median age for Two or more races residents
- 33.6Males
- 34.5Females
- 44.6Median age for White alone residents
- 40.3Males
- 48.2Females
- 34.1Median age for Hispanic or Latino residents
- 41.3Males
- 26.8Females
Owner/renter occupied households by race in Hoquiam
- House owners and renters - White residents
- 2,10364.5%Owner occupied
- 1,16035.5%Renter occupied
- House owners and renters - Black or African American residents
- 15100.0%Owner occupied
- House owners and renters - American Indian / Alaska Native residents
- 6945.2%Owner occupied
- 8354.8%Renter occupied
- House owners and renters - Asian residents
- 46100.0%Owner occupied
- House owners and renters - Other race residents
- 13100.0%Renter occupied
- House owners and renters - Two or more races residents
- 15389.3%Owner occupied
- 1810.7%Renter occupied
- House owners and renters - White alone residents
- 2,07664.3%Owner occupied
- 1,15135.7%Renter occupied
- House owners and renters - Hispanic or Latino residents
- 5337.3%Owner occupied
- 8962.7%Renter occupied
Language usage in Hoquiam
- English speakers - Total
- 92.5% of residents of Hoquiam speak English at home.
- 4.4% of residents speak Spanish at home
- 29878.2%Speak English very well
- 8321.8%Speak English less than very well
- 1.9% of residents speak other language at home
- 4326.5%Speak English very well
- 11973.5%Speak English less than very well
- English speakers - Born in the United States
- 98.1% of residents of Hoquiam speak English at home.
- 1.3% of residents speak Spanish at home
- 38100.0%Speak English very well
- 0.4% of residents speak other language at home
- 13100.0%Speak English very well
All residents speak only English at home
- English speakers - Foreign-born
- 1.0% of residents of Hoquiam speak English at home.
- 38.2% of residents speak Spanish at home
- 3428.3%Speak English very well
- 8671.7%Speak English less than very well
- 44.9% of residents speak other language at home
- 2215.6%Speak English very well
- 11984.4%Speak English less than very well
White (Caucasian) - Speak only English
| Native: | 98.9% (6,758) |
| Foreign-born: | 2.5% (4) |
White (Caucasian) - Speak another language
| Native: | 1.4% (99) |
| Foreign-born: | 98.9% (141) |
Asian - Speak another language
| Native: | 11.4% (2) |
| Foreign-born: | 99.2% (119) |
White alone - Speak only English
| Native: | 99.7% (6,813) |
| Foreign-born: | 11.7% (4) |
White alone - Speak another language
| Native: | 0.5% (37) |
| Foreign-born: | 100.0% (32) |
Hispanic or Latino - Speak another language
| Native: | 72.0% (204) |
| Foreign-born: | 100.0% (169) |
Foreign-born residents in Hoquiam
276 residents are foreign born (1.5% Latin America, 1.3% Asia).
| This city: | 3.1% |
| Washington: | 14.9% |


Marital status for residents in Hoquiam
Marital status - White (Caucasian) population 15 years and over
- Males
- 39.1%Never married
- 35.3%Now married
- 0.6%Separated
- 5.2%Widowed
- 19.9%Divorced
- Females
- 26.5%Never married
- 38.4%Now married
- 4.3%Separated
- 10.4%Widowed
- 20.3%Divorced
Women who gave birth in the past 12 months
| Now married: | 50.0% (18) |
| Unmarried: | 50.0% (18) |
Women who did not give birth in the past 12 months
| Now married: | 42.3% (570) |
| Unmarried: | 57.7% (778) |
Marital status - Black or African American population 15 years and over
- Males
- 0.0%Never married
- 100.0%Now married
- 0.0%Separated
- 0.0%Widowed
- 0.0%Divorced
- Females
- 15.8%Never married
- 84.2%Now married
- 0.0%Separated
- 0.0%Widowed
- 0.0%Divorced
Women who did not give birth in the past 12 months
| Now married: | 0.0% (0) |
| Unmarried: | 100.0% (6) |
Marital status - American Indian / Alaska Native population 15 years and over
- Males
- 43.7%Never married
- 56.3%Now married
- 0.0%Separated
- 0.0%Widowed
- 0.0%Divorced
- Females
- 38.2%Never married
- 41.0%Now married
- 0.6%Separated
- 0.0%Widowed
- 20.2%Divorced
Women who gave birth in the past 12 months
| Now married: | 35.0% (8) |
| Unmarried: | 65.0% (15) |
Women who did not give birth in the past 12 months
| Now married: | 52.4% (77) |
| Unmarried: | 47.6% (70) |
Marital status - Asian population 15 years and over
- Males
- 34.6%Never married
- 30.8%Now married
- 0.0%Separated
- 0.0%Widowed
- 34.6%Divorced
- Females
- 15.4%Never married
- 84.6%Now married
- 0.0%Separated
- 0.0%Widowed
- 0.0%Divorced
Women who did not give birth in the past 12 months
| Now married: | 50.0% (9) |
| Unmarried: | 50.0% (9) |
Marital status - Other race population 15 years and over
- Males
- 100.0%Never married
- 0.0%Now married
- 0.0%Separated
- 0.0%Widowed
- 0.0%Divorced
- Females
- 80.0%Never married
- 20.0%Now married
- 0.0%Separated
- 0.0%Widowed
- 0.0%Divorced
Women who gave birth in the past 12 months
| Now married: | 0.0% (0) |
| Unmarried: | 100.0% (14) |
Marital status - Two or more races population 15 years and over
- Males
- 40.2%Never married
- 56.9%Now married
- 0.0%Separated
- 0.0%Widowed
- 2.9%Divorced
- Females
- 41.5%Never married
- 45.5%Now married
- 0.0%Separated
- 9.4%Widowed
- 3.6%Divorced
Women who gave birth in the past 12 months
| Now married: | 100.0% (29) |
| Unmarried: | 0.0% (0) |
Women who did not give birth in the past 12 months
| Now married: | 31.1% (51) |
| Unmarried: | 68.9% (114) |
Marital status - White alone, not Hispanic / Latino population 15 years and over
- Males
- 39.7%Never married
- 34.3%Now married
- 0.6%Separated
- 5.3%Widowed
- 20.0%Divorced
- Females
- 25.7%Never married
- 38.1%Now married
- 4.5%Separated
- 10.3%Widowed
- 21.3%Divorced
Women who gave birth in the past 12 months
| Now married: | 50.0% (19) |
| Unmarried: | 50.0% (19) |
Women who did not give birth in the past 12 months
| Now married: | 42.8% (567) |
| Unmarried: | 57.2% (758) |
Marital status - Hispanic or Latino population 15 years and over
- Males
- 25.2%Never married
- 59.4%Now married
- 0.0%Separated
- 0.0%Widowed
- 15.5%Divorced
- Females
- 38.7%Never married
- 48.2%Now married
- 0.0%Separated
- 13.1%Widowed
- 0.0%Divorced
Women who gave birth in the past 12 months
| Now married: | 65.7% (24) |
| Unmarried: | 34.3% (13) |
Women who did not give birth in the past 12 months
| Now married: | 34.7% (35) |
| Unmarried: | 65.3% (65) |
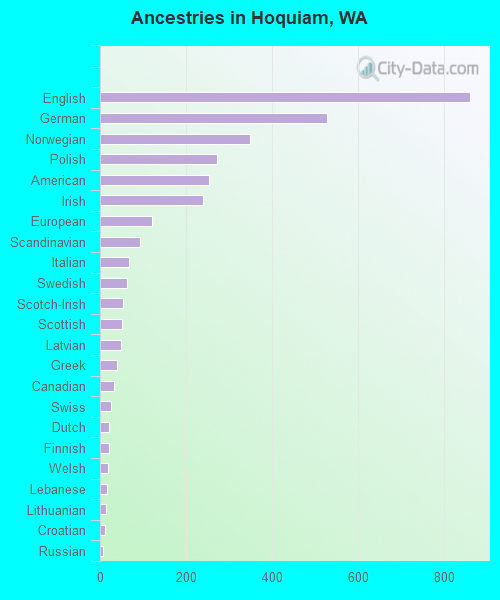
Ancestries in Hoquiam

- 86218.8%English
- 52911.6%German
- 3497.6%Norwegian
- 2725.9%Polish
- 2545.6%American
- 2405.2%Irish
- 1202.6%European
- 932.0%Scandinavian
- 681.5%Italian
- 621.4%Swedish
- 531.2%Scotch-Irish
- 521.1%Scottish
- 501.1%Latvian
- 400.9%Greek
- 330.7%Canadian
- 260.6%Swiss
- 210.5%Dutch
- 210.5%Finnish
- 190.4%Welsh
- 160.3%Lebanese
- 150.3%Lithuanian
- 110.2%Croatian
- 80.2%Russian
- 60.1%French Canadian
- 50.1%Eastern European
- 30.07%British
Geographical mobility in Hoquiam

- Same house 1 year ago
- 6,00685.4%White (Caucasian)
- 107100.0%Black or African American
- 37682.4%American Indian / Alaska Native
- 12992.3%Asian
- 1112.2%Other race
- 54280.9%Two or more races
- 5,86884.5%White alone, not Hispanic / Latino
- 36269.4%Hispanic or Latino

-
- Moved within same county
- 84112.0%White / Caucasian
- 214.5%American Indian / Alaska Native
- 96.6%Asian
- 9213.7%Two or more races
- 89312.8%White alone, not Hispanic / Latino
- 9117.5%Hispanic or Latino

-
- Moved within same state
- 1732.5%White / Caucasian
- 25100.0%Native Hawaiian / Pacific Islander
- 1782.6%White alone, not Hispanic / Latino
- 102.0%Hispanic or Latino

-
- Moved from different state
- 1982.8%White / Caucasian
- 6814.8%American Indian / Alaska Native
- 4550.8%Other race
- 203.0%Two or more races
- 2042.9%White alone, not Hispanic / Latino
- 377.0%Hispanic or Latino

-
- Moved from abroad
- 230.3%White
- 230.3%White alone, not Hispanic / Latino

Children Nativity (place of birth) in Hoquiam
Place of birth for residents in Hoquiam
![Place of birth for the foreign-born population - Regions]()
- 137Americas
- 137Latin America
- 137Central America
- 116Asia
- 110Eastern Asia
- 110China
- 22Europe
- 12Eastern Europe
- 9Northern Europe
- 6South Eastern Asia
- 1Western Europe

![Place of birth for the foreign-born population - Countries]()
- 130Mexico
- 110China
- 12Russia
- 6Philippines
- 6Guatemala
- 3Norway
- 1Germany

Grandparents responsible for own grandchildren in Hoquiam
Zip codes: 98550.