Races in Hopkins, Minnesota (MN) Detailed Stats
Ancestries, Foreign-born residents, place of birth
Settings
X


Recent posts about races in Hopkins, Minnesota on our local forum with over 2,400,000 registered users:

According to 2022 data, the most numerous races in Hopkins, MN are White alone (10,856 residents), Black alone (3,775 residents), and Hispanic (1,438 residents). 84.6% of Hopkins residents speak English at home. 11.4% of Hopkins, MN residents are foreign-born (4.5% born in Africa, 3.9% born in Asia, 2.0% born in Latin America), which is 29.8% greater than the foreign-born rate of 8.0% across the entire state of Minnesota.
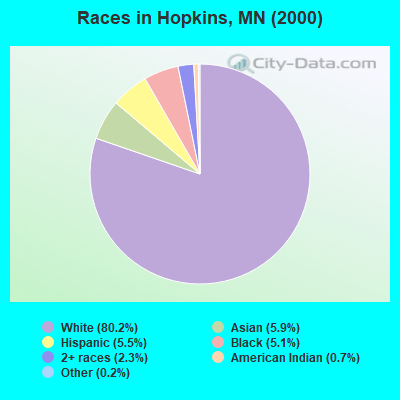
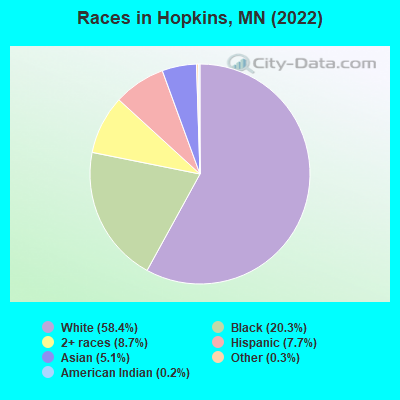
Race distribution in Hopkins
2000
2022

- 13,75580.2%White alone
- 1,0085.9%Asian alone
- 9495.5%Hispanic
- 8745.1%Black alone
- 3972.3%Two or more races
- 1140.7%American Indian alone
- 330.2%Other race alone
- 150.09%Native Hawaiian and Other
Pacific Islander alone
-
- 10,85658.4%White alone
- 3,77520.3%Black alone
- 1,6228.7%Two or more races
- 1,4387.7%Hispanic
- 9495.1%Asian alone
- 600.3%Other race alone
- 300.2%American Indian alone
2000
2022
-
- 4,337,14388.2%White alone
- 168,8133.4%Black alone
- 143,3822.9%Hispanic
- 141,0832.9%Asian alone
- 70,3041.4%Two or more races
- 52,0091.1%American Indian alone
- 5,0310.1%Other race alone
- 1,7140.03%Native Hawaiian and Other
Pacific Islander alone

-
- 4,356,34776.2%White alone
- 395,1796.9%Black alone
- 333,8305.8%Hispanic
- 294,8005.2%Asian alone
- 259,6494.5%Two or more races
- 42,1250.7%American Indian alone
- 32,9760.6%Other race alone
- 2,2780.04%Native Hawaiian and Other
Pacific Islander alone

Income and house value in Hopkins
- Median household income in 2022
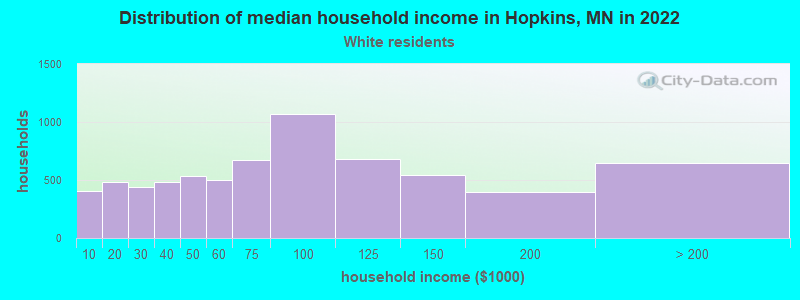
- $69,013White non-Hispanic householders
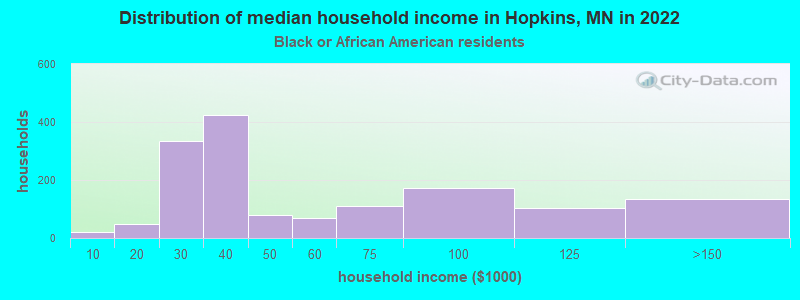
- $40,714Black householders
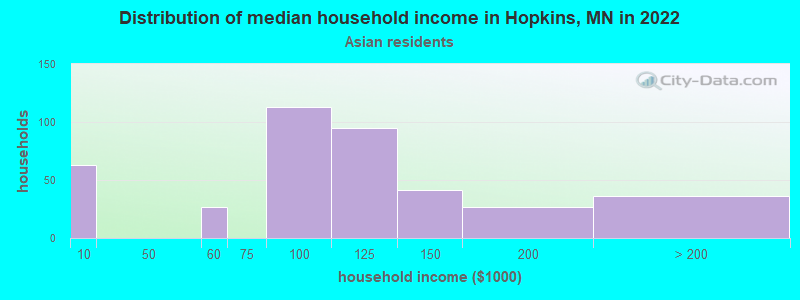
- $89,192Asian householders
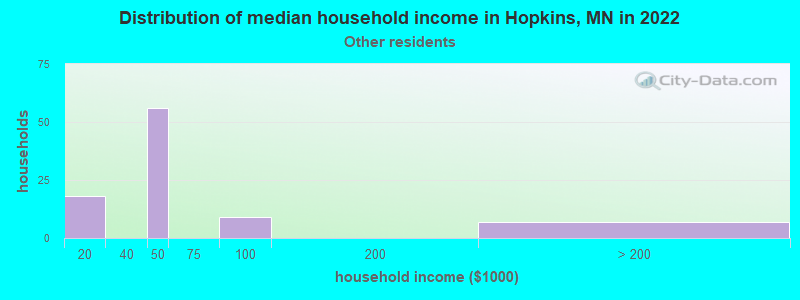
- $52,493Some other race householders
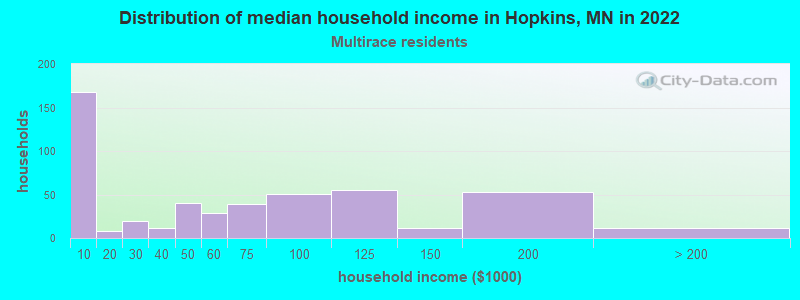
- $52,574Two or more races householders
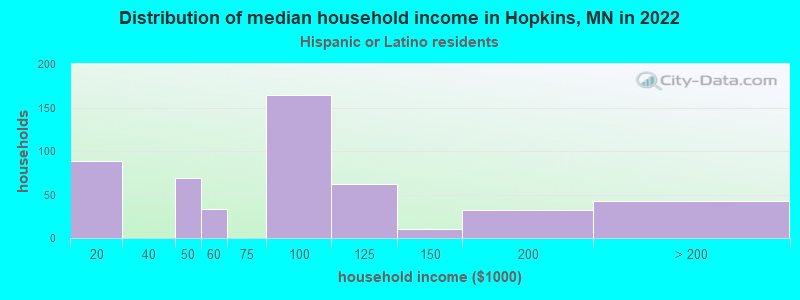
- $82,121Hispanic or Latino race householders
- Median 2022 house value
- $360,285White Non-Hispanic householders
- $196,057Black or African American householders
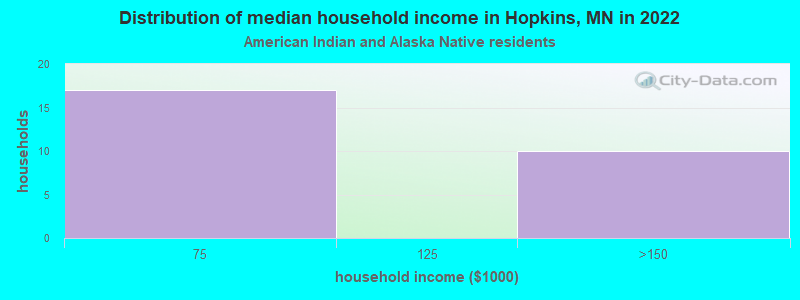
- $300,906American Indian or Alaska Native householders
- $269,612Asian householders
- $367,775Some other race householders
- $329,259Hispanic or Latino householders
Household income for White non-Hispanic householders
Household income for Black householders
Household income for American Indian and Alaska Native householders
Household income for Asian householders
Household income for Some other race householders
Household income for Two or more races householders
Household income for Hispanic or Latino race householders
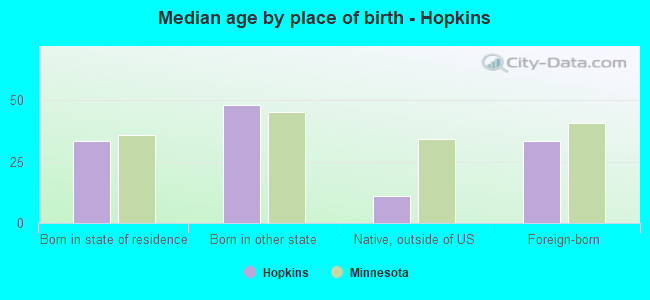
Median age by race in Hopkins
- 47.4Median age for White residents
- 40.7Males
- 52.3Females
- 28.0Median age for Black or African American residents
- 27.8Males
- 30.6Females
- 58.3Median age for American Indian / Alaska Native residents
- 49.9Males
- -643,749,999.4Females
- 32.7Median age for Asian residents
- 33.4Males
- 30.8Females
- -790,303,029.5Median age for Native Hawaiian / Pacific Islander residents
- -856,799,036.4Males
- -365,948,037.2Females
- 14.7Median age for Other race residents
- 13.1Males
- 14.6Females
- 19.1Median age for Two or more races residents
- 20.9Males
- 17.5Females
- 47.9Median age for White alone residents
- 41.9Males
- 53.5Females
- 24.0Median age for Hispanic or Latino residents
- 10.3Males
- 35.9Females
Owner/renter occupied households by race in Hopkins
- House owners and renters - White residents
- 2,97743.4%Owner occupied
- 3,88656.6%Renter occupied
- House owners and renters - Black or African American residents
- 553.6%Owner occupied
- 1,46396.4%Renter occupied
- House owners and renters - American Indian / Alaska Native residents
- 1657.3%Owner occupied
- 1242.7%Renter occupied
- House owners and renters - Asian residents
- 411100.0%Renter occupied
- House owners and renters - Other race residents
- 68.8%Owner occupied
- 6591.2%Renter occupied
- House owners and renters - Two or more races residents
- 9518.8%Owner occupied
- 41081.2%Renter occupied
- House owners and renters - White alone residents
- 2,92744.5%Owner occupied
- 3,64955.5%Renter occupied
- House owners and renters - Hispanic or Latino residents
- 6713.4%Owner occupied
- 42986.6%Renter occupied
Language usage in Hopkins
- English speakers - Total
- 84.6% of residents of Hopkins speak English at home.
- 3.2% of residents speak Spanish at home
- 33661.4%Speak English very well
- 21138.6%Speak English less than very well
- 12.2% of residents speak other language at home
- 1,46869.9%Speak English very well
- 63130.1%Speak English less than very well
- English speakers - Born in the United States
- 95.1% of residents of Hopkins speak English at home.
- 2.4% of residents speak Spanish at home
- 10078.7%Speak English very well
- 2721.3%Speak English less than very well
- 1.6% of residents speak other language at home
- 85100.0%Speak English very well
- English speakers - Native, born elsewhere
- 12.6% of residents of Hopkins speak English at home.
- 67.6% of residents speak other language at home
- 9033.5%Speak English very well
- 17966.5%Speak English less than very well
- English speakers - Foreign-born
- 18.1% of residents of Hopkins speak English at home.
- 13.9% of residents speak Spanish at home
- 11842.9%Speak English very well
- 15757.1%Speak English less than very well
- 68.1% of residents speak other language at home
- 98773.5%Speak English very well
- 35626.5%Speak English less than very well
White (Caucasian) - Speak only English
| Native: | 97.4% (10,934) |
| Foreign-born: | 39.7% (54) |
White (Caucasian) - Speak another language
| Native: | 2.6% (294) |
| Foreign-born: | 59.3% (81) |
Black or African American - Speak only English
| Native: | 72.1% (1,640) |
| Foreign-born: | 11.5% (100) |
Black or African American - Speak another language
| Native: | 32.2% (732) |
| Foreign-born: | 92.9% (815) |
Asian - Speak only English
| Native: | 38.7% (52) |
| Foreign-born: | 19.3% (118) |
Asian - Speak another language
| Native: | 60.4% (81) |
| Foreign-born: | 80.7% (494) |
Other race - Speak only English
| Native: | 100.0% (98) |
| Foreign-born: | 5.5% (8) |
Two or more races - Speak only English
| Native: | 100.0% (1,496) |
| Foreign-born: | 37.1% (110) |
Two or more races - Speak another language
| Native: | 1.5% (22) |
| Foreign-born: | 64.8% (193) |
White alone - Speak only English
| Native: | 99.2% (10,512) |
| Foreign-born: | 47.0% (57) |
White alone - Speak another language
| Native: | 1.0% (101) |
| Foreign-born: | 53.0% (64) |
Hispanic or Latino - Speak another language
| Native: | 26.8% (242) |
| Foreign-born: | 95.7% (280) |
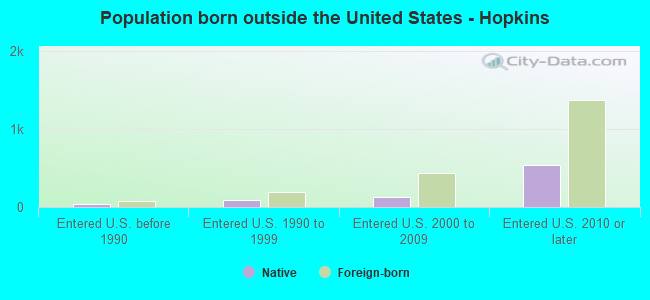
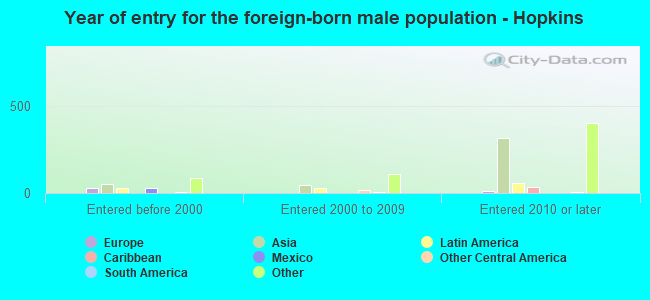
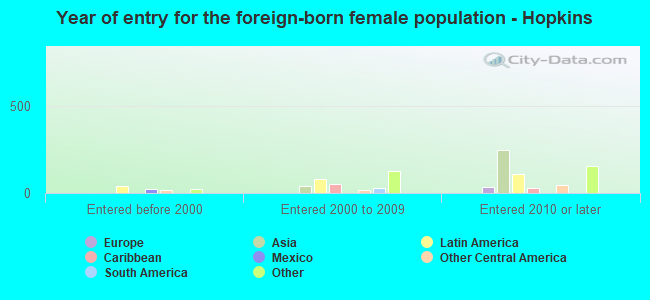
Foreign-born residents in Hopkins
2,120 residents are foreign born (4.5% Africa, 3.9% Asia, 2.0% Latin America).
| This city: | 11.4% |
| Minnesota: | 8.5% |
Marital status for residents in Hopkins
Marital status - White (Caucasian) population 15 years and over
- Males
- 45.3%Never married
- 42.7%Now married
- 1.1%Separated
- 0.7%Widowed
- 10.2%Divorced
- Females
- 29.4%Never married
- 37.0%Now married
- 1.3%Separated
- 15.7%Widowed
- 16.6%Divorced
Women who did not give birth in the past 12 months
| Now married: | 32.5% (830) |
| Unmarried: | 67.5% (1,726) |
Marital status - Black or African American population 15 years and over
- Males
- 52.0%Never married
- 35.5%Now married
- 8.8%Separated
- 1.9%Widowed
- 1.7%Divorced
- Females
- 43.9%Never married
- 35.1%Now married
- 11.6%Separated
- 0.0%Widowed
- 9.4%Divorced
Women who gave birth in the past 12 months
| Now married: | 100.0% (39) |
| Unmarried: | 0.0% (0) |
Women who did not give birth in the past 12 months
| Now married: | 50.8% (516) |
| Unmarried: | 49.2% (500) |
Marital status - American Indian / Alaska Native population 15 years and over
- Males
- 7.7%Never married
- 73.1%Now married
- 0.0%Separated
- 19.2%Widowed
- 0.0%Divorced
- Females
- 0.0%Never married
- 0.0%Now married
- 0.0%Separated
- 100.0%Widowed
- 0.0%Divorced
Marital status - Asian population 15 years and over
- Males
- 31.8%Never married
- 64.1%Now married
- 0.0%Separated
- 0.0%Widowed
- 4.1%Divorced
- Females
- 19.0%Never married
- 78.7%Now married
- 0.0%Separated
- 0.0%Widowed
- 2.2%Divorced
Women who gave birth in the past 12 months
| Now married: | 100.0% (90) |
| Unmarried: | 0.0% (0) |
Women who did not give birth in the past 12 months
| Now married: | 70.2% (158) |
| Unmarried: | 29.8% (67) |
Marital status - Other race population 15 years and over
- Males
- 46.0%Never married
- 54.0%Now married
- 0.0%Separated
- 0.0%Widowed
- 0.0%Divorced
- Females
- 30.8%Never married
- 69.2%Now married
- 0.0%Separated
- 0.0%Widowed
- 0.0%Divorced
Women who did not give birth in the past 12 months
| Now married: | 66.7% (41) |
| Unmarried: | 33.3% (20) |
Marital status - Two or more races population 15 years and over
- Males
- 27.8%Never married
- 59.6%Now married
- 0.0%Separated
- 0.0%Widowed
- 12.6%Divorced
- Females
- 53.2%Never married
- 41.8%Now married
- 5.1%Separated
- 0.0%Widowed
- 0.0%Divorced
Women who gave birth in the past 12 months
| Now married: | 100.0% (66) |
| Unmarried: | 0.0% (0) |
Women who did not give birth in the past 12 months
| Now married: | 39.9% (215) |
| Unmarried: | 60.1% (324) |
Marital status - White alone, not Hispanic / Latino population 15 years and over
- Males
- 45.0%Never married
- 43.3%Now married
- 1.1%Separated
- 0.7%Widowed
- 9.9%Divorced
- Females
- 31.2%Never married
- 36.4%Now married
- 1.4%Separated
- 16.7%Widowed
- 14.4%Divorced
Women who did not give birth in the past 12 months
| Now married: | 32.3% (757) |
| Unmarried: | 67.7% (1,588) |
Marital status - Hispanic or Latino population 15 years and over
- Males
- 48.0%Never married
- 42.0%Now married
- 0.0%Separated
- 0.0%Widowed
- 9.9%Divorced
- Females
- 8.7%Never married
- 53.7%Now married
- 0.0%Separated
- 0.0%Widowed
- 37.6%Divorced
Women who did not give birth in the past 12 months
| Now married: | 46.6% (178) |
| Unmarried: | 53.4% (203) |
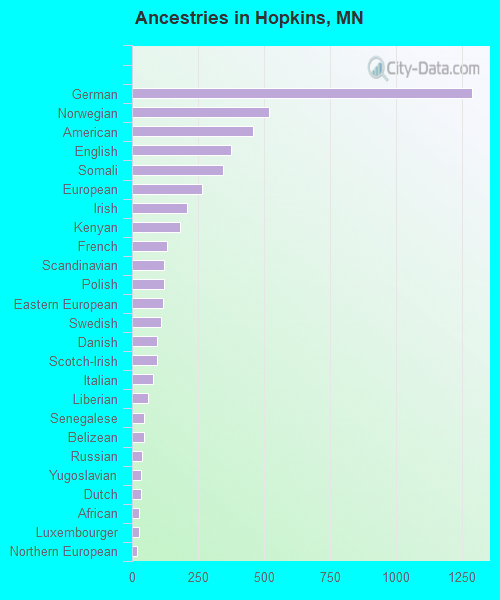
Ancestries in Hopkins

- 1,28815.7%German
- 5196.3%Norwegian
- 4605.6%American
- 3754.6%English
- 3434.2%Somali
- 2653.2%European
- 2082.5%Irish
- 1822.2%Kenyan
- 1311.6%French
- 1231.5%Scandinavian
- 1211.5%Polish
- 1181.4%Eastern European
- 1111.4%Swedish
- 941.1%Danish
- 931.1%Scotch-Irish
- 780.9%Italian
- 610.7%Liberian
- 470.6%Senegalese
- 460.6%Belizean
- 370.5%Russian
- 350.4%Yugoslavian
- 350.4%Dutch
- 280.3%African
- 250.3%Luxembourger
- 200.2%Northern European
- 180.2%Scottish
- 140.2%Finnish
- 100.1%Austrian
- 100.1%Romanian
- 50.06%Estonian
- 40.05%British
- 40.05%Brazilian
- 20.02%Lithuanian
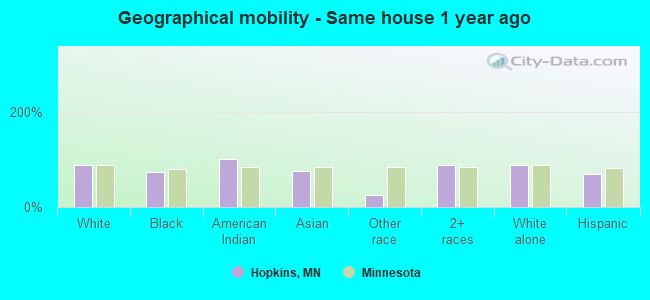
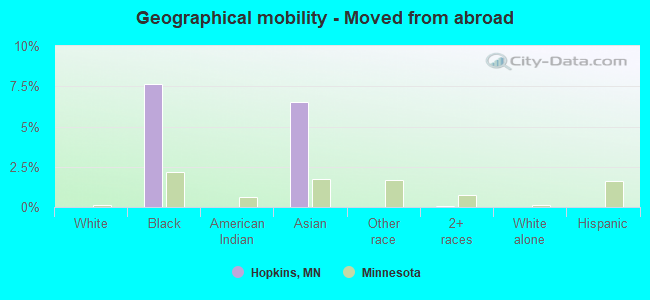
Geographical mobility in Hopkins

- Same house 1 year ago
- 10,14888.0%White (Caucasian)
- 2,77073.9%Black or African American
- 42100.0%American Indian / Alaska Native
- 67175.2%Asian
- 8725.7%Other race
- 1,81587.1%Two or more races
- 9,50487.5%White alone, not Hispanic / Latino
- 1,01070.4%Hispanic or Latino
-
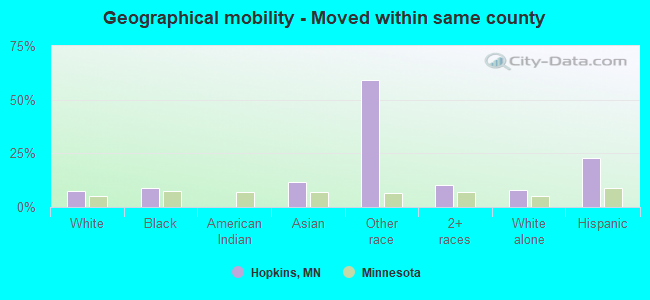
- Moved within same county
- 8787.6%White / Caucasian
- 3409.1%Black or African American
- 10211.5%Asian
- 20259.4%Other race
- 21010.1%Two or more races
- 8738.0%White alone, not Hispanic / Latino
- 32923.0%Hispanic or Latino
-
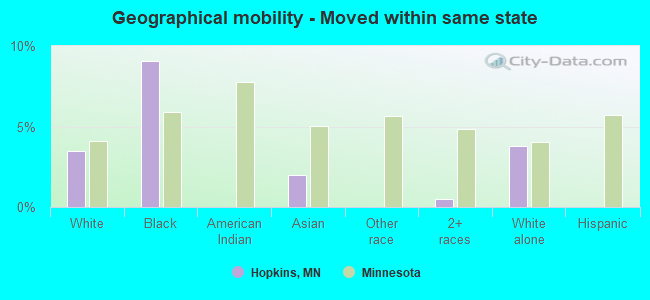
- Moved within same state
- 3993.5%White / Caucasian
- 3409.1%Black or African American
- 182.0%Asian
- 100.5%Two or more races
- 4083.8%White alone, not Hispanic / Latino
-
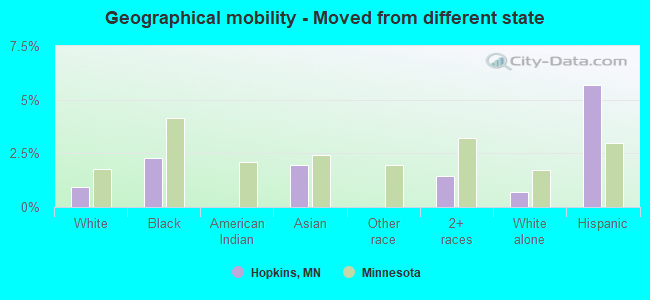
- Moved from different state
- 1090.9%White / Caucasian
- 862.3%Black or African American
- 182.0%Asian
- 301.4%Two or more races
- 750.7%White alone, not Hispanic / Latino
- 815.7%Hispanic or Latino
-
- Moved from abroad
- 2877.6%Black or African American
- 586.5%Asian
- 20.1%Two or more races
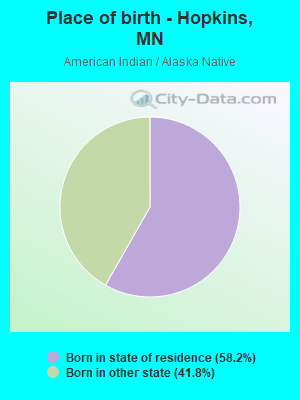
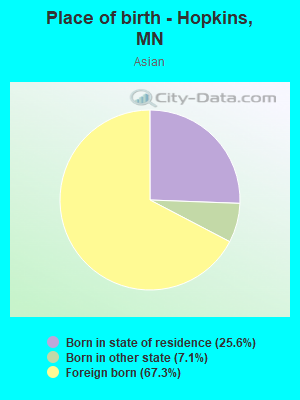
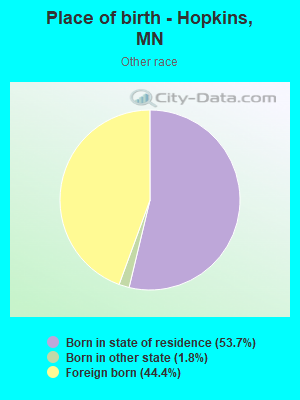
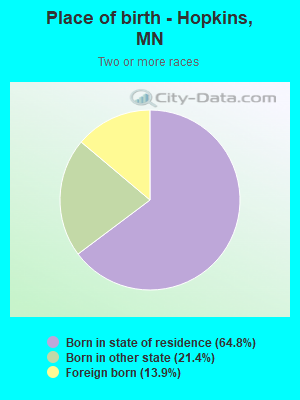
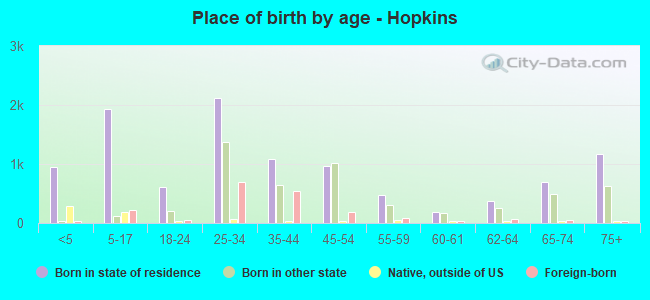
Children Nativity (place of birth) in Hopkins
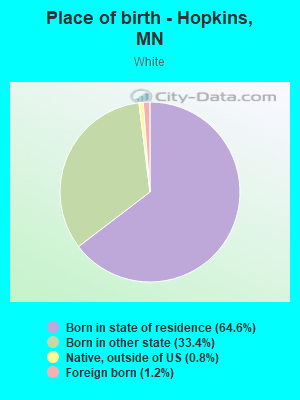
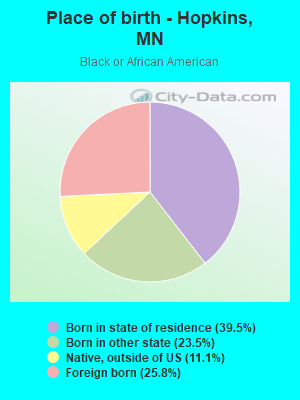
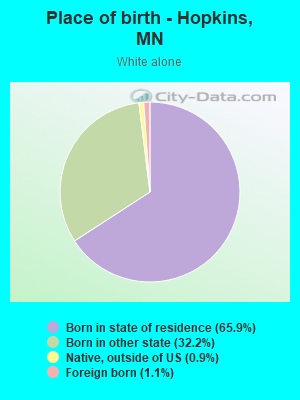
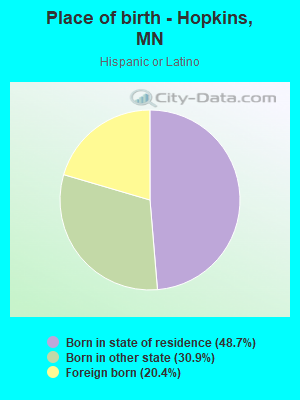
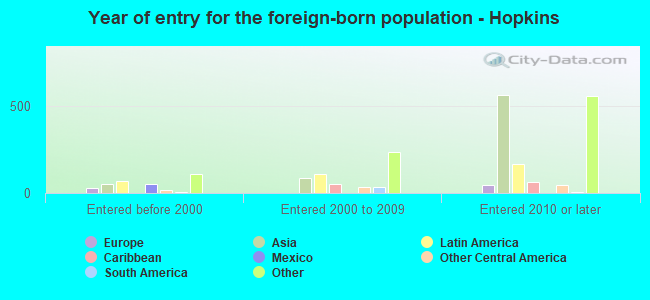
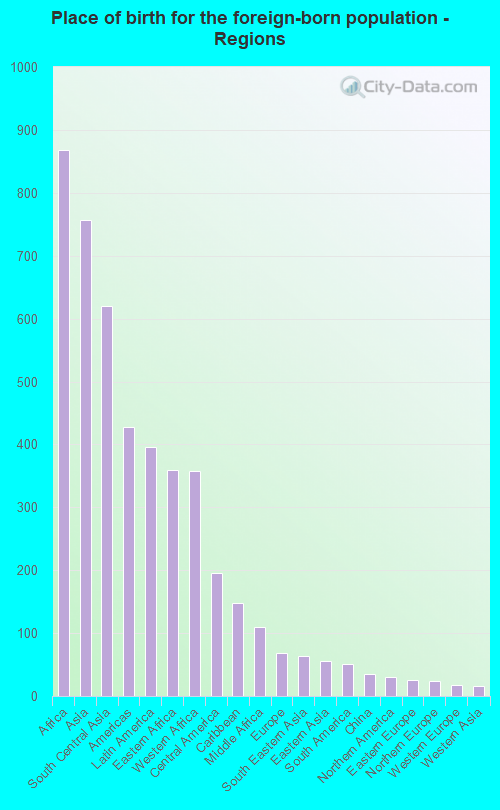
Place of birth for residents in Hopkins
![Place of birth for the foreign-born population - Regions]()
- 868Africa
- 756Asia
- 620South Central Asia
- 427Americas
- 396Latin America
- 359Eastern Africa
- 358Western Africa
- 196Central America
- 148Caribbean
- 110Middle Africa
- 68Europe
- 64South Eastern Asia
- 55Eastern Asia
- 51South America
- 35China
- 31Northern America
- 25Eastern Europe
- 24Northern Europe
- 17Western Europe
- 16Western Asia
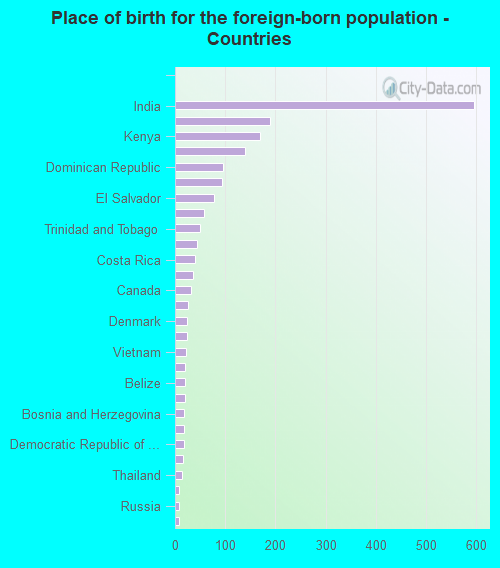
![Place of birth for the foreign-born population - Countries]()
- 596India
- 189Somalia
- 169Kenya
- 139Liberia
- 96Dominican Republic
- 93Cameroon
- 77El Salvador
- 57Mexico
- 50Trinidad and Tobago
- 43Venezuela
- 40Costa Rica
- 35China
- 31Canada
- 26Ghana
- 24Denmark
- 23Uzbekistan
- 22Vietnam
- 20Korea
- 20Belize
- 19Malaysia
- 18Bosnia and Herzegovina
- 17Germany
- 17Democratic Republic of Congo (Zaire)
- 16Israel
- 14Thailand
- 8Brazil
- 7Russia
- 7Philippines
- 1Jamaica
Grandparents responsible for own grandchildren in Hopkins
Zip codes: 55305.