Races in Hopewell, Virginia (VA) Detailed Stats
Data:
Races - White alone (%)
Races - White alone (% change since 2000)
Races - Black alone (%)
Races - Black alone (% change since 2000)
Races - American Indian alone (%)
Races - American Indian alone (% change since 2000)
Races - Asian alone (%)
Races - Asian alone (% change since 2000)
Races - Hispanic (%)
Races - Hispanic (% change since 2000)
Races - Native Hawaiian and Other Pacific Islander alone (%)
Races - Native Hawaiian and Other Pacific Islander alone (% change since 2000)
Races - Two or more races(%)
Races - Two or more races(% change since 2000)
Races - Other race alone (%)
Races - Other race alone (% change since 2000)
Racial diversity
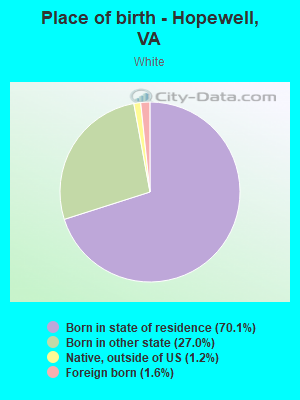
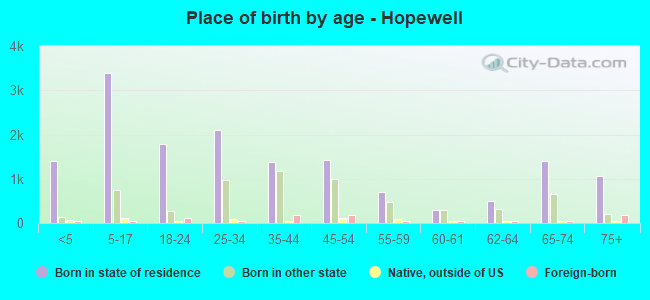
Place of birth - Born in state of residence (%)
Place of birth - Born in state of residence (%) - White
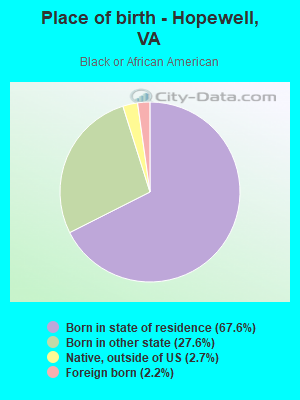
Place of birth - Born in state of residence (%) - Black or African American
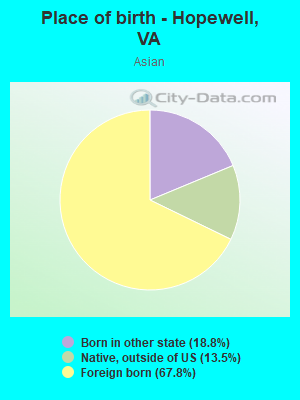
Place of birth - Born in state of residence (%) - Asian
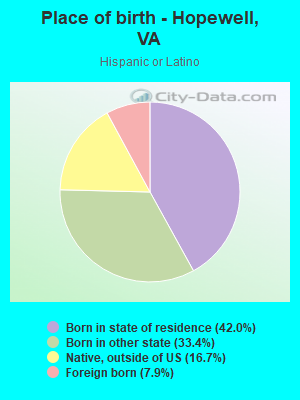
Place of birth - Born in state of residence (%) - Hispanic or Latino
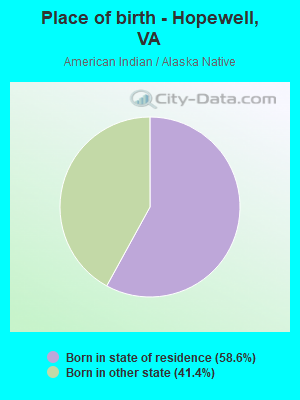
Place of birth - Born in state of residence (%) - American Indian and Alaska Native
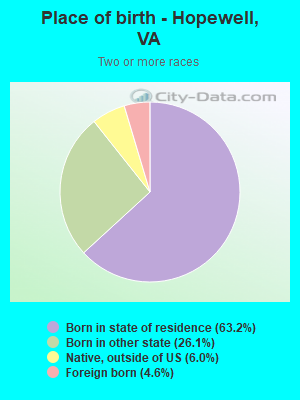
Place of birth - Born in state of residence (%) - Multirace
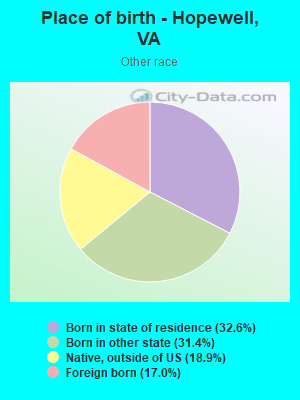
Place of birth - Born in state of residence (%) - Other Race
Place of birth - Born in other state (%)
Place of birth - Born in other state (%) - White
Place of birth - Born in other state (%) - Black or African American
Place of birth - Born in other state (%) - Asian
Place of birth - Born in other state (%) - Hispanic or Latino
Place of birth - Born in other state (%) - American Indian and Alaska Native
Place of birth - Born in other state (%) - Multirace
Place of birth - Born in other state (%) - Other Race
Place of birth - Native, outside of US (%)
Place of birth - Native, outside of US (%) - White
Place of birth - Native, outside of US (%) - Black or African American
Place of birth - Native, outside of US (%) - Asian
Place of birth - Native, outside of US (%) - Hispanic or Latino
Place of birth - Native, outside of US (%) - American Indian and Alaska Native
Place of birth - Native, outside of US (%) - Multirace
Place of birth - Native, outside of US (%) - Other Race
Place of birth - Foreign born (%)
Place of birth - Foreign born (%) - White
Place of birth - Foreign born (%) - Black or African American
Place of birth - Foreign born (%) - Asian
Place of birth - Foreign born (%) - Hispanic or Latino
Place of birth - Foreign born (%) - American Indian and Alaska Native
Place of birth - Foreign born (%) - Multirace
Place of birth - Foreign born (%) - Other Race
Residents speaking English at home (%)
Residents speaking English at home - Born in the United States (%)
Residents speaking English at home - Native, born elsewhere (%)
Residents speaking English at home - Foreign born (%)
Residents speaking Spanish at home (%)
Residents speaking Spanish at home - Born in the United States (%)
Residents speaking Spanish at home - Native, born elsewhere (%)
Residents speaking Spanish at home - Foreign born (%)
Residents speaking other language at home (%)
Residents speaking other language at home - Born in the United States (%)
Residents speaking other language at home - Native, born elsewhere (%)
Residents speaking other language at home - Foreign born (%)
Marital status - Never married (%)
Marital status - Now married (%)
Marital status - Separated (%)
Marital status - Widowed (%)
Marital status - Divorced (%)
Ancestries Reported - Arab (%)
Ancestries Reported - Czech (%)
Ancestries Reported - Danish (%)
Ancestries Reported - Dutch (%)
Ancestries Reported - English (%)
Ancestries Reported - French (%)
Ancestries Reported - French Canadian (%)
Ancestries Reported - German (%)
Ancestries Reported - Greek (%)
Ancestries Reported - Hungarian (%)
Ancestries Reported - Irish (%)
Ancestries Reported - Italian (%)
Ancestries Reported - Lithuanian (%)
Ancestries Reported - Norwegian (%)
Ancestries Reported - Polish (%)
Ancestries Reported - Portuguese (%)
Ancestries Reported - Russian (%)
Ancestries Reported - Scotch-Irish (%)
Ancestries Reported - Scottish (%)
Ancestries Reported - Slovak (%)
Ancestries Reported - Subsaharan African (%)
Ancestries Reported - Swedish (%)
Ancestries Reported - Swiss (%)
Ancestries Reported - Ukrainian (%)
Ancestries Reported - United States (%)
Ancestries Reported - Welsh (%)
Ancestries Reported - West Indian (%)
Ancestries Reported - Other (%)
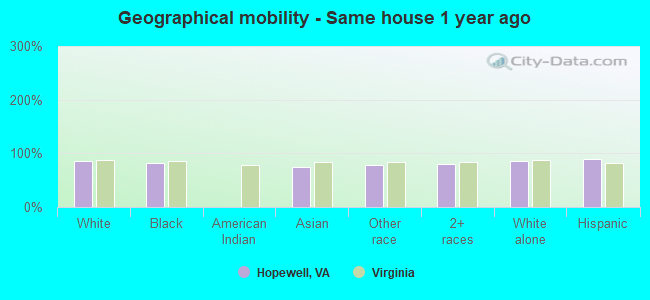
Geographical mobility - Same house 1 year ago (%)
Geographical mobility - Same house 1 year ago (%) - White
Geographical mobility - Same house 1 year ago (%) - Black or African American
Geographical mobility - Same house 1 year ago (%) - Asian
Geographical mobility - Same house 1 year ago (%) - Hispanic or Latino
Geographical mobility - Same house 1 year ago (%) - American Indian and Alaska Native
Geographical mobility - Same house 1 year ago (%) - Multirace
Geographical mobility - Same house 1 year ago (%) - Other Race
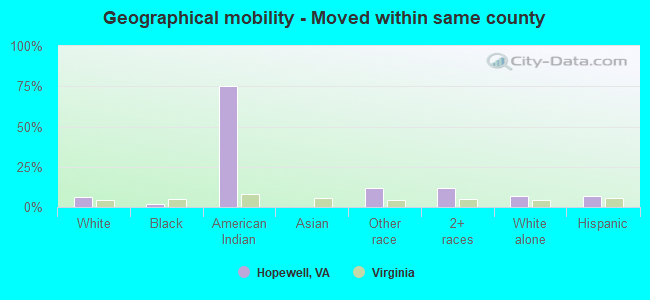
Geographical mobility - Moved within same county (%)
Geographical mobility - Moved within same county (%) - White
Geographical mobility - Moved within same county (%) - Black or African American
Geographical mobility - Moved within same county (%) - Asian
Geographical mobility - Moved within same county (%) - Hispanic or Latino
Geographical mobility - Moved within same county (%) - American Indian and Alaska Native
Geographical mobility - Moved within same county (%) - Multirace
Geographical mobility - Moved within same county (%) - Other Race
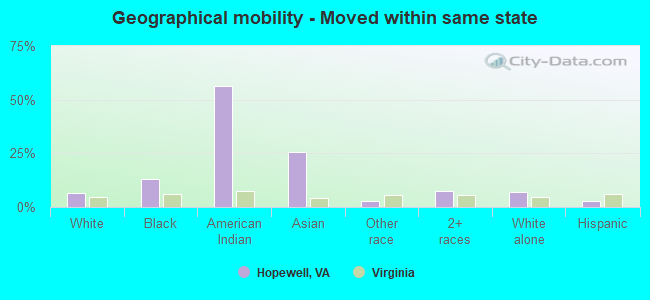
Geographical mobility - Moved from different county within same state (%)
Geographical mobility - Moved from different county within same state (%) - White
Geographical mobility - Moved from different county within same state (%) - Black or African American
Geographical mobility - Moved from different county within same state (%) - Asian
Geographical mobility - Moved from different county within same state (%) - Hispanic or Latino
Geographical mobility - Moved from different county within same state (%) - American Indian and Alaska Native
Geographical mobility - Moved from different county within same state (%) - Multirace
Geographical mobility - Moved from different county within same state (%) - Other Race
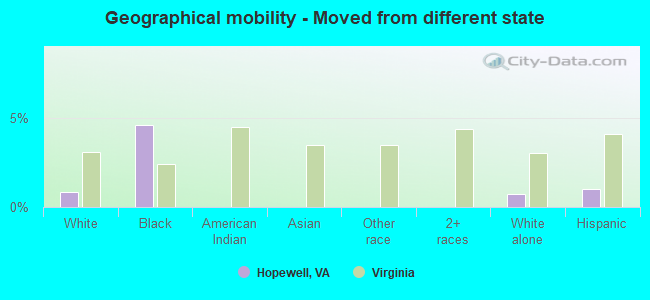
Geographical mobility - Moved from different state (%)
Geographical mobility - Moved from different state (%) - White
Geographical mobility - Moved from different state (%) - Black or African American
Geographical mobility - Moved from different state (%) - Asian
Geographical mobility - Moved from different state (%) - Hispanic or Latino
Geographical mobility - Moved from different state (%) - American Indian and Alaska Native
Geographical mobility - Moved from different state (%) - Multirace
Geographical mobility - Moved from different state (%) - Other Race
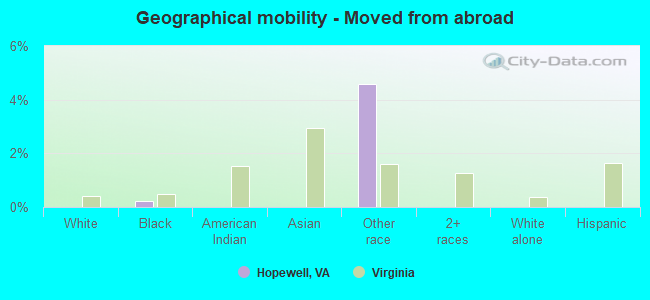
Geographical mobility - Moved from abroad (%)
Geographical mobility - Moved from abroad (%) - White
Geographical mobility - Moved from abroad (%) - Black or African American
Geographical mobility - Moved from abroad (%) - Asian
Geographical mobility - Moved from abroad (%) - Hispanic or Latino
Geographical mobility - Moved from abroad (%) - American Indian and Alaska Native
Geographical mobility - Moved from abroad (%) - Multirace
Geographical mobility - Moved from abroad (%) - Other Race
Place of birth for the foreign-born population - Ireland (%)
Place of birth for the foreign-born population - Denmark (%)
Place of birth for the foreign-born population - Norway (%)
Place of birth for the foreign-born population - Sweden (%)
Place of birth for the foreign-born population - United Kingdom (%)
Place of birth for the foreign-born population - England (%)
Place of birth for the foreign-born population - Scotland (%)
Place of birth for the foreign-born population - Other Northern Europe (%)
Place of birth for the foreign-born population - Austria (%)
Place of birth for the foreign-born population - Belgium (%)
Place of birth for the foreign-born population - France (%)
Place of birth for the foreign-born population - Germany (%)
Place of birth for the foreign-born population - Netherlands (%)
Place of birth for the foreign-born population - Switzerland (%)
Place of birth for the foreign-born population - Other Western Europe (%)
Place of birth for the foreign-born population - Greece (%)
Place of birth for the foreign-born population - Italy (%)
Place of birth for the foreign-born population - Portugal (%)
Place of birth for the foreign-born population - Spain (%)
Place of birth for the foreign-born population - Other Southern Europe (%)
Place of birth for the foreign-born population - Albania (%)
Place of birth for the foreign-born population - Belarus (%)
Place of birth for the foreign-born population - Bosnia and Herzegovina (%)
Place of birth for the foreign-born population - Bulgaria (%)
Place of birth for the foreign-born population - Croatia (%)
Place of birth for the foreign-born population - Czechoslovakia (%)
Place of birth for the foreign-born population - Hungary (%)
Place of birth for the foreign-born population - Latvia (%)
Place of birth for the foreign-born population - Lithuania (%)
Place of birth for the foreign-born population - North Macedonia (Macedonia) (%)
Place of birth for the foreign-born population - Moldova (%)
Place of birth for the foreign-born population - Poland (%)
Place of birth for the foreign-born population - Romania (%)
Place of birth for the foreign-born population - Russia (%)
Place of birth for the foreign-born population - Serbia (%)
Place of birth for the foreign-born population - Ukraine (%)
Place of birth for the foreign-born population - Other Eastern Europe (%)
Place of birth for the foreign-born population - China (%)
Place of birth for the foreign-born population - Hong Kong (%)
Place of birth for the foreign-born population - Taiwan (%)
Place of birth for the foreign-born population - Japan (%)
Place of birth for the foreign-born population - Korea (%)
Place of birth for the foreign-born population - Other Eastern Asia (%)
Place of birth for the foreign-born population - Afghanistan (%)
Place of birth for the foreign-born population - Bangladesh (%)
Place of birth for the foreign-born population - India (%)
Place of birth for the foreign-born population - Iran (%)
Place of birth for the foreign-born population - Kazakhstan (%)
Place of birth for the foreign-born population - Nepal (%)
Place of birth for the foreign-born population - Pakistan (%)
Place of birth for the foreign-born population - Sri Lanka (%)
Place of birth for the foreign-born population - Uzbekistan (%)
Place of birth for the foreign-born population - Other South Central Asia (%)
Place of birth for the foreign-born population - Burma (%)
Place of birth for the foreign-born population - Cambodia (%)
Place of birth for the foreign-born population - Indonesia (%)
Place of birth for the foreign-born population - Laos (%)
Place of birth for the foreign-born population - Malaysia (%)
Place of birth for the foreign-born population - Philippines (%)
Place of birth for the foreign-born population - Singapore (%)
Place of birth for the foreign-born population - Thailand (%)
Place of birth for the foreign-born population - Vietnam (%)
Place of birth for the foreign-born population - Other South Eastern Asia (%)
Place of birth for the foreign-born population - Armenia (%)
Place of birth for the foreign-born population - Iraq (%)
Place of birth for the foreign-born population - Israel (%)
Place of birth for the foreign-born population - Jordan (%)
Place of birth for the foreign-born population - Kuwait (%)
Place of birth for the foreign-born population - Lebanon (%)
Place of birth for the foreign-born population - Saudi Arabia (%)
Place of birth for the foreign-born population - Syria (%)
Place of birth for the foreign-born population - Turkey (%)
Place of birth for the foreign-born population - Yemen (%)
Place of birth for the foreign-born population - Other Western Asia (%)
Place of birth for the foreign-born population - Eritrea (%)
Place of birth for the foreign-born population - Ethiopia (%)
Place of birth for the foreign-born population - Kenya (%)
Place of birth for the foreign-born population - Somalia (%)
Place of birth for the foreign-born population - Uganda (%)
Place of birth for the foreign-born population - Zimbabwe (%)
Place of birth for the foreign-born population - Other Eastern Africa (%)
Place of birth for the foreign-born population - Cameroon (%)
Place of birth for the foreign-born population - Congo (%)
Place of birth for the foreign-born population - Democratic Republic of Congo (Zaire) (%)
Place of birth for the foreign-born population - Other Middle Africa (%)
Place of birth for the foreign-born population - Egypt (%)
Place of birth for the foreign-born population - Morocco (%)
Place of birth for the foreign-born population - Sudan (%)
Place of birth for the foreign-born population - Other Northern Africa (%)
Place of birth for the foreign-born population - South Africa (%)
Place of birth for the foreign-born population - Other Southern Africa (%)
Place of birth for the foreign-born population - Cabo Verde (%)
Place of birth for the foreign-born population - Ghana (%)
Place of birth for the foreign-born population - Liberia (%)
Place of birth for the foreign-born population - Nigeria (%)
Place of birth for the foreign-born population - Senegal (%)
Place of birth for the foreign-born population - Sierra Leone (%)
Place of birth for the foreign-born population - Other Western Africa (%)
Place of birth for the foreign-born population - Australia (%)
Place of birth for the foreign-born population - New Zealand (%)
Place of birth for the foreign-born population - Fiji (%)
Place of birth for the foreign-born population - Micronesia (%)
Place of birth for the foreign-born population - Bahamas (%)
Place of birth for the foreign-born population - Barbados (%)
Place of birth for the foreign-born population - Cuba (%)
Place of birth for the foreign-born population - Dominica (%)
Place of birth for the foreign-born population - Dominican Republic (%)
Place of birth for the foreign-born population - Grenada (%)
Place of birth for the foreign-born population - Haiti (%)
Place of birth for the foreign-born population - Jamaica (%)
Place of birth for the foreign-born population - St. Vincent and the Grenadines (%)
Place of birth for the foreign-born population - Trinidad and Tobago (%)
Place of birth for the foreign-born population - West Indies (%)
Place of birth for the foreign-born population - Other Caribbean (%)
Place of birth for the foreign-born population - Belize (%)
Place of birth for the foreign-born population - Costa Rica (%)
Place of birth for the foreign-born population - El Salvador (%)
Place of birth for the foreign-born population - Guatemala (%)
Place of birth for the foreign-born population - Honduras (%)
Place of birth for the foreign-born population - Mexico (%)
Place of birth for the foreign-born population - Nicaragua (%)
Place of birth for the foreign-born population - Panama (%)
Place of birth for the foreign-born population - Other Central America (%)
Place of birth for the foreign-born population - Argentina (%)
Place of birth for the foreign-born population - Bolivia (%)
Place of birth for the foreign-born population - Brazil (%)
Place of birth for the foreign-born population - Chile (%)
Place of birth for the foreign-born population - Colombia (%)
Place of birth for the foreign-born population - Ecuador (%)
Place of birth for the foreign-born population - Guyana (%)
Place of birth for the foreign-born population - Peru (%)
Place of birth for the foreign-born population - Uruguay (%)
Place of birth for the foreign-born population - Venezuela (%)
Place of birth for the foreign-born population - Other South America (%)
Place of birth for the foreign-born population - Canada (%)
Place of birth for the foreign-born population - Other Northern America (%)
Place of birth for the foreign-born population - Other (%)
Latest news about races in Hopewell, VA collected exclusively by city-data.com from local newspapers, TV, and radio stations
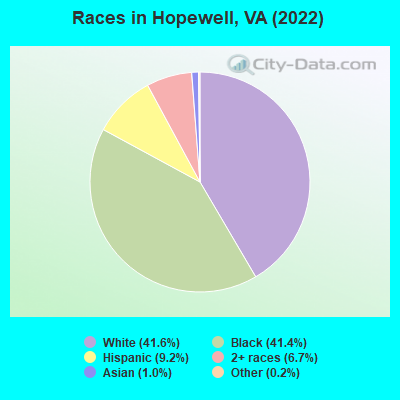
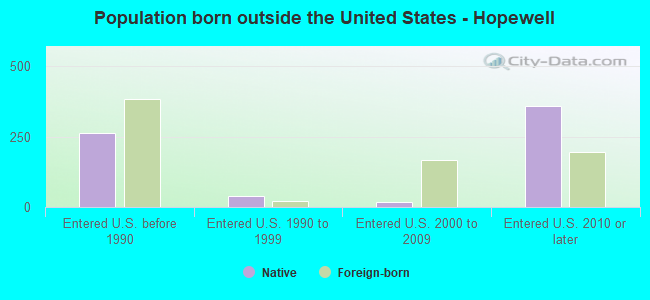
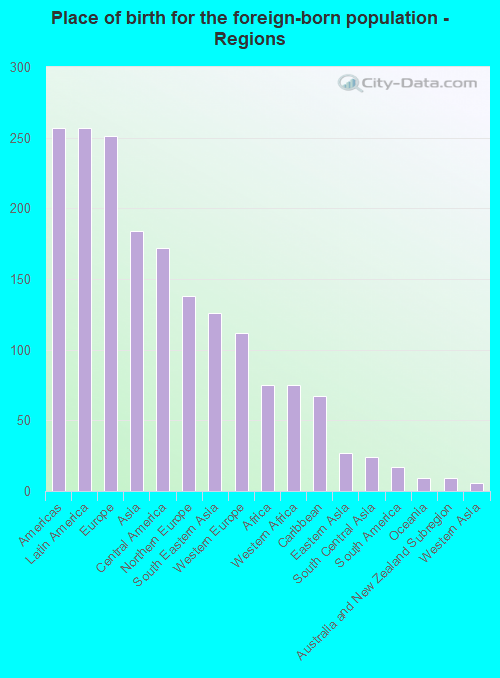
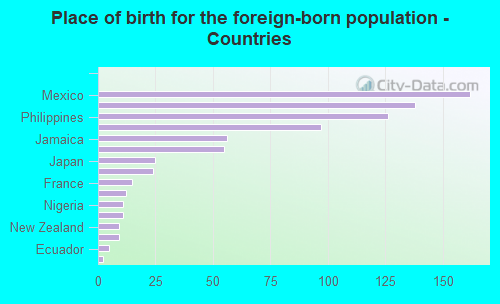
According to 2022 data, the most numerous races in Hopewell, VA are White alone (9,653 residents), Black alone (9,606 residents), and Hispanic (2,139 residents). 94.0% of Hopewell residents speak English at home. 3.3% of Hopewell, VA residents are foreign-born (1.1% born in Latin America, 1.1% born in Europe, 0.8% born in Asia), which is 258.4% less than the foreign-born rate of 12.0% across the entire state of Virginia.
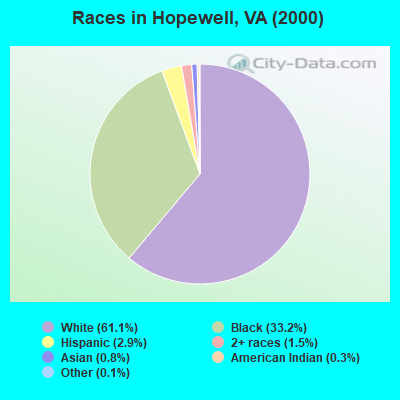
Race distribution in Hopewell
2000 2022
4,965,637 70.2% White alone 1,376,378 19.4% Black alone 329,540 4.7% Hispanic 259,277 3.7% Asian alone 114,022 1.6% Two or more races 18,596 0.3% American Indian alone 11,685 0.2% Other race alone 3,380 0.05% Native Hawaiian and Other
5,095,130 58.7% White alone 1,594,785 18.4% Black alone 905,750 10.4% Hispanic 602,881 6.9% Asian alone 406,047 4.7% Two or more races 60,419 0.7% Other race alone 11,738 0.1% American Indian alone 6,869 0.08% Native Hawaiian and Other
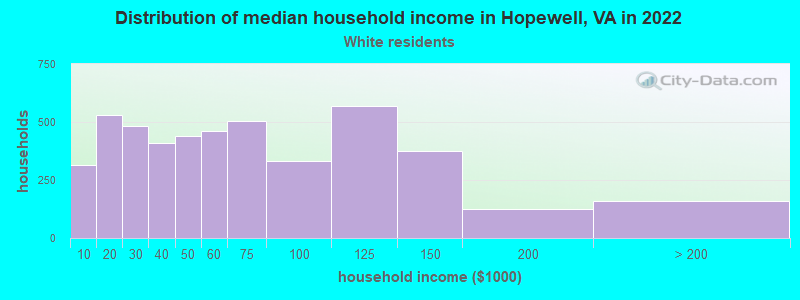
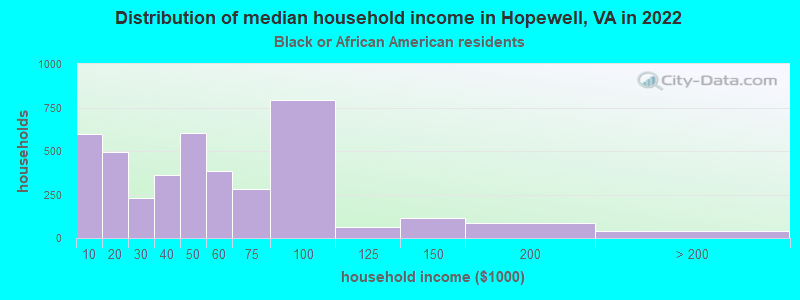
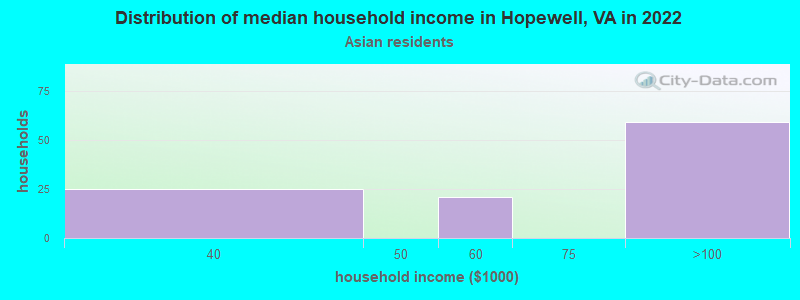
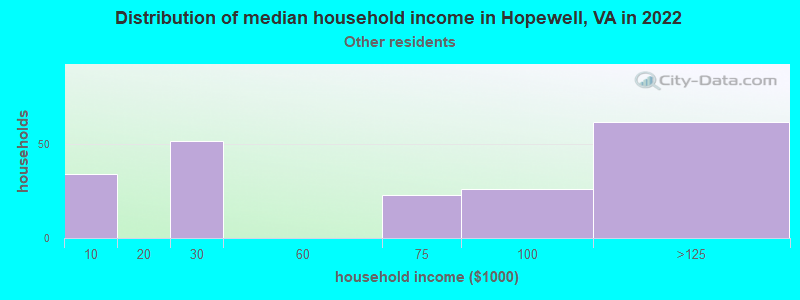
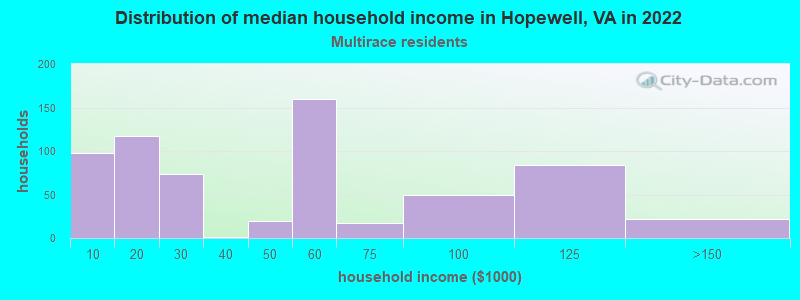
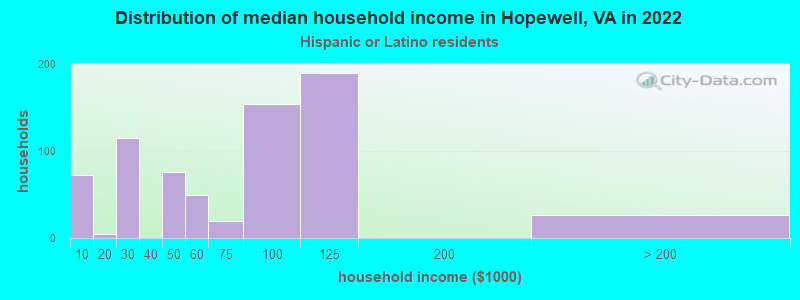
Income and house value in Hopewell Median household income in 2022 $51,948 White non-Hispanic householders$44,375 Black householders$95,572 Asian householders$52,563 Two or more races householders$77,386 Hispanic or Latino race householdersMedian 2022 house value $166,545 White Non-Hispanic householders$151,924 Black or African American householders$68,864 American Indian or Alaska Native householders $125,862 Asian householders$146,415 Some other race householders$138,575 Two or more races householders$158,917 Hispanic or Latino householders
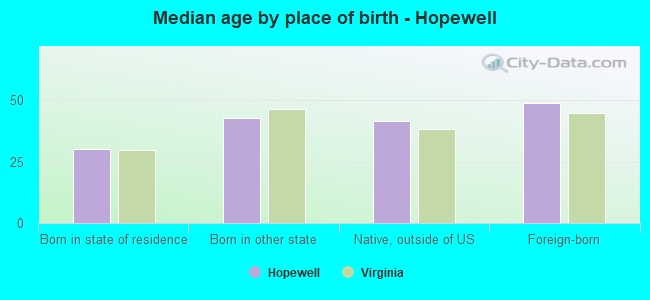
Median age by race in Hopewell
42.7 Median age for White residents37.1 49.5 33.6 Median age for Black or African American residents32.6 34.5 -682,215,742.8 Median age for American Indian / Alaska Native residents-682,352,940.5 -687,861,271.0 38.9 Median age for Asian residents-681,198,909.4 38.9 -611,955,419.9 Median age for Native Hawaiian / Pacific Islander residents-541,531,822.5 -714,150,046.8 29.2 Median age for Other race residents31.3 25.7 22.9 Median age for Two or more races residents10.4 29.7 45.7 Median age for White alone residents41.3 49.5 27.5 Median age for Hispanic or Latino residents23.7 32.1
Owner/renter occupied households by race in Hopewell
House owners and renters - White residents 3,249 70.0% Owner occupied1,395 30.0% Renter occupiedHouse owners and renters - Black or African American residents 1,494 37.5% Owner occupied2,488 62.5% Renter occupiedHouse owners and renters - American Indian / Alaska Native residents 3 100.0% Renter occupiedHouse owners and renters - Asian residents 111 100.0% Owner occupiedHouse owners and renters - Other race residents 111 53.6% Owner occupied96 46.4% Renter occupiedHouse owners and renters - Two or more races residents 243 38.2% Owner occupied394 61.8% Renter occupiedHouse owners and renters - White alone residents 3,016 68.1% Owner occupied1,415 31.9% Renter occupiedHouse owners and renters - Hispanic or Latino residents 487 65.7% Owner occupied254 34.3% Renter occupied
Language usage in Hopewell
English speakers - Total 94.0% of residents of Hopewell speak English at home.
4.1% of residents speak Spanish at home 598 68.2% Speak English very well279 31.8% Speak English less than very well1.6% of residents speak other language at home 186 53.4% Speak English very well162 46.6% Speak English less than very well
English speakers - Born in the United States 95.5% of residents of Hopewell speak English at home.
4.4% of residents speak Spanish at home 235 87.0% Speak English very well35 13.0% Speak English less than very well
English speakers - Native, born elsewhere 41.6% of residents of Hopewell speak English at home.
47.8% of residents speak Spanish at home 179 64.9% Speak English very well97 35.1% Speak English less than very well14.9% of residents speak other language at home 86 100.0% Speak English less than very well
English speakers - Foreign-born 47.0% of residents of Hopewell speak English at home.
20.2% of residents speak Spanish at home 46 29.3% Speak English very well111 70.7% Speak English less than very well32.3% of residents speak other language at home 146 57.9% Speak English very well106 42.1% Speak English less than very well
White (Caucasian) - Speak only English Native:
99.8% (9,573)Foreign-born:
98.0% (164)
White (Caucasian) - Speak another language Native:
0.9% (83)Foreign-born:
18.0% (30)
Black or African American - Speak only English Native:
97.9% (8,752)Foreign-born:
57.5% (126)
Black or African American - Speak another language Native:
2.1% (186)Foreign-born:
37.0% (81)
Asian - Speak only English Native:
55.1% (39)Foreign-born:
19.0% (30)
Asian - Speak another language Native:
44.2% (32)Foreign-born:
81.3% (127)
Other race - Speak another language Native:
78.7% (418)Foreign-born:
98.4% (121)
Two or more races - Speak only English Native:
85.5% (1,461)Foreign-born:
12.2% (13)
Two or more races - Speak another language Native:
13.5% (231)Foreign-born:
87.8% (90)
White alone - Speak only English Native:
99.5% (8,941)Foreign-born:
75.7% (170)
White alone - Speak another language Native:
0.5% (48)Foreign-born:
20.3% (46)
Hispanic or Latino - Speak only English Native:
63.9% (1,179)Foreign-born:
8.5% (15)
Hispanic or Latino - Speak another language Native:
36.8% (679)Foreign-born:
91.6% (159)
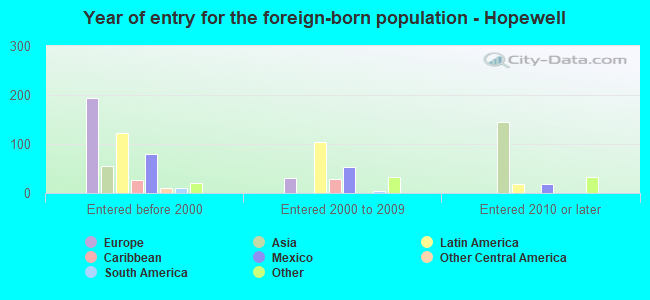
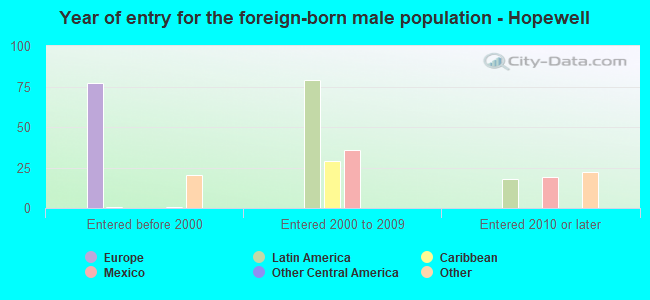
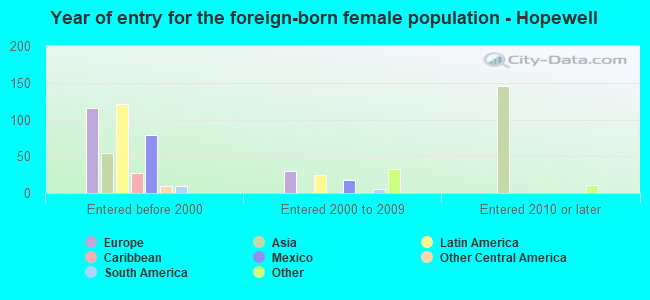
Foreign-born residents in Hopewell 777 residents are foreign born (1.1% Latin America , 1.1% Europe , 0.8% Asia ).
This city:
3.3%Virginia:
12.6%
Marital status for residents in Hopewell Marital status - White (Caucasian) population 15 years and over
Males 35.0% Never married43.9% Now married2.1% Separated7.0% Widowed11.9% DivorcedFemales 20.8% Never married40.3% Now married2.3% Separated14.0% Widowed22.5% DivorcedWomen who gave birth in the past 12 months Now married:
60.7% (48)Unmarried:
39.3% (31)
Women who did not give birth in the past 12 months Now married:
47.0% (849)Unmarried:
53.0% (958)
Marital status - Black or African American population 15 years and over
Males 47.2% Never married38.3% Now married2.4% Separated2.1% Widowed10.0% DivorcedFemales 47.8% Never married27.1% Now married5.2% Separated5.2% Widowed14.8% DivorcedWomen who gave birth in the past 12 months Now married:
0.0% (0)Unmarried:
100.0% (194)
Women who did not give birth in the past 12 months Now married:
24.8% (654)Unmarried:
75.2% (1,984)
Marital status - Other race population 15 years and over
Males 28.8% Never married71.2% Now married0.0% Separated0.0% Widowed0.0% DivorcedFemales 25.1% Never married63.1% Now married0.0% Separated0.0% Widowed11.8% DivorcedWomen who did not give birth in the past 12 months Now married:
44.6% (76)Unmarried:
55.4% (95)
Marital status - Two or more races population 15 years and over
Males 40.2% Never married43.5% Now married0.0% Separated3.3% Widowed13.0% DivorcedFemales 32.1% Never married30.7% Now married6.0% Separated3.9% Widowed27.3% DivorcedWomen who gave birth in the past 12 months Now married:
0.0% (0)Unmarried:
100.0% (15)
Women who did not give birth in the past 12 months Now married:
30.9% (168)Unmarried:
69.1% (376)
Marital status - White alone, not Hispanic / Latino population 15 years and over
Males 35.2% Never married44.2% Now married2.3% Separated7.5% Widowed10.8% DivorcedFemales 20.3% Never married39.5% Now married2.4% Separated14.6% Widowed23.2% DivorcedWomen who gave birth in the past 12 months Now married:
45.0% (26)Unmarried:
55.0% (32)
Women who did not give birth in the past 12 months Now married:
45.7% (816)Unmarried:
54.3% (970)
Marital status - Hispanic or Latino population 15 years and over
Males 35.2% Never married52.8% Now married0.0% Separated0.0% Widowed11.9% DivorcedFemales 27.2% Never married46.1% Now married5.3% Separated2.0% Widowed19.5% DivorcedWomen who gave birth in the past 12 months Now married:
100.0% (25)Unmarried:
0.0% (0)
Women who did not give birth in the past 12 months Now married:
41.1% (200)Unmarried:
58.9% (285)
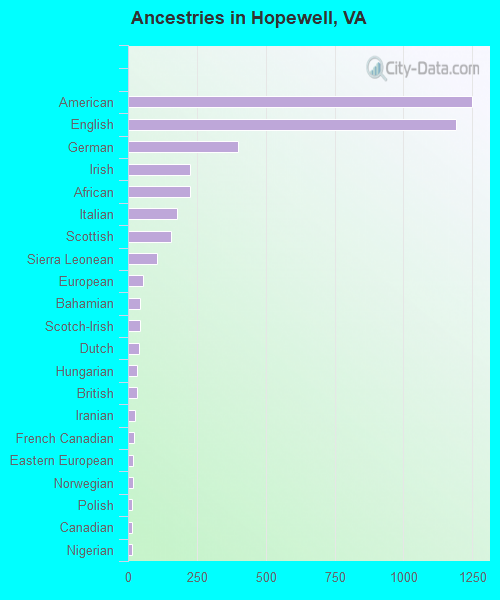
Ancestries in Hopewell
1,248 9.8% American1,192 9.4% English399 3.1% German226 1.8% Irish226 1.8% African178 1.4% Italian157 1.2% Scottish104 0.8% Sierra Leonean54 0.4% European44 0.3% Bahamian43 0.3% Scotch-Irish40 0.3% Dutch32 0.3% Hungarian31 0.2% British25 0.2% Iranian23 0.2% French Canadian19 0.1% Eastern European19 0.1% Norwegian15 0.1% Polish14 0.1% Canadian13 0.1% Nigerian10 0.08% Austrian10 0.08% Barbadian9 0.07% Greek6 0.05% Danish5 0.04% Moroccan
Geographical mobility in Hopewell Same house 1 year ago 8,667 85.7% White (Caucasian)8,039 81.9% Black or African American170 74.8% Asian536 77.5% Other race1,726 81.0% Two or more races8,177 84.9% White alone, not Hispanic / Latino1,854 89.5% Hispanic or LatinoMoved within same county 651 6.4% White / Caucasian163 1.7% Black or African American4 75.3% American Indian / Alaska Native81 11.7% Other race246 11.6% Two or more races669 6.9% White alone, not Hispanic / Latino139 6.7% Hispanic or LatinoMoved within same state 676 6.7% White / Caucasian1,258 12.8% Black or African American3 56.6% American Indian / Alaska Native58 25.6% Asian20 2.9% Other race155 7.3% Two or more races666 6.9% White alone, not Hispanic / Latino53 2.6% Hispanic or LatinoMoved from different state 84 0.8% White / Caucasian448 4.6% Black or African American68 0.7% White alone, not Hispanic / Latino21 1.0% Hispanic or LatinoMoved from abroad 23 0.2% Black or African American32 4.6% Other race
Children Nativity (place of birth) in Hopewell
Children under 6 years - Living with two parents Both parents native 503 100.0% NativeBoth parents foreign-born 18 100.0% NativeOne native, one foreign-born parent 143 100.0% NativeChildren under 6 years - Living with one parent Native parent 1,077 100.0% NativeForeign-born parent 19 100.0% NativeChildren 6 to 17 years - Living with two parents Both parents native 1,247 100.0% NativeBoth parents foreign-born 86 100.0% NativeOne native, one foreign-born parent 114 100.0% NativeChildren 6 to 17 years - Living with one parent Native parent 2,196 100.0% NativeForeign-born parent 98 49.9% Native99 50.1% Foreign-born
Grandparents responsible for own grandchildren in Hopewell
Grandparents (30 to 59 years) White / Caucasian 99 45.8% Responsible for grandchildren117 54.2% Not responsible for grandchildrenBlack or African American 78 40.0% Responsible for grandchildren118 60.0% Not responsible for grandchildrenTwo or more races 129 95.4% Responsible for grandchildren6 4.6% Not responsible for grandchildrenWhite alone, not Hispanic / Latino 100 43.5% Responsible for grandchildren130 56.5% Not responsible for grandchildrenHispanic or Latino 84 100.0% Not responsible for grandchildrenGrandparents (60 years and over) White / Caucasian 90 39.0% Responsible for grandchildren141 61.0% Not responsible for grandchildrenBlack or African American 68 69.7% Responsible for grandchildren29 30.3% Not responsible for grandchildrenTwo or more races 98 100.0% Not responsible for grandchildrenWhite alone, not Hispanic / Latino 91 38.0% Responsible for grandchildren149 62.0% Not responsible for grandchildren