Races in Holliston, Massachusetts (MA) Detailed Stats
Ancestries, Foreign-born residents, place of birth

Recent posts about races in Holliston, Massachusetts on our local forum with over 2,400,000 registered users:
 | A house in Holliston or somewhere else? (from Natick) (10 replies) |
| towns that offer the most jobs per dollar of house (58 replies) |
| House recommendations sub $850k (11 replies) |
| Ashland, Holliston, maybe Norfolk? (20 replies) |
| Holliston Placentino Elementary School -Feedback on French Immersion Program (3 replies) |
| Holliston - right for first house? (16 replies) |
Latest news about races in Holliston, MA collected exclusively by city-data.com from local newspapers, TV, and radio stations
5.3% of Holliston, MA residents are foreign-born (1.7% born in Europe, 1.3% born in Latin America, 1.2% born in North America, 1.0% born in Asia), which is 239.8% less than the foreign-born rate of 18.0% across the entire state of Massachusetts.
Race distribution in Holliston

- 13,20895.7%White alone
- 1901.4%Hispanic
- 1651.2%Asian alone
- 1190.9%Black alone
- 850.6%Two or more races
- 190.1%Other race alone
- 140.1%American Indian alone
- 10.01%Native Hawaiian and Other
Pacific Islander alone

2000
2022
-
- 5,198,35981.9%White alone
- 428,7296.8%Hispanic
- 318,3295.0%Black alone
- 236,7863.7%Asian alone
- 110,3381.7%Two or more races
- 43,5860.7%Other race alone
- 11,2640.2%American Indian alone
- 1,7060.03%Native Hawaiian and Other
Pacific Islander alone

-
- 4,676,62767.0%White alone
- 911,03813.0%Hispanic
- 501,4637.2%Asian alone
- 459,7406.6%Black alone
- 341,8894.9%Two or more races
- 84,4031.2%Other race alone
- 5,8380.08%American Indian alone
- 9760.01%Native Hawaiian and Other
Pacific Islander alone

Income and house value in Holliston
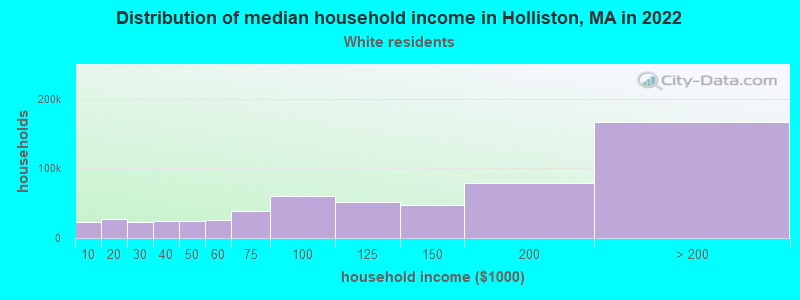
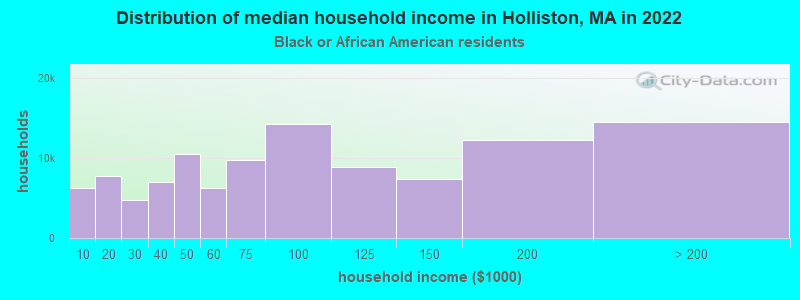
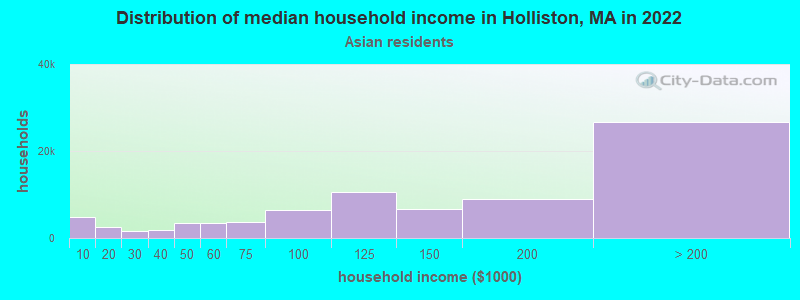
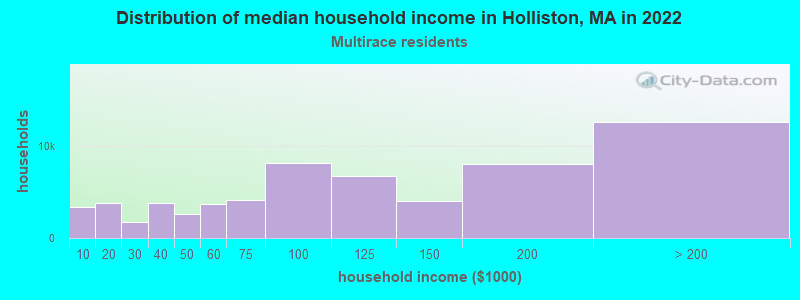
- Median household income in 2022
- $155,027White non-Hispanic householders
- over $200,000Black householders
- $137,556Asian householders
- $106,373Some other race householders
- $141,916Two or more races householders
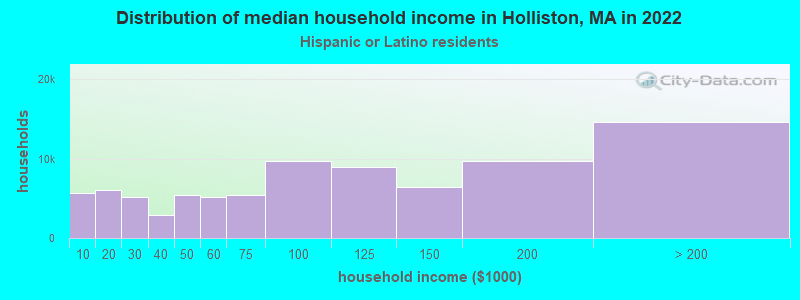
- $186,756Hispanic or Latino race householders
- Median 2022 house value
- $671,297White Non-Hispanic householders
- $529,971Black or African American householders
- $630,595Asian householders
- $529,971Some other race householders
- $759,766Two or more races householders
- $554,279Hispanic or Latino householders
Household income for White non-Hispanic householders
Household income for Black householders
Household income for Asian householders
Household income for Two or more races householders
Household income for Hispanic or Latino race householders
Foreign-born residents in Holliston
731 residents are foreign born (1.7% Europe, 1.3% Latin America, 1.2% North America, 1.0% Asia).
| This city: | 5.3% |
| Massachusetts: | 12.2% |
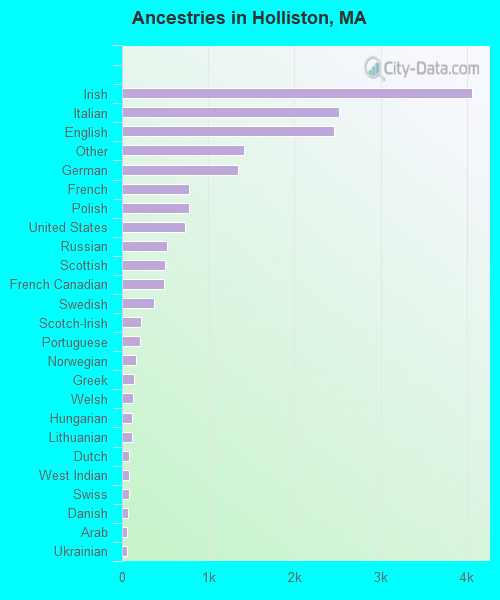
Ancestries in Holliston

- 4,05523.1%Irish
- 2,52114.4%Italian
- 2,45914.0%English
- 1,4188.1%Other
- 1,3407.6%German
- 7754.4%French
- 7724.4%Polish
- 7304.2%United States
- 5183.0%Russian
- 4982.8%Scottish
- 4912.8%French Canadian
- 3692.1%Swedish
- 2221.3%Scotch-Irish
- 2051.2%Portuguese
- 1630.9%Norwegian
- 1410.8%Greek
- 1220.7%Welsh
- 1180.7%Hungarian
- 1160.7%Lithuanian
- 870.5%Dutch
- 830.5%West Indian
- 790.5%Swiss
- 680.4%Danish
- 600.3%Arab
- 570.3%Ukrainian
- 420.2%Czech
- 300.2%Slovak
Zip codes: 01746.