Races in Holladay, Utah (UT) Detailed Stats
Data:
Races - White alone (%)
Races - White alone (% change since 2000)
Races - Black alone (%)
Races - Black alone (% change since 2000)
Races - American Indian alone (%)
Races - American Indian alone (% change since 2000)
Races - Asian alone (%)
Races - Asian alone (% change since 2000)
Races - Hispanic (%)
Races - Hispanic (% change since 2000)
Races - Native Hawaiian and Other Pacific Islander alone (%)
Races - Native Hawaiian and Other Pacific Islander alone (% change since 2000)
Races - Two or more races(%)
Races - Two or more races(% change since 2000)
Races - Other race alone (%)
Races - Other race alone (% change since 2000)
Racial diversity
Place of birth - Born in state of residence (%)
Place of birth - Born in state of residence (%) - White
Place of birth - Born in state of residence (%) - Black or African American
Place of birth - Born in state of residence (%) - Asian
Place of birth - Born in state of residence (%) - Hispanic or Latino
Place of birth - Born in state of residence (%) - American Indian and Alaska Native
Place of birth - Born in state of residence (%) - Multirace
Place of birth - Born in state of residence (%) - Other Race
Place of birth - Born in other state (%)
Place of birth - Born in other state (%) - White
Place of birth - Born in other state (%) - Black or African American
Place of birth - Born in other state (%) - Asian
Place of birth - Born in other state (%) - Hispanic or Latino
Place of birth - Born in other state (%) - American Indian and Alaska Native
Place of birth - Born in other state (%) - Multirace
Place of birth - Born in other state (%) - Other Race
Place of birth - Native, outside of US (%)
Place of birth - Native, outside of US (%) - White
Place of birth - Native, outside of US (%) - Black or African American
Place of birth - Native, outside of US (%) - Asian
Place of birth - Native, outside of US (%) - Hispanic or Latino
Place of birth - Native, outside of US (%) - American Indian and Alaska Native
Place of birth - Native, outside of US (%) - Multirace
Place of birth - Native, outside of US (%) - Other Race
Place of birth - Foreign born (%)
Place of birth - Foreign born (%) - White
Place of birth - Foreign born (%) - Black or African American
Place of birth - Foreign born (%) - Asian
Place of birth - Foreign born (%) - Hispanic or Latino
Place of birth - Foreign born (%) - American Indian and Alaska Native
Place of birth - Foreign born (%) - Multirace
Place of birth - Foreign born (%) - Other Race
Residents speaking English at home (%)
Residents speaking English at home - Born in the United States (%)
Residents speaking English at home - Native, born elsewhere (%)
Residents speaking English at home - Foreign born (%)
Residents speaking Spanish at home (%)
Residents speaking Spanish at home - Born in the United States (%)
Residents speaking Spanish at home - Native, born elsewhere (%)
Residents speaking Spanish at home - Foreign born (%)
Residents speaking other language at home (%)
Residents speaking other language at home - Born in the United States (%)
Residents speaking other language at home - Native, born elsewhere (%)
Residents speaking other language at home - Foreign born (%)
Marital status - Never married (%)
Marital status - Now married (%)
Marital status - Separated (%)
Marital status - Widowed (%)
Marital status - Divorced (%)
Ancestries Reported - Arab (%)
Ancestries Reported - Czech (%)
Ancestries Reported - Danish (%)
Ancestries Reported - Dutch (%)
Ancestries Reported - English (%)
Ancestries Reported - French (%)
Ancestries Reported - French Canadian (%)
Ancestries Reported - German (%)
Ancestries Reported - Greek (%)
Ancestries Reported - Hungarian (%)
Ancestries Reported - Irish (%)
Ancestries Reported - Italian (%)
Ancestries Reported - Lithuanian (%)
Ancestries Reported - Norwegian (%)
Ancestries Reported - Polish (%)
Ancestries Reported - Portuguese (%)
Ancestries Reported - Russian (%)
Ancestries Reported - Scotch-Irish (%)
Ancestries Reported - Scottish (%)
Ancestries Reported - Slovak (%)
Ancestries Reported - Subsaharan African (%)
Ancestries Reported - Swedish (%)
Ancestries Reported - Swiss (%)
Ancestries Reported - Ukrainian (%)
Ancestries Reported - United States (%)
Ancestries Reported - Welsh (%)
Ancestries Reported - West Indian (%)
Ancestries Reported - Other (%)
Geographical mobility - Same house 1 year ago (%)
Geographical mobility - Same house 1 year ago (%) - White
Geographical mobility - Same house 1 year ago (%) - Black or African American
Geographical mobility - Same house 1 year ago (%) - Asian
Geographical mobility - Same house 1 year ago (%) - Hispanic or Latino
Geographical mobility - Same house 1 year ago (%) - American Indian and Alaska Native
Geographical mobility - Same house 1 year ago (%) - Multirace
Geographical mobility - Same house 1 year ago (%) - Other Race
Geographical mobility - Moved within same county (%)
Geographical mobility - Moved within same county (%) - White
Geographical mobility - Moved within same county (%) - Black or African American
Geographical mobility - Moved within same county (%) - Asian
Geographical mobility - Moved within same county (%) - Hispanic or Latino
Geographical mobility - Moved within same county (%) - American Indian and Alaska Native
Geographical mobility - Moved within same county (%) - Multirace
Geographical mobility - Moved within same county (%) - Other Race
Geographical mobility - Moved from different county within same state (%)
Geographical mobility - Moved from different county within same state (%) - White
Geographical mobility - Moved from different county within same state (%) - Black or African American
Geographical mobility - Moved from different county within same state (%) - Asian
Geographical mobility - Moved from different county within same state (%) - Hispanic or Latino
Geographical mobility - Moved from different county within same state (%) - American Indian and Alaska Native
Geographical mobility - Moved from different county within same state (%) - Multirace
Geographical mobility - Moved from different county within same state (%) - Other Race
Geographical mobility - Moved from different state (%)
Geographical mobility - Moved from different state (%) - White
Geographical mobility - Moved from different state (%) - Black or African American
Geographical mobility - Moved from different state (%) - Asian
Geographical mobility - Moved from different state (%) - Hispanic or Latino
Geographical mobility - Moved from different state (%) - American Indian and Alaska Native
Geographical mobility - Moved from different state (%) - Multirace
Geographical mobility - Moved from different state (%) - Other Race
Geographical mobility - Moved from abroad (%)
Geographical mobility - Moved from abroad (%) - White
Geographical mobility - Moved from abroad (%) - Black or African American
Geographical mobility - Moved from abroad (%) - Asian
Geographical mobility - Moved from abroad (%) - Hispanic or Latino
Geographical mobility - Moved from abroad (%) - American Indian and Alaska Native
Geographical mobility - Moved from abroad (%) - Multirace
Geographical mobility - Moved from abroad (%) - Other Race
Place of birth for the foreign-born population - Ireland (%)
Place of birth for the foreign-born population - Denmark (%)
Place of birth for the foreign-born population - Norway (%)
Place of birth for the foreign-born population - Sweden (%)
Place of birth for the foreign-born population - United Kingdom (%)
Place of birth for the foreign-born population - England (%)
Place of birth for the foreign-born population - Scotland (%)
Place of birth for the foreign-born population - Other Northern Europe (%)
Place of birth for the foreign-born population - Austria (%)
Place of birth for the foreign-born population - Belgium (%)
Place of birth for the foreign-born population - France (%)
Place of birth for the foreign-born population - Germany (%)
Place of birth for the foreign-born population - Netherlands (%)
Place of birth for the foreign-born population - Switzerland (%)
Place of birth for the foreign-born population - Other Western Europe (%)
Place of birth for the foreign-born population - Greece (%)
Place of birth for the foreign-born population - Italy (%)
Place of birth for the foreign-born population - Portugal (%)
Place of birth for the foreign-born population - Spain (%)
Place of birth for the foreign-born population - Other Southern Europe (%)
Place of birth for the foreign-born population - Albania (%)
Place of birth for the foreign-born population - Belarus (%)
Place of birth for the foreign-born population - Bosnia and Herzegovina (%)
Place of birth for the foreign-born population - Bulgaria (%)
Place of birth for the foreign-born population - Croatia (%)
Place of birth for the foreign-born population - Czechoslovakia (%)
Place of birth for the foreign-born population - Hungary (%)
Place of birth for the foreign-born population - Latvia (%)
Place of birth for the foreign-born population - Lithuania (%)
Place of birth for the foreign-born population - North Macedonia (Macedonia) (%)
Place of birth for the foreign-born population - Moldova (%)
Place of birth for the foreign-born population - Poland (%)
Place of birth for the foreign-born population - Romania (%)
Place of birth for the foreign-born population - Russia (%)
Place of birth for the foreign-born population - Serbia (%)
Place of birth for the foreign-born population - Ukraine (%)
Place of birth for the foreign-born population - Other Eastern Europe (%)
Place of birth for the foreign-born population - China (%)
Place of birth for the foreign-born population - Hong Kong (%)
Place of birth for the foreign-born population - Taiwan (%)
Place of birth for the foreign-born population - Japan (%)
Place of birth for the foreign-born population - Korea (%)
Place of birth for the foreign-born population - Other Eastern Asia (%)
Place of birth for the foreign-born population - Afghanistan (%)
Place of birth for the foreign-born population - Bangladesh (%)
Place of birth for the foreign-born population - India (%)
Place of birth for the foreign-born population - Iran (%)
Place of birth for the foreign-born population - Kazakhstan (%)
Place of birth for the foreign-born population - Nepal (%)
Place of birth for the foreign-born population - Pakistan (%)
Place of birth for the foreign-born population - Sri Lanka (%)
Place of birth for the foreign-born population - Uzbekistan (%)
Place of birth for the foreign-born population - Other South Central Asia (%)
Place of birth for the foreign-born population - Burma (%)
Place of birth for the foreign-born population - Cambodia (%)
Place of birth for the foreign-born population - Indonesia (%)
Place of birth for the foreign-born population - Laos (%)
Place of birth for the foreign-born population - Malaysia (%)
Place of birth for the foreign-born population - Philippines (%)
Place of birth for the foreign-born population - Singapore (%)
Place of birth for the foreign-born population - Thailand (%)
Place of birth for the foreign-born population - Vietnam (%)
Place of birth for the foreign-born population - Other South Eastern Asia (%)
Place of birth for the foreign-born population - Armenia (%)
Place of birth for the foreign-born population - Iraq (%)
Place of birth for the foreign-born population - Israel (%)
Place of birth for the foreign-born population - Jordan (%)
Place of birth for the foreign-born population - Kuwait (%)
Place of birth for the foreign-born population - Lebanon (%)
Place of birth for the foreign-born population - Saudi Arabia (%)
Place of birth for the foreign-born population - Syria (%)
Place of birth for the foreign-born population - Turkey (%)
Place of birth for the foreign-born population - Yemen (%)
Place of birth for the foreign-born population - Other Western Asia (%)
Place of birth for the foreign-born population - Eritrea (%)
Place of birth for the foreign-born population - Ethiopia (%)
Place of birth for the foreign-born population - Kenya (%)
Place of birth for the foreign-born population - Somalia (%)
Place of birth for the foreign-born population - Uganda (%)
Place of birth for the foreign-born population - Zimbabwe (%)
Place of birth for the foreign-born population - Other Eastern Africa (%)
Place of birth for the foreign-born population - Cameroon (%)
Place of birth for the foreign-born population - Congo (%)
Place of birth for the foreign-born population - Democratic Republic of Congo (Zaire) (%)
Place of birth for the foreign-born population - Other Middle Africa (%)
Place of birth for the foreign-born population - Egypt (%)
Place of birth for the foreign-born population - Morocco (%)
Place of birth for the foreign-born population - Sudan (%)
Place of birth for the foreign-born population - Other Northern Africa (%)
Place of birth for the foreign-born population - South Africa (%)
Place of birth for the foreign-born population - Other Southern Africa (%)
Place of birth for the foreign-born population - Cabo Verde (%)
Place of birth for the foreign-born population - Ghana (%)
Place of birth for the foreign-born population - Liberia (%)
Place of birth for the foreign-born population - Nigeria (%)
Place of birth for the foreign-born population - Senegal (%)
Place of birth for the foreign-born population - Sierra Leone (%)
Place of birth for the foreign-born population - Other Western Africa (%)
Place of birth for the foreign-born population - Australia (%)
Place of birth for the foreign-born population - New Zealand (%)
Place of birth for the foreign-born population - Fiji (%)
Place of birth for the foreign-born population - Micronesia (%)
Place of birth for the foreign-born population - Bahamas (%)
Place of birth for the foreign-born population - Barbados (%)
Place of birth for the foreign-born population - Cuba (%)
Place of birth for the foreign-born population - Dominica (%)
Place of birth for the foreign-born population - Dominican Republic (%)
Place of birth for the foreign-born population - Grenada (%)
Place of birth for the foreign-born population - Haiti (%)
Place of birth for the foreign-born population - Jamaica (%)
Place of birth for the foreign-born population - St. Vincent and the Grenadines (%)
Place of birth for the foreign-born population - Trinidad and Tobago (%)
Place of birth for the foreign-born population - West Indies (%)
Place of birth for the foreign-born population - Other Caribbean (%)
Place of birth for the foreign-born population - Belize (%)
Place of birth for the foreign-born population - Costa Rica (%)
Place of birth for the foreign-born population - El Salvador (%)
Place of birth for the foreign-born population - Guatemala (%)
Place of birth for the foreign-born population - Honduras (%)
Place of birth for the foreign-born population - Mexico (%)
Place of birth for the foreign-born population - Nicaragua (%)
Place of birth for the foreign-born population - Panama (%)
Place of birth for the foreign-born population - Other Central America (%)
Place of birth for the foreign-born population - Argentina (%)
Place of birth for the foreign-born population - Bolivia (%)
Place of birth for the foreign-born population - Brazil (%)
Place of birth for the foreign-born population - Chile (%)
Place of birth for the foreign-born population - Colombia (%)
Place of birth for the foreign-born population - Ecuador (%)
Place of birth for the foreign-born population - Guyana (%)
Place of birth for the foreign-born population - Peru (%)
Place of birth for the foreign-born population - Uruguay (%)
Place of birth for the foreign-born population - Venezuela (%)
Place of birth for the foreign-born population - Other South America (%)
Place of birth for the foreign-born population - Canada (%)
Place of birth for the foreign-born population - Other Northern America (%)
Place of birth for the foreign-born population - Other (%)
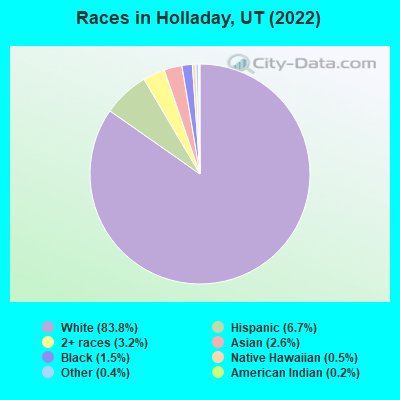
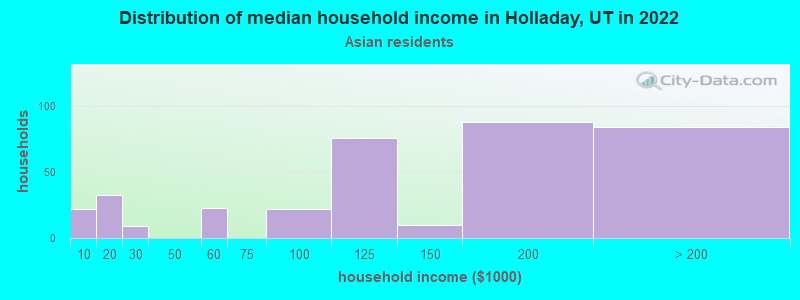
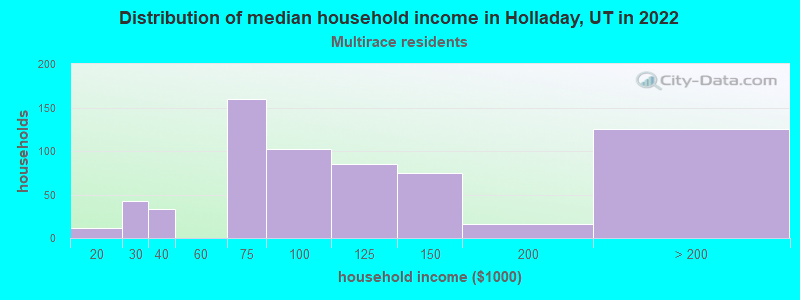
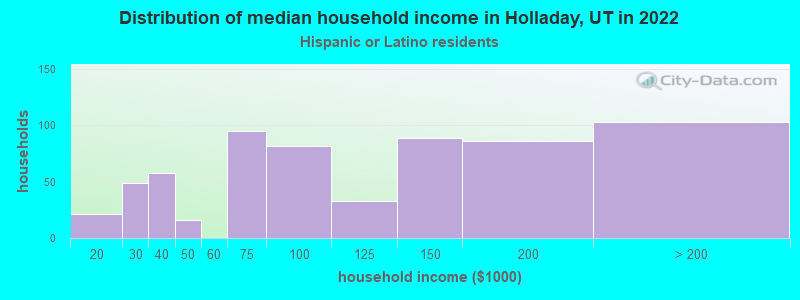
According to 2022 data, the most numerous races in Holladay, UT are White alone (26,590 residents), Hispanic (2,112 residents), and Two or more races (1,003 residents). 90.0% of Holladay residents speak English at home. 6.6% of Holladay, UT residents are foreign-born (2.1% born in Asia, 1.6% born in Latin America, 1.5% born in Europe), which is 20.6% less than the foreign-born rate of 8.0% across the entire state of Utah.
Race distribution in Holladay
2000 2022
1,904,265 85.3% White alone 201,559 9.0% Hispanic 36,483 1.6% Asian alone 31,308 1.4% Two or more races 26,663 1.2% American Indian alone 14,806 0.7% Native Hawaiian and Other 16,137 0.7% Black alone 1,948 0.09% Other race alone
2,557,466 75.6% White alone 512,086 15.1% Hispanic 119,308 3.5% Two or more races 82,388 2.4% Asian alone 36,978 1.1% Native Hawaiian and Other 34,873 1.0% Black alone 22,803 0.7% American Indian alone 14,898 0.4% Other race alone
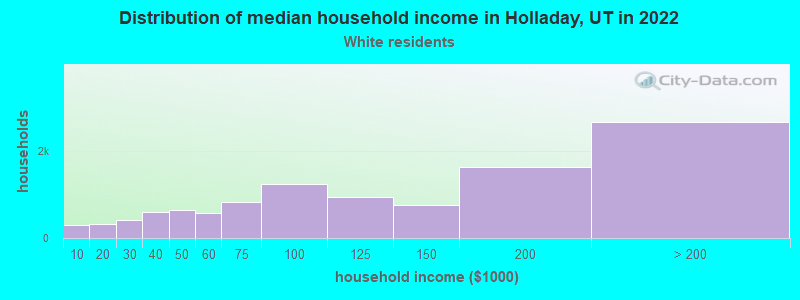
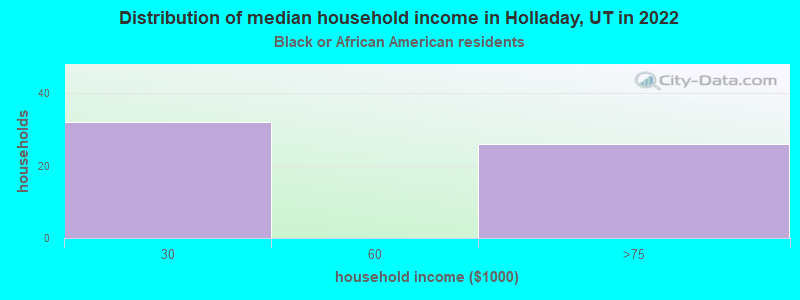
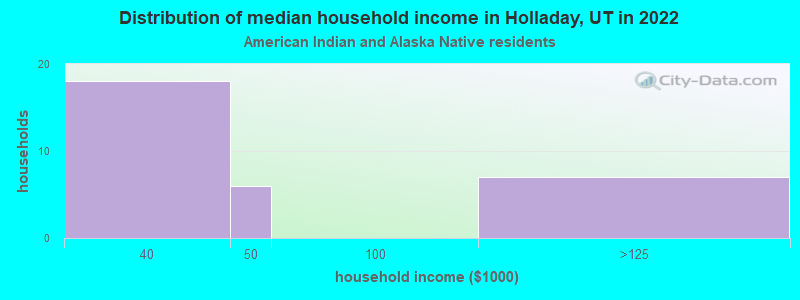
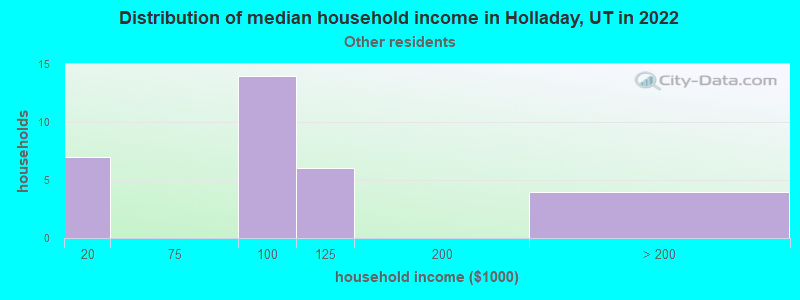
Income and house value in Holladay Median household income in 2022 $109,154 White non-Hispanic householders$42,748 American Indian and Alaska Native householders$128,474 Asian householders$88,347 Some other race householders$89,022 Two or more races householders$88,549 Hispanic or Latino race householdersMedian 2022 house value $812,108 White Non-Hispanic householdersover $1,000,000 Black or African American householders $485,851 Asian householders$331,262 Native Hawaiian and other Pacific Islander householders$552,104 Some other race householders$843,320 Two or more races householders$569,477 Hispanic or Latino householders
Median age by race in Holladay
41.8 Median age for White residents41.5 42.6 19.5 Median age for Black or African American residents13.6 26.8 35.8 Median age for American Indian / Alaska Native residents41.5 -660,587,638.7 40.7 Median age for Asian residents38.9 46.7 48.6 Median age for Native Hawaiian / Pacific Islander residents-633,333,332.7 43.5 24.5 Median age for Other race residents24.4 37.5 22.4 Median age for Two or more races residents29.4 17.6 42.0 Median age for White alone residents41.5 43.0 26.3 Median age for Hispanic or Latino residents24.1 27.2
Owner/renter occupied households by race in Holladay
House owners and renters - White residents 8,755 80.8% Owner occupied2,082 19.2% Renter occupiedHouse owners and renters - Black or African American residents 43 100.0% Renter occupiedHouse owners and renters - American Indian / Alaska Native residents 22 52.0% Owner occupied21 48.0% Renter occupiedHouse owners and renters - Asian residents 221 61.2% Owner occupied140 38.8% Renter occupiedHouse owners and renters - Native Hawaiian / Pacific Islander residents 94 100.0% Renter occupiedHouse owners and renters - Other race residents 23 65.1% Owner occupied12 34.9% Renter occupiedHouse owners and renters - Two or more races residents 368 60.0% Owner occupied245 40.0% Renter occupiedHouse owners and renters - White alone residents 8,672 80.9% Owner occupied2,048 19.1% Renter occupiedHouse owners and renters - Hispanic or Latino residents 377 60.9% Owner occupied242 39.1% Renter occupied
Language usage in Holladay
English speakers - Total 90.0% of residents of Holladay speak English at home.
3.5% of residents speak Spanish at home 699 67.4% Speak English very well338 32.6% Speak English less than very well6.1% of residents speak other language at home 1,410 77.4% Speak English very well412 22.6% Speak English less than very well
English speakers - Born in the United States 95.3% of residents of Holladay speak English at home.
2.8% of residents speak Spanish at home 259 94.2% Speak English very well16 5.8% Speak English less than very well1.5% of residents speak other language at home 133 94.3% Speak English very well8 5.7% Speak English less than very well
English speakers - Native, born elsewhere 72.2% of residents of Holladay speak English at home.
25.1% of residents speak other language at home 81 96.4% Speak English very well3 3.6% Speak English less than very well
English speakers - Foreign-born 29.5% of residents of Holladay speak English at home.
22.2% of residents speak Spanish at home 184 39.9% Speak English very well277 60.1% Speak English less than very well48.2% of residents speak other language at home 697 69.6% Speak English very well305 30.4% Speak English less than very well
White (Caucasian) - Speak only English Native:
97.2% (23,867)Foreign-born:
49.0% (349)
White (Caucasian) - Speak another language Native:
3.0% (748)Foreign-born:
54.6% (389)
Black or African American - Speak only English Native:
73.2% (297)Foreign-born:
34.6% (19)
Black or African American - Speak another language Native:
22.5% (91)Foreign-born:
68.2% (38)
American Indian / Alaska Native - Speak only English Native:
81.3% (66)Foreign-born:
100.0% (9)
Asian - Speak only English Native:
60.1% (182)Foreign-born:
20.9% (111)
Asian - Speak another language Native:
37.9% (115)Foreign-born:
79.9% (425)
Native Hawaiian / Pacific Islander - Speak only English Native:
87.0% (89)Foreign-born:
69.2% (39)
Other race - Speak another language Native:
6.8% (11)Foreign-born:
96.1% (200)
Two or more races - Speak only English Native:
85.5% (1,652)Foreign-born:
4.6% (16)
Two or more races - Speak another language Native:
14.4% (279)Foreign-born:
98.5% (335)
White alone - Speak only English Native:
96.6% (23,525)Foreign-born:
42.5% (372)
White alone - Speak another language Native:
3.4% (834)Foreign-born:
57.0% (500)
Hispanic or Latino - Speak only English Native:
86.9% (1,315)Foreign-born:
0.9% (4)
Hispanic or Latino - Speak another language Native:
15.5% (235)Foreign-born:
97.5% (457)
Foreign-born residents in Holladay 2,103 residents are foreign born (2.1% Asia , 1.6% Latin America , 1.5% Europe ).
Marital status for residents in Holladay Marital status - White (Caucasian) population 15 years and over
Males 29.4% Never married57.0% Now married0.4% Separated1.7% Widowed11.5% DivorcedFemales 24.1% Never married52.8% Now married0.9% Separated7.1% Widowed15.1% DivorcedWomen who gave birth in the past 12 months Now married:
85.8% (241)Unmarried:
14.2% (40)
Women who did not give birth in the past 12 months Now married:
43.8% (2,512)Unmarried:
56.2% (3,223)
Marital status - Black or African American population 15 years and over
Males 83.0% Never married17.0% Now married0.0% Separated0.0% Widowed0.0% DivorcedFemales 73.4% Never married13.3% Now married5.8% Separated0.0% Widowed7.5% DivorcedWomen who did not give birth in the past 12 months Now married:
7.3% (13)Unmarried:
92.7% (168)
Marital status - American Indian / Alaska Native population 15 years and over
Males 36.0% Never married28.0% Now married0.0% Separated0.0% Widowed36.0% DivorcedFemales 76.9% Never married23.1% Now married0.0% Separated0.0% Widowed0.0% DivorcedWomen who did not give birth in the past 12 months Now married:
0.0% (0)Unmarried:
100.0% (27)
Marital status - Asian population 15 years and over
Males 38.7% Never married57.3% Now married0.0% Separated0.0% Widowed3.9% DivorcedFemales 6.7% Never married71.0% Now married0.0% Separated11.0% Widowed11.3% DivorcedWomen who gave birth in the past 12 months Now married:
100.0% (23)Unmarried:
0.0% (0)
Women who did not give birth in the past 12 months Now married:
74.5% (106)Unmarried:
25.5% (36)
Marital status - Native Hawaiian / Pacific Islander population 15 years and over
Males 0.0% Never married100.0% Now married0.0% Separated0.0% Widowed0.0% DivorcedFemales 48.8% Never married51.2% Now married0.0% Separated0.0% Widowed0.0% DivorcedWomen who gave birth in the past 12 months Now married:
100.0% (30)Unmarried:
0.0% (0)
Women who did not give birth in the past 12 months Now married:
29.3% (20)Unmarried:
70.7% (47)
Marital status - Other race population 15 years and over
Males 69.0% Never married31.0% Now married0.0% Separated0.0% Widowed0.0% DivorcedFemales 56.7% Never married35.5% Now married0.0% Separated0.0% Widowed7.8% DivorcedWomen who did not give birth in the past 12 months Now married:
15.7% (17)Unmarried:
84.3% (93)
Marital status - Two or more races population 15 years and over
Males 35.5% Never married51.8% Now married0.0% Separated0.0% Widowed12.7% DivorcedFemales 34.9% Never married48.6% Now married0.0% Separated1.4% Widowed15.1% DivorcedWomen who gave birth in the past 12 months Now married:
100.0% (20)Unmarried:
0.0% (0)
Women who did not give birth in the past 12 months Now married:
37.7% (175)Unmarried:
62.3% (289)
Marital status - White alone, not Hispanic / Latino population 15 years and over
Males 28.8% Never married57.3% Now married0.4% Separated1.8% Widowed11.6% DivorcedFemales 23.2% Never married53.4% Now married1.0% Separated7.1% Widowed15.3% DivorcedWomen who gave birth in the past 12 months Now married:
85.8% (246)Unmarried:
14.2% (41)
Women who did not give birth in the past 12 months Now married:
44.9% (2,528)Unmarried:
55.1% (3,097)
Marital status - Hispanic or Latino population 15 years and over
Males 48.1% Never married47.8% Now married0.0% Separated0.0% Widowed4.1% DivorcedFemales 42.3% Never married41.9% Now married0.0% Separated4.0% Widowed11.8% DivorcedWomen who did not give birth in the past 12 months Now married:
26.3% (138)Unmarried:
73.7% (384)
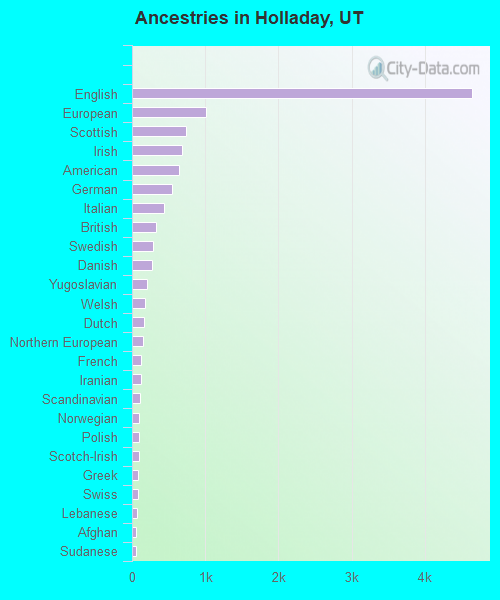
Ancestries in Holladay
4,645 32.4% English1,009 7.0% European738 5.1% Scottish683 4.8% Irish639 4.5% American541 3.8% German438 3.1% Italian328 2.3% British282 2.0% Swedish274 1.9% Danish205 1.4% Yugoslavian183 1.3% Welsh162 1.1% Dutch151 1.1% Northern European128 0.9% French117 0.8% Iranian114 0.8% Scandinavian100 0.7% Norwegian94 0.7% Polish89 0.6% Scotch-Irish87 0.6% Greek83 0.6% Swiss62 0.4% Lebanese61 0.4% Afghan56 0.4% Sudanese54 0.4% African45 0.3% Basque36 0.3% West Indian33 0.2% Cajun30 0.2% Russian24 0.2% Slovak23 0.2% Eastern European19 0.1% Palestinian17 0.1% Austrian16 0.1% Czech12 0.08% Ghanaian12 0.08% Ukrainian10 0.07% Brazilian10 0.07% French Canadian6 0.04% South African6 0.04% Canadian5 0.03% Hungarian
Geographical mobility in Holladay Same house 1 year ago 23,369 89.1% White (Caucasian)537 100.0% Black or African American46 58.0% American Indian / Alaska Native758 92.1% Asian94 61.4% Native Hawaiian / Pacific Islander232 62.0% Other race2,160 88.6% Two or more races23,547 89.5% White alone, not Hispanic / Latino1,725 82.1% Hispanic or LatinoMoved within same county 1,711 6.5% White / Caucasian17 3.2% Black or African American25 31.5% American Indian / Alaska Native6 0.7% Asian80 52.4% Native Hawaiian / Pacific Islander190 7.8% Two or more races1,651 6.3% White alone, not Hispanic / Latino170 8.1% Hispanic or LatinoMoved within same state 372 1.4% White / Caucasian29 3.5% Asian39 10.4% Other race31 1.3% Two or more races332 1.3% White alone, not Hispanic / Latino88 4.2% Hispanic or LatinoMoved from different state 721 2.7% White / Caucasian14 2.5% Black or African American23 2.8% Asian107 28.7% Other race34 1.4% Two or more races737 2.8% White alone, not Hispanic / Latino101 4.8% Hispanic or LatinoMoved from abroad 71 0.3% White30 3.7% Asian76 0.3% White alone, not Hispanic / Latino2 0.1% Hispanic or Latino
Children Nativity (place of birth) in Holladay
Children under 6 years - Living with two parents Both parents native 1,486 100.0% NativeBoth parents foreign-born 6 100.0% NativeOne native, one foreign-born parent 62 100.0% NativeChildren under 6 years - Living with one parent Native parent 497 100.0% NativeChildren 6 to 17 years - Living with two parents Both parents native 3,893 99.8% Native10 0.2% Foreign-bornBoth parents foreign-born 161 70.2% Native68 29.8% Foreign-bornOne native, one foreign-born parent 152 100.0% NativeChildren 6 to 17 years - Living with one parent Native parent 1,062 100.0% NativeForeign-born parent 29 51.5% Native28 48.5% Foreign-born
Grandparents responsible for own grandchildren in Holladay
Grandparents (30 to 59 years) White / Caucasian 24 32.7% Responsible for grandchildren49 67.3% Not responsible for grandchildrenWhite alone, not Hispanic / Latino 29 35.2% Responsible for grandchildren53 64.8% Not responsible for grandchildrenGrandparents (60 years and over) White / Caucasian 80 29.2% Responsible for grandchildren194 70.8% Not responsible for grandchildrenWhite alone, not Hispanic / Latino 80 28.1% Responsible for grandchildren206 71.9% Not responsible for grandchildren