Races in Hobe Sound, Florida (FL) Detailed Stats
Data:
Races - White alone (%)
Races - White alone (% change since 2000)
Races - Black alone (%)
Races - Black alone (% change since 2000)
Races - American Indian alone (%)
Races - American Indian alone (% change since 2000)
Races - Asian alone (%)
Races - Asian alone (% change since 2000)
Races - Hispanic (%)
Races - Hispanic (% change since 2000)
Races - Native Hawaiian and Other Pacific Islander alone (%)
Races - Native Hawaiian and Other Pacific Islander alone (% change since 2000)
Races - Two or more races(%)
Races - Two or more races(% change since 2000)
Races - Other race alone (%)
Races - Other race alone (% change since 2000)
Racial diversity
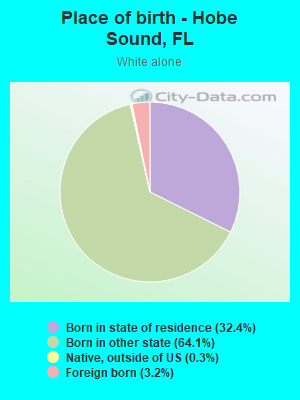
Place of birth - Born in state of residence (%)
Place of birth - Born in state of residence (%) - White
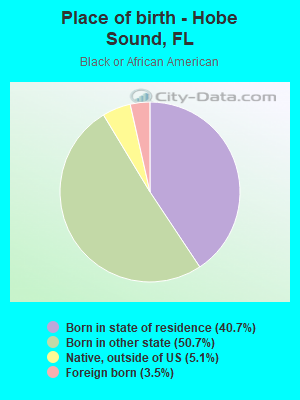
Place of birth - Born in state of residence (%) - Black or African American
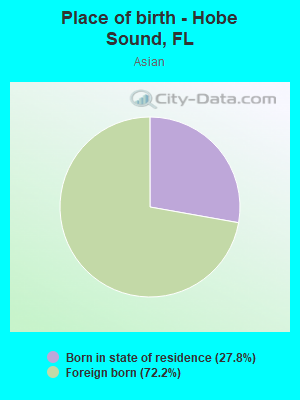
Place of birth - Born in state of residence (%) - Asian
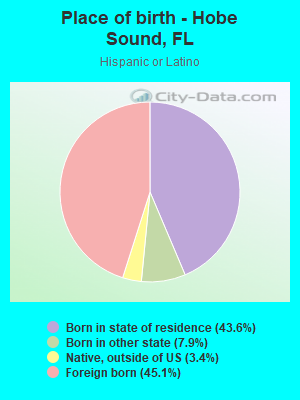
Place of birth - Born in state of residence (%) - Hispanic or Latino
Place of birth - Born in state of residence (%) - American Indian and Alaska Native
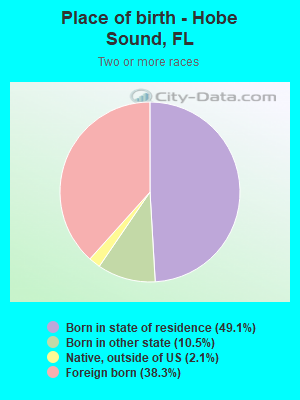
Place of birth - Born in state of residence (%) - Multirace
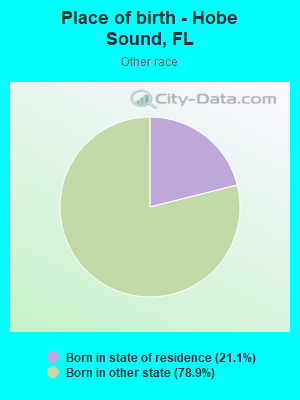
Place of birth - Born in state of residence (%) - Other Race
Place of birth - Born in other state (%)
Place of birth - Born in other state (%) - White
Place of birth - Born in other state (%) - Black or African American
Place of birth - Born in other state (%) - Asian
Place of birth - Born in other state (%) - Hispanic or Latino
Place of birth - Born in other state (%) - American Indian and Alaska Native
Place of birth - Born in other state (%) - Multirace
Place of birth - Born in other state (%) - Other Race
Place of birth - Native, outside of US (%)
Place of birth - Native, outside of US (%) - White
Place of birth - Native, outside of US (%) - Black or African American
Place of birth - Native, outside of US (%) - Asian
Place of birth - Native, outside of US (%) - Hispanic or Latino
Place of birth - Native, outside of US (%) - American Indian and Alaska Native
Place of birth - Native, outside of US (%) - Multirace
Place of birth - Native, outside of US (%) - Other Race
Place of birth - Foreign born (%)
Place of birth - Foreign born (%) - White
Place of birth - Foreign born (%) - Black or African American
Place of birth - Foreign born (%) - Asian
Place of birth - Foreign born (%) - Hispanic or Latino
Place of birth - Foreign born (%) - American Indian and Alaska Native
Place of birth - Foreign born (%) - Multirace
Place of birth - Foreign born (%) - Other Race
Residents speaking English at home (%)
Residents speaking English at home - Born in the United States (%)
Residents speaking English at home - Native, born elsewhere (%)
Residents speaking English at home - Foreign born (%)
Residents speaking Spanish at home (%)
Residents speaking Spanish at home - Born in the United States (%)
Residents speaking Spanish at home - Native, born elsewhere (%)
Residents speaking Spanish at home - Foreign born (%)
Residents speaking other language at home (%)
Residents speaking other language at home - Born in the United States (%)
Residents speaking other language at home - Native, born elsewhere (%)
Residents speaking other language at home - Foreign born (%)
Marital status - Never married (%)
Marital status - Now married (%)
Marital status - Separated (%)
Marital status - Widowed (%)
Marital status - Divorced (%)
Ancestries Reported - Arab (%)
Ancestries Reported - Czech (%)
Ancestries Reported - Danish (%)
Ancestries Reported - Dutch (%)
Ancestries Reported - English (%)
Ancestries Reported - French (%)
Ancestries Reported - French Canadian (%)
Ancestries Reported - German (%)
Ancestries Reported - Greek (%)
Ancestries Reported - Hungarian (%)
Ancestries Reported - Irish (%)
Ancestries Reported - Italian (%)
Ancestries Reported - Lithuanian (%)
Ancestries Reported - Norwegian (%)
Ancestries Reported - Polish (%)
Ancestries Reported - Portuguese (%)
Ancestries Reported - Russian (%)
Ancestries Reported - Scotch-Irish (%)
Ancestries Reported - Scottish (%)
Ancestries Reported - Slovak (%)
Ancestries Reported - Subsaharan African (%)
Ancestries Reported - Swedish (%)
Ancestries Reported - Swiss (%)
Ancestries Reported - Ukrainian (%)
Ancestries Reported - United States (%)
Ancestries Reported - Welsh (%)
Ancestries Reported - West Indian (%)
Ancestries Reported - Other (%)
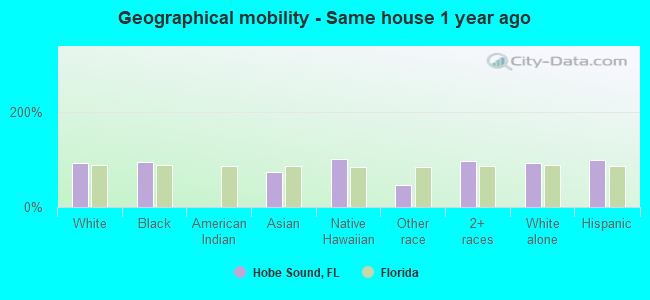
Geographical mobility - Same house 1 year ago (%)
Geographical mobility - Same house 1 year ago (%) - White
Geographical mobility - Same house 1 year ago (%) - Black or African American
Geographical mobility - Same house 1 year ago (%) - Asian
Geographical mobility - Same house 1 year ago (%) - Hispanic or Latino
Geographical mobility - Same house 1 year ago (%) - American Indian and Alaska Native
Geographical mobility - Same house 1 year ago (%) - Multirace
Geographical mobility - Same house 1 year ago (%) - Other Race
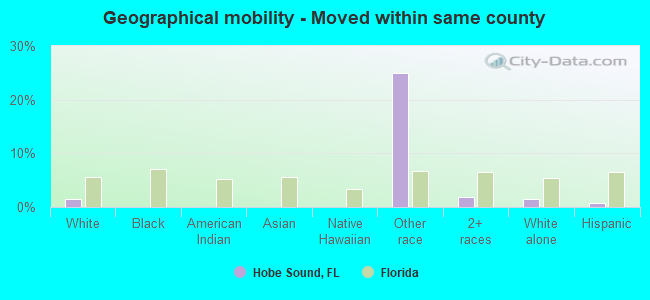
Geographical mobility - Moved within same county (%)
Geographical mobility - Moved within same county (%) - White
Geographical mobility - Moved within same county (%) - Black or African American
Geographical mobility - Moved within same county (%) - Asian
Geographical mobility - Moved within same county (%) - Hispanic or Latino
Geographical mobility - Moved within same county (%) - American Indian and Alaska Native
Geographical mobility - Moved within same county (%) - Multirace
Geographical mobility - Moved within same county (%) - Other Race
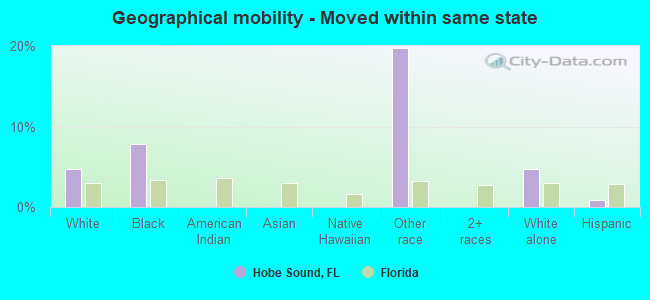
Geographical mobility - Moved from different county within same state (%)
Geographical mobility - Moved from different county within same state (%) - White
Geographical mobility - Moved from different county within same state (%) - Black or African American
Geographical mobility - Moved from different county within same state (%) - Asian
Geographical mobility - Moved from different county within same state (%) - Hispanic or Latino
Geographical mobility - Moved from different county within same state (%) - American Indian and Alaska Native
Geographical mobility - Moved from different county within same state (%) - Multirace
Geographical mobility - Moved from different county within same state (%) - Other Race
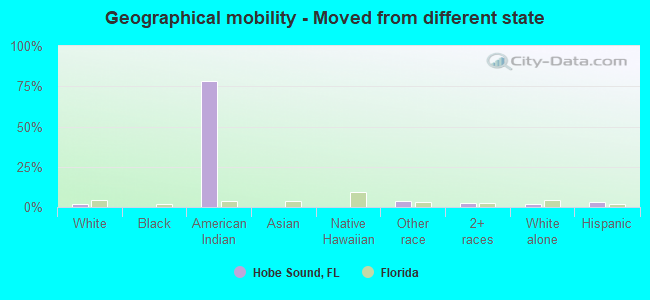
Geographical mobility - Moved from different state (%)
Geographical mobility - Moved from different state (%) - White
Geographical mobility - Moved from different state (%) - Black or African American
Geographical mobility - Moved from different state (%) - Asian
Geographical mobility - Moved from different state (%) - Hispanic or Latino
Geographical mobility - Moved from different state (%) - American Indian and Alaska Native
Geographical mobility - Moved from different state (%) - Multirace
Geographical mobility - Moved from different state (%) - Other Race
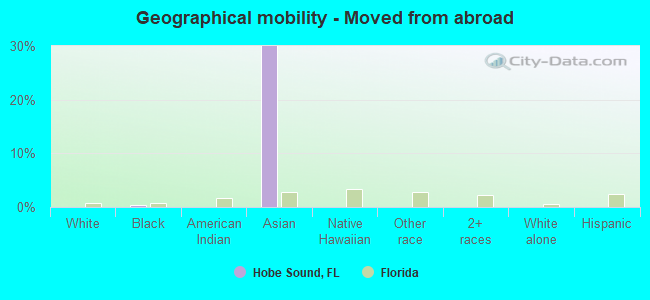
Geographical mobility - Moved from abroad (%)
Geographical mobility - Moved from abroad (%) - White
Geographical mobility - Moved from abroad (%) - Black or African American
Geographical mobility - Moved from abroad (%) - Asian
Geographical mobility - Moved from abroad (%) - Hispanic or Latino
Geographical mobility - Moved from abroad (%) - American Indian and Alaska Native
Geographical mobility - Moved from abroad (%) - Multirace
Geographical mobility - Moved from abroad (%) - Other Race
Place of birth for the foreign-born population - Ireland (%)
Place of birth for the foreign-born population - Denmark (%)
Place of birth for the foreign-born population - Norway (%)
Place of birth for the foreign-born population - Sweden (%)
Place of birth for the foreign-born population - United Kingdom (%)
Place of birth for the foreign-born population - England (%)
Place of birth for the foreign-born population - Scotland (%)
Place of birth for the foreign-born population - Other Northern Europe (%)
Place of birth for the foreign-born population - Austria (%)
Place of birth for the foreign-born population - Belgium (%)
Place of birth for the foreign-born population - France (%)
Place of birth for the foreign-born population - Germany (%)
Place of birth for the foreign-born population - Netherlands (%)
Place of birth for the foreign-born population - Switzerland (%)
Place of birth for the foreign-born population - Other Western Europe (%)
Place of birth for the foreign-born population - Greece (%)
Place of birth for the foreign-born population - Italy (%)
Place of birth for the foreign-born population - Portugal (%)
Place of birth for the foreign-born population - Spain (%)
Place of birth for the foreign-born population - Other Southern Europe (%)
Place of birth for the foreign-born population - Albania (%)
Place of birth for the foreign-born population - Belarus (%)
Place of birth for the foreign-born population - Bosnia and Herzegovina (%)
Place of birth for the foreign-born population - Bulgaria (%)
Place of birth for the foreign-born population - Croatia (%)
Place of birth for the foreign-born population - Czechoslovakia (%)
Place of birth for the foreign-born population - Hungary (%)
Place of birth for the foreign-born population - Latvia (%)
Place of birth for the foreign-born population - Lithuania (%)
Place of birth for the foreign-born population - North Macedonia (Macedonia) (%)
Place of birth for the foreign-born population - Moldova (%)
Place of birth for the foreign-born population - Poland (%)
Place of birth for the foreign-born population - Romania (%)
Place of birth for the foreign-born population - Russia (%)
Place of birth for the foreign-born population - Serbia (%)
Place of birth for the foreign-born population - Ukraine (%)
Place of birth for the foreign-born population - Other Eastern Europe (%)
Place of birth for the foreign-born population - China (%)
Place of birth for the foreign-born population - Hong Kong (%)
Place of birth for the foreign-born population - Taiwan (%)
Place of birth for the foreign-born population - Japan (%)
Place of birth for the foreign-born population - Korea (%)
Place of birth for the foreign-born population - Other Eastern Asia (%)
Place of birth for the foreign-born population - Afghanistan (%)
Place of birth for the foreign-born population - Bangladesh (%)
Place of birth for the foreign-born population - India (%)
Place of birth for the foreign-born population - Iran (%)
Place of birth for the foreign-born population - Kazakhstan (%)
Place of birth for the foreign-born population - Nepal (%)
Place of birth for the foreign-born population - Pakistan (%)
Place of birth for the foreign-born population - Sri Lanka (%)
Place of birth for the foreign-born population - Uzbekistan (%)
Place of birth for the foreign-born population - Other South Central Asia (%)
Place of birth for the foreign-born population - Burma (%)
Place of birth for the foreign-born population - Cambodia (%)
Place of birth for the foreign-born population - Indonesia (%)
Place of birth for the foreign-born population - Laos (%)
Place of birth for the foreign-born population - Malaysia (%)
Place of birth for the foreign-born population - Philippines (%)
Place of birth for the foreign-born population - Singapore (%)
Place of birth for the foreign-born population - Thailand (%)
Place of birth for the foreign-born population - Vietnam (%)
Place of birth for the foreign-born population - Other South Eastern Asia (%)
Place of birth for the foreign-born population - Armenia (%)
Place of birth for the foreign-born population - Iraq (%)
Place of birth for the foreign-born population - Israel (%)
Place of birth for the foreign-born population - Jordan (%)
Place of birth for the foreign-born population - Kuwait (%)
Place of birth for the foreign-born population - Lebanon (%)
Place of birth for the foreign-born population - Saudi Arabia (%)
Place of birth for the foreign-born population - Syria (%)
Place of birth for the foreign-born population - Turkey (%)
Place of birth for the foreign-born population - Yemen (%)
Place of birth for the foreign-born population - Other Western Asia (%)
Place of birth for the foreign-born population - Eritrea (%)
Place of birth for the foreign-born population - Ethiopia (%)
Place of birth for the foreign-born population - Kenya (%)
Place of birth for the foreign-born population - Somalia (%)
Place of birth for the foreign-born population - Uganda (%)
Place of birth for the foreign-born population - Zimbabwe (%)
Place of birth for the foreign-born population - Other Eastern Africa (%)
Place of birth for the foreign-born population - Cameroon (%)
Place of birth for the foreign-born population - Congo (%)
Place of birth for the foreign-born population - Democratic Republic of Congo (Zaire) (%)
Place of birth for the foreign-born population - Other Middle Africa (%)
Place of birth for the foreign-born population - Egypt (%)
Place of birth for the foreign-born population - Morocco (%)
Place of birth for the foreign-born population - Sudan (%)
Place of birth for the foreign-born population - Other Northern Africa (%)
Place of birth for the foreign-born population - South Africa (%)
Place of birth for the foreign-born population - Other Southern Africa (%)
Place of birth for the foreign-born population - Cabo Verde (%)
Place of birth for the foreign-born population - Ghana (%)
Place of birth for the foreign-born population - Liberia (%)
Place of birth for the foreign-born population - Nigeria (%)
Place of birth for the foreign-born population - Senegal (%)
Place of birth for the foreign-born population - Sierra Leone (%)
Place of birth for the foreign-born population - Other Western Africa (%)
Place of birth for the foreign-born population - Australia (%)
Place of birth for the foreign-born population - New Zealand (%)
Place of birth for the foreign-born population - Fiji (%)
Place of birth for the foreign-born population - Micronesia (%)
Place of birth for the foreign-born population - Bahamas (%)
Place of birth for the foreign-born population - Barbados (%)
Place of birth for the foreign-born population - Cuba (%)
Place of birth for the foreign-born population - Dominica (%)
Place of birth for the foreign-born population - Dominican Republic (%)
Place of birth for the foreign-born population - Grenada (%)
Place of birth for the foreign-born population - Haiti (%)
Place of birth for the foreign-born population - Jamaica (%)
Place of birth for the foreign-born population - St. Vincent and the Grenadines (%)
Place of birth for the foreign-born population - Trinidad and Tobago (%)
Place of birth for the foreign-born population - West Indies (%)
Place of birth for the foreign-born population - Other Caribbean (%)
Place of birth for the foreign-born population - Belize (%)
Place of birth for the foreign-born population - Costa Rica (%)
Place of birth for the foreign-born population - El Salvador (%)
Place of birth for the foreign-born population - Guatemala (%)
Place of birth for the foreign-born population - Honduras (%)
Place of birth for the foreign-born population - Mexico (%)
Place of birth for the foreign-born population - Nicaragua (%)
Place of birth for the foreign-born population - Panama (%)
Place of birth for the foreign-born population - Other Central America (%)
Place of birth for the foreign-born population - Argentina (%)
Place of birth for the foreign-born population - Bolivia (%)
Place of birth for the foreign-born population - Brazil (%)
Place of birth for the foreign-born population - Chile (%)
Place of birth for the foreign-born population - Colombia (%)
Place of birth for the foreign-born population - Ecuador (%)
Place of birth for the foreign-born population - Guyana (%)
Place of birth for the foreign-born population - Peru (%)
Place of birth for the foreign-born population - Uruguay (%)
Place of birth for the foreign-born population - Venezuela (%)
Place of birth for the foreign-born population - Other South America (%)
Place of birth for the foreign-born population - Canada (%)
Place of birth for the foreign-born population - Other Northern America (%)
Place of birth for the foreign-born population - Other (%)
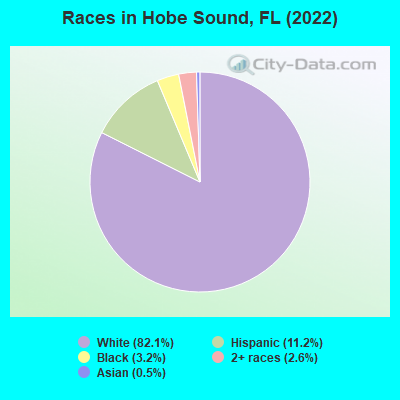
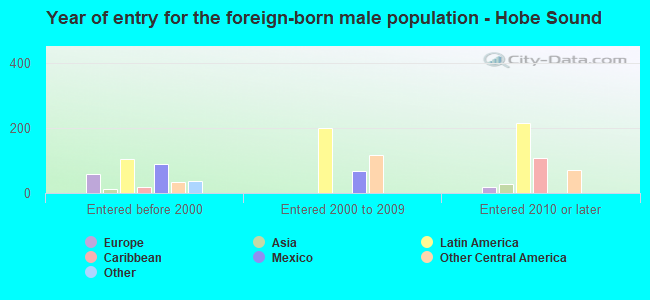
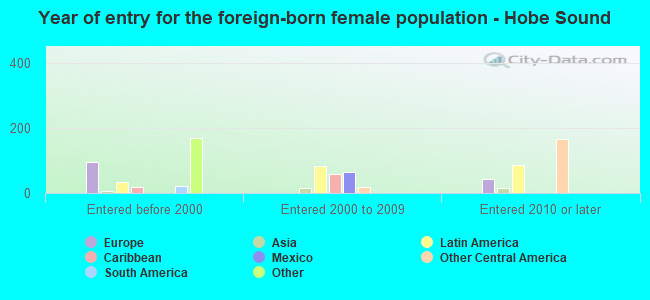
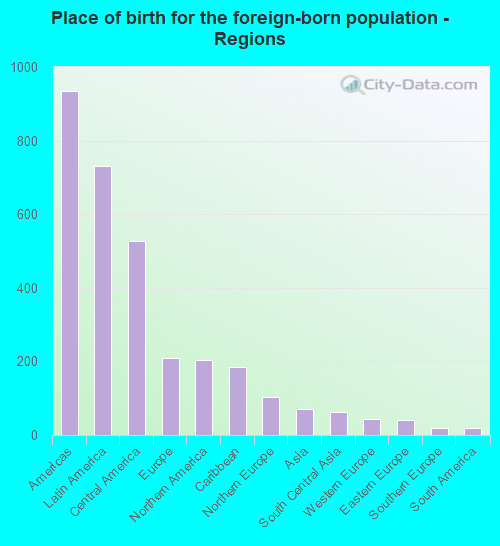
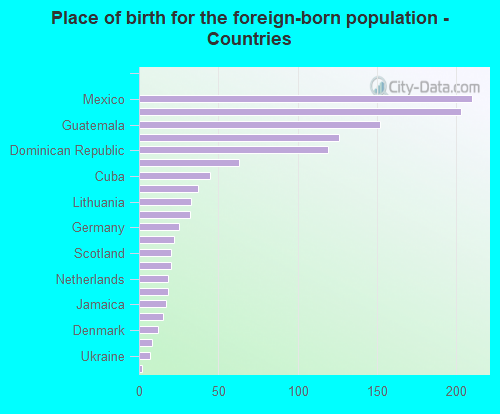
According to 2022 data, the most numerous races in Hobe Sound, FL are White alone (11,839 residents), Hispanic (1,610 residents), and Black alone (461 residents). 89.9% of Hobe Sound residents speak English at home. 8.4% of Hobe Sound, FL residents are foreign-born (4.9% born in Latin America, 1.4% born in Europe, 1.4% born in North America), which is 149.0% less than the foreign-born rate of 21.0% across the entire state of Florida.
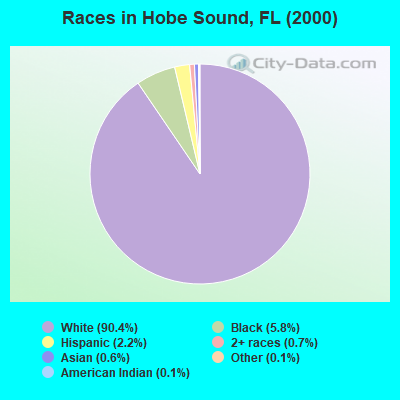
Race distribution in Hobe Sound
2000 2022
10,458,509 65.4% White alone 2,682,715 16.8% Hispanic 2,264,268 14.2% Black alone 261,693 1.6% Asian alone 236,954 1.5% Two or more races 42,358 0.3% American Indian alone 28,994 0.2% Other race alone 6,887 0.04% Native Hawaiian and Other
11,309,403 50.8% White alone 6,025,039 27.1% Hispanic 3,241,015 14.6% Black alone 861,630 3.9% Two or more races 623,692 2.8% Asian alone 152,054 0.7% Other race alone 22,504 0.1% American Indian alone 9,486 0.04% Native Hawaiian and Other
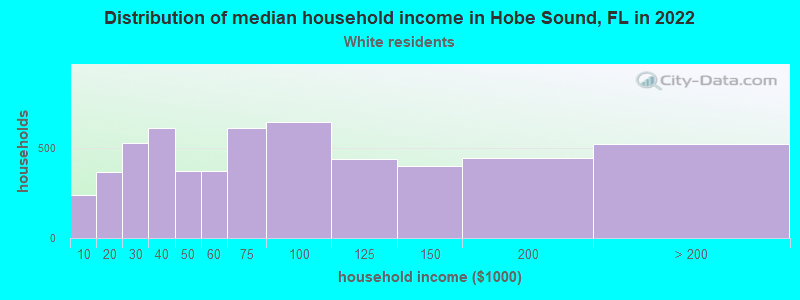
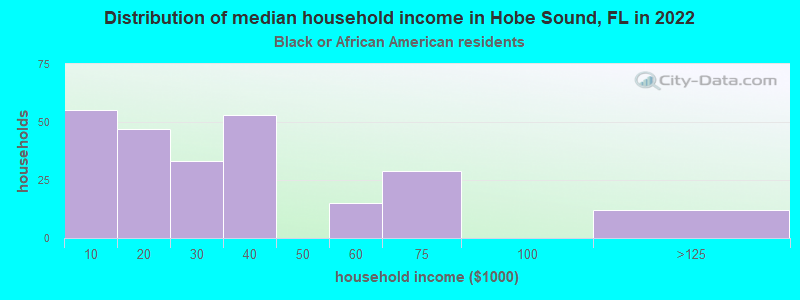
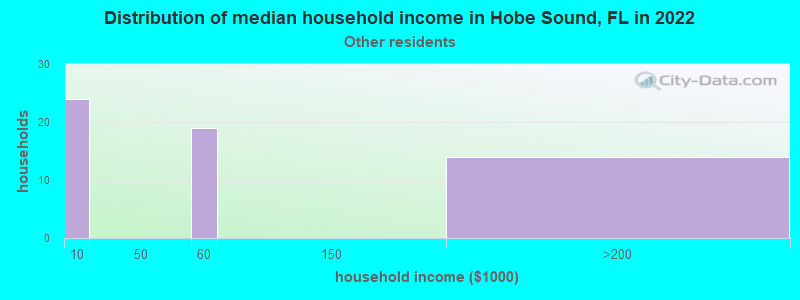
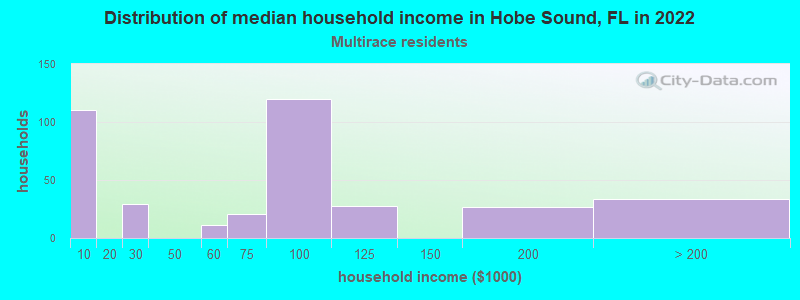
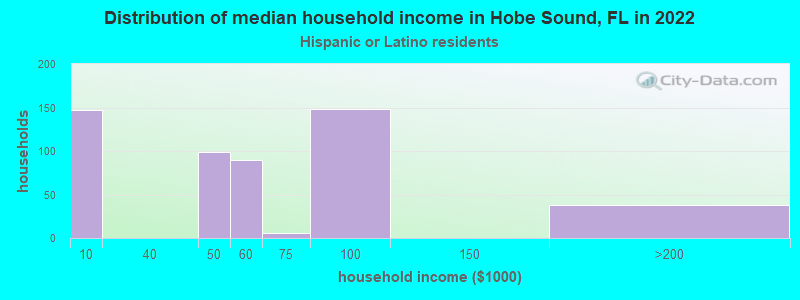
Income and house value in Hobe Sound Median household income in 2022 $65,743 White non-Hispanic householders$79,091 Two or more races householders$58,580 Hispanic or Latino race householdersMedian 2022 house value $637,477 White Non-Hispanic householders$266,081 Black or African American householders$507,660 Two or more races householders$507,230 Hispanic or Latino householders
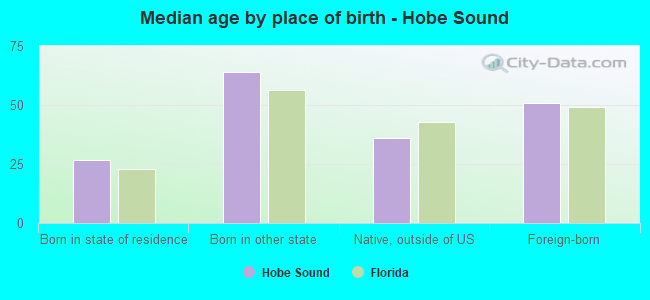
Median age by race in Hobe Sound
58.9 Median age for White residents58.3 59.9 71.1 Median age for Black or African American residents51.3 84.5 -700,813,007.4 Median age for American Indian / Alaska Native residents-465,564,737.8 -924,867,723.9 47.6 Median age for Asian residents80.9 44.3 -666,666,666.0 Median age for Native Hawaiian / Pacific Islander residents-666,666,666.0 -666,666,666.0 36.1 Median age for Other race residents28.3 35.4 18.4 Median age for Two or more races residents13.7 39.9 59.4 Median age for White alone residents58.7 60.3 22.9 Median age for Hispanic or Latino residents26.7 23.6
Owner/renter occupied households by race in Hobe Sound
House owners and renters - White residents 4,684 83.2% Owner occupied948 16.8% Renter occupiedHouse owners and renters - Black or African American residents 141 54.7% Owner occupied117 45.3% Renter occupiedHouse owners and renters - Asian residents 5 100.0% Owner occupiedHouse owners and renters - Other race residents 12 24.6% Owner occupied37 75.4% Renter occupiedHouse owners and renters - Two or more races residents 99 26.8% Owner occupied270 73.2% Renter occupiedHouse owners and renters - White alone residents 4,626 83.7% Owner occupied900 16.3% Renter occupiedHouse owners and renters - Hispanic or Latino residents 153 37.6% Owner occupied254 62.4% Renter occupied
Language usage in Hobe Sound
English speakers - Total 89.9% of residents of Hobe Sound speak English at home.
8.3% of residents speak Spanish at home 710 62.7% Speak English very well423 37.3% Speak English less than very well2.4% of residents speak other language at home 173 53.1% Speak English very well153 46.9% Speak English less than very well
English speakers - Born in the United States 99.1% of residents of Hobe Sound speak English at home.
0.7% of residents speak Spanish at home 54 100.0% Speak English very well0.6% of residents speak other language at home 46 100.0% Speak English very well
English speakers - Native, born elsewhere 54.6% of residents of Hobe Sound speak English at home.
39.7% of residents speak Spanish at home 39 69.6% Speak English very well17 30.4% Speak English less than very well
English speakers - Foreign-born 21.3% of residents of Hobe Sound speak English at home.
59.4% of residents speak Spanish at home 260 38.3% Speak English very well418 61.7% Speak English less than very well22.6% of residents speak other language at home 105 40.7% Speak English very well153 59.3% Speak English less than very well
White (Caucasian) - Speak only English Native:
98.1% (10,861)Foreign-born:
45.3% (208)
White (Caucasian) - Speak another language Native:
2.3% (255)Foreign-born:
48.4% (223)
Black or African American - Speak only English Native:
99.8% (565)Foreign-born:
97.0% (19)
Asian - Speak another language Native:
97.5% (22)Foreign-born:
100.0% (63)
Two or more races - Speak only English Native:
58.5% (428)Foreign-born:
3.5% (23)
Two or more races - Speak another language Native:
42.0% (307)Foreign-born:
100.0% (646)
White alone - Speak only English Native:
99.0% (10,834)Foreign-born:
57.3% (218)
White alone - Speak another language Native:
1.2% (128)Foreign-born:
42.2% (161)
Hispanic or Latino - Speak only English Native:
42.3% (266)Foreign-born:
1.4% (10)
Hispanic or Latino - Speak another language Native:
57.2% (359)Foreign-born:
100.0% (714)
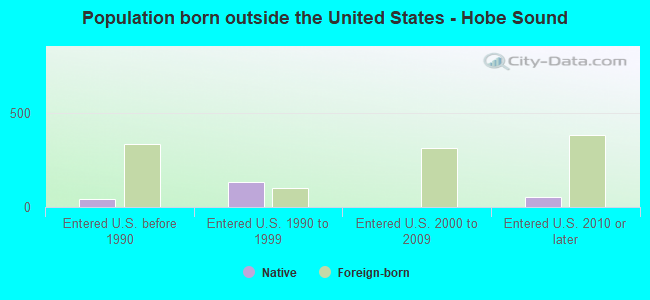
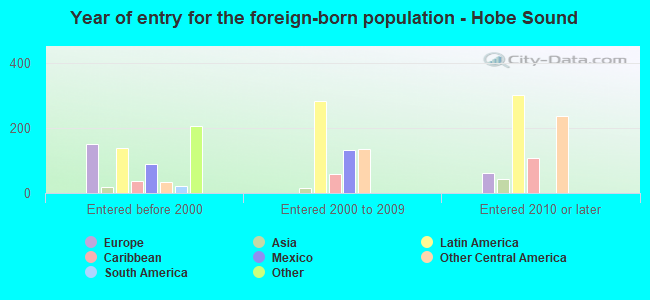
Foreign-born residents in Hobe Sound 1,216 residents are foreign born (4.9% Latin America , 1.4% Europe , 1.4% North America ).
This city:
8.4%Florida:
21.1%
Marital status for residents in Hobe Sound Marital status - White (Caucasian) population 15 years and over
Males 29.5% Never married47.9% Now married1.2% Separated5.6% Widowed15.7% DivorcedFemales 15.4% Never married51.1% Now married0.9% Separated15.9% Widowed16.6% DivorcedWomen who gave birth in the past 12 months Now married:
80.9% (35)Unmarried:
19.1% (8)
Women who did not give birth in the past 12 months Now married:
47.0% (713)Unmarried:
53.0% (803)
Marital status - Black or African American population 15 years and over
Males 39.3% Never married24.0% Now married0.0% Separated0.0% Widowed36.7% DivorcedFemales 70.8% Never married5.0% Now married0.0% Separated8.7% Widowed15.5% DivorcedWomen who did not give birth in the past 12 months Now married:
0.0% (0)Unmarried:
100.0% (83)
Marital status - Asian population 15 years and over
Males 0.0% Never married100.0% Now married0.0% Separated0.0% Widowed0.0% DivorcedFemales 0.0% Never married100.0% Now married0.0% Separated0.0% Widowed0.0% DivorcedWomen who did not give birth in the past 12 months Now married:
100.0% (10)Unmarried:
0.0% (0)
Marital status - Other race population 15 years and over
Males 100.0% Never married0.0% Now married0.0% Separated0.0% Widowed0.0% DivorcedFemales 36.8% Never married21.1% Now married0.0% Separated0.0% Widowed42.1% DivorcedWomen who did not give birth in the past 12 months Now married:
36.4% (11)Unmarried:
63.6% (20)
Marital status - Two or more races population 15 years and over
Males 31.7% Never married68.3% Now married0.0% Separated0.0% Widowed0.0% DivorcedFemales 40.4% Never married49.9% Now married0.0% Separated4.7% Widowed5.0% DivorcedWomen who did not give birth in the past 12 months Now married:
35.3% (151)Unmarried:
64.7% (277)
Marital status - White alone, not Hispanic / Latino population 15 years and over
Males 27.2% Never married48.7% Now married1.3% Separated5.8% Widowed17.0% DivorcedFemales 14.8% Never married50.9% Now married1.0% Separated16.3% Widowed17.0% DivorcedWomen who gave birth in the past 12 months Now married:
80.9% (37)Unmarried:
19.1% (9)
Women who did not give birth in the past 12 months Now married:
46.7% (693)Unmarried:
53.3% (792)
Marital status - Hispanic or Latino population 15 years and over
Males 54.9% Never married43.2% Now married0.0% Separated2.0% Widowed0.0% DivorcedFemales 46.8% Never married45.4% Now married0.0% Separated4.3% Widowed3.6% DivorcedWomen who did not give birth in the past 12 months Now married:
34.5% (129)Unmarried:
65.5% (244)
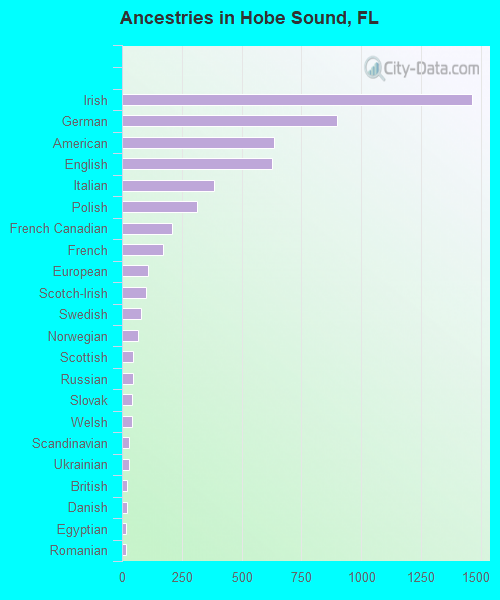
Ancestries in Hobe Sound
1,462 20.8% Irish901 12.8% German636 9.1% American627 8.9% English384 5.5% Italian314 4.5% Polish210 3.0% French Canadian172 2.4% French109 1.6% European99 1.4% Scotch-Irish79 1.1% Swedish68 1.0% Norwegian45 0.6% Scottish44 0.6% Russian41 0.6% Slovak41 0.6% Welsh30 0.4% Scandinavian28 0.4% Ukrainian22 0.3% British21 0.3% Danish17 0.2% Egyptian15 0.2% Romanian13 0.2% Eastern European12 0.2% Belizean9 0.1% Northern European8 0.1% Dutch7 0.10% Canadian
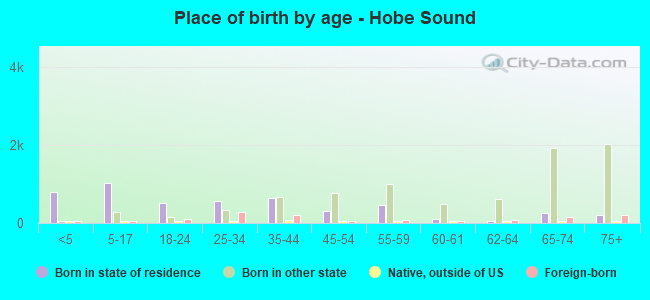
Children Nativity (place of birth) in Hobe Sound
Children under 6 years - Living with two parents Both parents native 445 100.0% NativeBoth parents foreign-born 394 100.0% NativeOne native, one foreign-born parent 73 100.0% NativeChildren under 6 years - Living with one parent Native parent 77 100.0% NativeForeign-born parent 32 100.0% Native
Children 6 to 17 years - Living with two parents Both parents native 420 100.0% NativeBoth parents foreign-born 256 100.0% NativeOne native, one foreign-born parent 111 100.0% NativeChildren 6 to 17 years - Living with one parent Native parent 374 100.0% Native
Grandparents responsible for own grandchildren in Hobe Sound
Grandparents (30 to 59 years) Black or African American 13 100.0% Responsible for grandchildren
Grandparents (60 years and over) Black or African American 10 100.0% Responsible for grandchildren