Races in Hobbs, New Mexico (NM) Detailed Stats
Data:
Races - White alone (%)
Races - White alone (% change since 2000)
Races - Black alone (%)
Races - Black alone (% change since 2000)
Races - American Indian alone (%)
Races - American Indian alone (% change since 2000)
Races - Asian alone (%)
Races - Asian alone (% change since 2000)
Races - Hispanic (%)
Races - Hispanic (% change since 2000)
Races - Native Hawaiian and Other Pacific Islander alone (%)
Races - Native Hawaiian and Other Pacific Islander alone (% change since 2000)
Races - Two or more races(%)
Races - Two or more races(% change since 2000)
Races - Other race alone (%)
Races - Other race alone (% change since 2000)
Racial diversity
Place of birth - Born in state of residence (%)
Place of birth - Born in state of residence (%) - White
Place of birth - Born in state of residence (%) - Black or African American
Place of birth - Born in state of residence (%) - Asian
Place of birth - Born in state of residence (%) - Hispanic or Latino
Place of birth - Born in state of residence (%) - American Indian and Alaska Native
Place of birth - Born in state of residence (%) - Multirace
Place of birth - Born in state of residence (%) - Other Race
Place of birth - Born in other state (%)
Place of birth - Born in other state (%) - White
Place of birth - Born in other state (%) - Black or African American
Place of birth - Born in other state (%) - Asian
Place of birth - Born in other state (%) - Hispanic or Latino
Place of birth - Born in other state (%) - American Indian and Alaska Native
Place of birth - Born in other state (%) - Multirace
Place of birth - Born in other state (%) - Other Race
Place of birth - Native, outside of US (%)
Place of birth - Native, outside of US (%) - White
Place of birth - Native, outside of US (%) - Black or African American
Place of birth - Native, outside of US (%) - Asian
Place of birth - Native, outside of US (%) - Hispanic or Latino
Place of birth - Native, outside of US (%) - American Indian and Alaska Native
Place of birth - Native, outside of US (%) - Multirace
Place of birth - Native, outside of US (%) - Other Race
Place of birth - Foreign born (%)
Place of birth - Foreign born (%) - White
Place of birth - Foreign born (%) - Black or African American
Place of birth - Foreign born (%) - Asian
Place of birth - Foreign born (%) - Hispanic or Latino
Place of birth - Foreign born (%) - American Indian and Alaska Native
Place of birth - Foreign born (%) - Multirace
Place of birth - Foreign born (%) - Other Race
Residents speaking English at home (%)
Residents speaking English at home - Born in the United States (%)
Residents speaking English at home - Native, born elsewhere (%)
Residents speaking English at home - Foreign born (%)
Residents speaking Spanish at home (%)
Residents speaking Spanish at home - Born in the United States (%)
Residents speaking Spanish at home - Native, born elsewhere (%)
Residents speaking Spanish at home - Foreign born (%)
Residents speaking other language at home (%)
Residents speaking other language at home - Born in the United States (%)
Residents speaking other language at home - Native, born elsewhere (%)
Residents speaking other language at home - Foreign born (%)
Marital status - Never married (%)
Marital status - Now married (%)
Marital status - Separated (%)
Marital status - Widowed (%)
Marital status - Divorced (%)
Ancestries Reported - Arab (%)
Ancestries Reported - Czech (%)
Ancestries Reported - Danish (%)
Ancestries Reported - Dutch (%)
Ancestries Reported - English (%)
Ancestries Reported - French (%)
Ancestries Reported - French Canadian (%)
Ancestries Reported - German (%)
Ancestries Reported - Greek (%)
Ancestries Reported - Hungarian (%)
Ancestries Reported - Irish (%)
Ancestries Reported - Italian (%)
Ancestries Reported - Lithuanian (%)
Ancestries Reported - Norwegian (%)
Ancestries Reported - Polish (%)
Ancestries Reported - Portuguese (%)
Ancestries Reported - Russian (%)
Ancestries Reported - Scotch-Irish (%)
Ancestries Reported - Scottish (%)
Ancestries Reported - Slovak (%)
Ancestries Reported - Subsaharan African (%)
Ancestries Reported - Swedish (%)
Ancestries Reported - Swiss (%)
Ancestries Reported - Ukrainian (%)
Ancestries Reported - United States (%)
Ancestries Reported - Welsh (%)
Ancestries Reported - West Indian (%)
Ancestries Reported - Other (%)
Geographical mobility - Same house 1 year ago (%)
Geographical mobility - Same house 1 year ago (%) - White
Geographical mobility - Same house 1 year ago (%) - Black or African American
Geographical mobility - Same house 1 year ago (%) - Asian
Geographical mobility - Same house 1 year ago (%) - Hispanic or Latino
Geographical mobility - Same house 1 year ago (%) - American Indian and Alaska Native
Geographical mobility - Same house 1 year ago (%) - Multirace
Geographical mobility - Same house 1 year ago (%) - Other Race
Geographical mobility - Moved within same county (%)
Geographical mobility - Moved within same county (%) - White
Geographical mobility - Moved within same county (%) - Black or African American
Geographical mobility - Moved within same county (%) - Asian
Geographical mobility - Moved within same county (%) - Hispanic or Latino
Geographical mobility - Moved within same county (%) - American Indian and Alaska Native
Geographical mobility - Moved within same county (%) - Multirace
Geographical mobility - Moved within same county (%) - Other Race
Geographical mobility - Moved from different county within same state (%)
Geographical mobility - Moved from different county within same state (%) - White
Geographical mobility - Moved from different county within same state (%) - Black or African American
Geographical mobility - Moved from different county within same state (%) - Asian
Geographical mobility - Moved from different county within same state (%) - Hispanic or Latino
Geographical mobility - Moved from different county within same state (%) - American Indian and Alaska Native
Geographical mobility - Moved from different county within same state (%) - Multirace
Geographical mobility - Moved from different county within same state (%) - Other Race
Geographical mobility - Moved from different state (%)
Geographical mobility - Moved from different state (%) - White
Geographical mobility - Moved from different state (%) - Black or African American
Geographical mobility - Moved from different state (%) - Asian
Geographical mobility - Moved from different state (%) - Hispanic or Latino
Geographical mobility - Moved from different state (%) - American Indian and Alaska Native
Geographical mobility - Moved from different state (%) - Multirace
Geographical mobility - Moved from different state (%) - Other Race
Geographical mobility - Moved from abroad (%)
Geographical mobility - Moved from abroad (%) - White
Geographical mobility - Moved from abroad (%) - Black or African American
Geographical mobility - Moved from abroad (%) - Asian
Geographical mobility - Moved from abroad (%) - Hispanic or Latino
Geographical mobility - Moved from abroad (%) - American Indian and Alaska Native
Geographical mobility - Moved from abroad (%) - Multirace
Geographical mobility - Moved from abroad (%) - Other Race
Place of birth for the foreign-born population - Ireland (%)
Place of birth for the foreign-born population - Denmark (%)
Place of birth for the foreign-born population - Norway (%)
Place of birth for the foreign-born population - Sweden (%)
Place of birth for the foreign-born population - United Kingdom (%)
Place of birth for the foreign-born population - England (%)
Place of birth for the foreign-born population - Scotland (%)
Place of birth for the foreign-born population - Other Northern Europe (%)
Place of birth for the foreign-born population - Austria (%)
Place of birth for the foreign-born population - Belgium (%)
Place of birth for the foreign-born population - France (%)
Place of birth for the foreign-born population - Germany (%)
Place of birth for the foreign-born population - Netherlands (%)
Place of birth for the foreign-born population - Switzerland (%)
Place of birth for the foreign-born population - Other Western Europe (%)
Place of birth for the foreign-born population - Greece (%)
Place of birth for the foreign-born population - Italy (%)
Place of birth for the foreign-born population - Portugal (%)
Place of birth for the foreign-born population - Spain (%)
Place of birth for the foreign-born population - Other Southern Europe (%)
Place of birth for the foreign-born population - Albania (%)
Place of birth for the foreign-born population - Belarus (%)
Place of birth for the foreign-born population - Bosnia and Herzegovina (%)
Place of birth for the foreign-born population - Bulgaria (%)
Place of birth for the foreign-born population - Croatia (%)
Place of birth for the foreign-born population - Czechoslovakia (%)
Place of birth for the foreign-born population - Hungary (%)
Place of birth for the foreign-born population - Latvia (%)
Place of birth for the foreign-born population - Lithuania (%)
Place of birth for the foreign-born population - North Macedonia (Macedonia) (%)
Place of birth for the foreign-born population - Moldova (%)
Place of birth for the foreign-born population - Poland (%)
Place of birth for the foreign-born population - Romania (%)
Place of birth for the foreign-born population - Russia (%)
Place of birth for the foreign-born population - Serbia (%)
Place of birth for the foreign-born population - Ukraine (%)
Place of birth for the foreign-born population - Other Eastern Europe (%)
Place of birth for the foreign-born population - China (%)
Place of birth for the foreign-born population - Hong Kong (%)
Place of birth for the foreign-born population - Taiwan (%)
Place of birth for the foreign-born population - Japan (%)
Place of birth for the foreign-born population - Korea (%)
Place of birth for the foreign-born population - Other Eastern Asia (%)
Place of birth for the foreign-born population - Afghanistan (%)
Place of birth for the foreign-born population - Bangladesh (%)
Place of birth for the foreign-born population - India (%)
Place of birth for the foreign-born population - Iran (%)
Place of birth for the foreign-born population - Kazakhstan (%)
Place of birth for the foreign-born population - Nepal (%)
Place of birth for the foreign-born population - Pakistan (%)
Place of birth for the foreign-born population - Sri Lanka (%)
Place of birth for the foreign-born population - Uzbekistan (%)
Place of birth for the foreign-born population - Other South Central Asia (%)
Place of birth for the foreign-born population - Burma (%)
Place of birth for the foreign-born population - Cambodia (%)
Place of birth for the foreign-born population - Indonesia (%)
Place of birth for the foreign-born population - Laos (%)
Place of birth for the foreign-born population - Malaysia (%)
Place of birth for the foreign-born population - Philippines (%)
Place of birth for the foreign-born population - Singapore (%)
Place of birth for the foreign-born population - Thailand (%)
Place of birth for the foreign-born population - Vietnam (%)
Place of birth for the foreign-born population - Other South Eastern Asia (%)
Place of birth for the foreign-born population - Armenia (%)
Place of birth for the foreign-born population - Iraq (%)
Place of birth for the foreign-born population - Israel (%)
Place of birth for the foreign-born population - Jordan (%)
Place of birth for the foreign-born population - Kuwait (%)
Place of birth for the foreign-born population - Lebanon (%)
Place of birth for the foreign-born population - Saudi Arabia (%)
Place of birth for the foreign-born population - Syria (%)
Place of birth for the foreign-born population - Turkey (%)
Place of birth for the foreign-born population - Yemen (%)
Place of birth for the foreign-born population - Other Western Asia (%)
Place of birth for the foreign-born population - Eritrea (%)
Place of birth for the foreign-born population - Ethiopia (%)
Place of birth for the foreign-born population - Kenya (%)
Place of birth for the foreign-born population - Somalia (%)
Place of birth for the foreign-born population - Uganda (%)
Place of birth for the foreign-born population - Zimbabwe (%)
Place of birth for the foreign-born population - Other Eastern Africa (%)
Place of birth for the foreign-born population - Cameroon (%)
Place of birth for the foreign-born population - Congo (%)
Place of birth for the foreign-born population - Democratic Republic of Congo (Zaire) (%)
Place of birth for the foreign-born population - Other Middle Africa (%)
Place of birth for the foreign-born population - Egypt (%)
Place of birth for the foreign-born population - Morocco (%)
Place of birth for the foreign-born population - Sudan (%)
Place of birth for the foreign-born population - Other Northern Africa (%)
Place of birth for the foreign-born population - South Africa (%)
Place of birth for the foreign-born population - Other Southern Africa (%)
Place of birth for the foreign-born population - Cabo Verde (%)
Place of birth for the foreign-born population - Ghana (%)
Place of birth for the foreign-born population - Liberia (%)
Place of birth for the foreign-born population - Nigeria (%)
Place of birth for the foreign-born population - Senegal (%)
Place of birth for the foreign-born population - Sierra Leone (%)
Place of birth for the foreign-born population - Other Western Africa (%)
Place of birth for the foreign-born population - Australia (%)
Place of birth for the foreign-born population - New Zealand (%)
Place of birth for the foreign-born population - Fiji (%)
Place of birth for the foreign-born population - Micronesia (%)
Place of birth for the foreign-born population - Bahamas (%)
Place of birth for the foreign-born population - Barbados (%)
Place of birth for the foreign-born population - Cuba (%)
Place of birth for the foreign-born population - Dominica (%)
Place of birth for the foreign-born population - Dominican Republic (%)
Place of birth for the foreign-born population - Grenada (%)
Place of birth for the foreign-born population - Haiti (%)
Place of birth for the foreign-born population - Jamaica (%)
Place of birth for the foreign-born population - St. Vincent and the Grenadines (%)
Place of birth for the foreign-born population - Trinidad and Tobago (%)
Place of birth for the foreign-born population - West Indies (%)
Place of birth for the foreign-born population - Other Caribbean (%)
Place of birth for the foreign-born population - Belize (%)
Place of birth for the foreign-born population - Costa Rica (%)
Place of birth for the foreign-born population - El Salvador (%)
Place of birth for the foreign-born population - Guatemala (%)
Place of birth for the foreign-born population - Honduras (%)
Place of birth for the foreign-born population - Mexico (%)
Place of birth for the foreign-born population - Nicaragua (%)
Place of birth for the foreign-born population - Panama (%)
Place of birth for the foreign-born population - Other Central America (%)
Place of birth for the foreign-born population - Argentina (%)
Place of birth for the foreign-born population - Bolivia (%)
Place of birth for the foreign-born population - Brazil (%)
Place of birth for the foreign-born population - Chile (%)
Place of birth for the foreign-born population - Colombia (%)
Place of birth for the foreign-born population - Ecuador (%)
Place of birth for the foreign-born population - Guyana (%)
Place of birth for the foreign-born population - Peru (%)
Place of birth for the foreign-born population - Uruguay (%)
Place of birth for the foreign-born population - Venezuela (%)
Place of birth for the foreign-born population - Other South America (%)
Place of birth for the foreign-born population - Canada (%)
Place of birth for the foreign-born population - Other Northern America (%)
Place of birth for the foreign-born population - Other (%)
Latest news about races in Hobbs, NM collected exclusively by city-data.com from local newspapers, TV, and radio stations
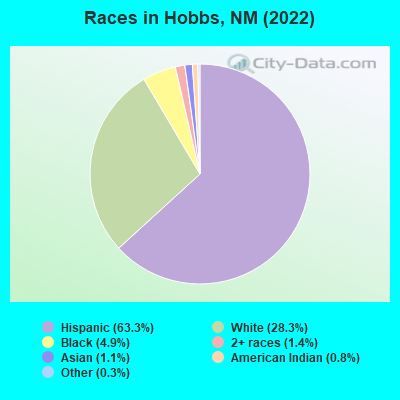
According to 2022 data, the most numerous races in Hobbs, NM are Hispanic (25,178 residents), White alone (11,262 residents), and American Indian alone (301 residents). 52.7% of Hobbs residents speak English at home. 18.1% of Hobbs, NM residents are foreign-born (16.7% born in Latin America), which is 50.3% greater than the foreign-born rate of 9.0% across the entire state of New Mexico.
Race distribution in Hobbs
2000 2022
813,495 44.7% White alone 765,386 42.1% Hispanic 161,460 8.9% American Indian alone 30,654 1.7% Black alone 25,793 1.4% Two or more races 18,257 1.0% Asian alone 3,009 0.2% Other race alone 992 0.05% Native Hawaiian and Other
1,059,867 50.2% Hispanic 735,478 34.8% White alone 171,808 8.1% American Indian alone 65,084 3.1% Two or more races 36,870 1.7% Black alone 35,870 1.7% Asian alone 7,582 0.4% Other race alone 785 0.04% Native Hawaiian and Other
Income and house value in Hobbs Median household income in 2022 $81,090 White non-Hispanic householders$45,341 Black householders$63,650 American Indian and Alaska Native householders$116,729 Asian householders$52,859 Some other race householders$52,081 Two or more races householders$51,462 Hispanic or Latino race householdersMedian 2022 house value $230,955 White Non-Hispanic householders$139,681 Black or African American householders$100,881 American Indian or Alaska Native householders over $1,000,000 Asian householders$131,552 Some other race householders$186,611 Two or more races householders$131,182 Hispanic or Latino householders
Median age by race in Hobbs
39.0 Median age for White residents38.5 39.9 36.3 Median age for Black or African American residents27.2 60.8 30.5 Median age for American Indian / Alaska Native residents31.5 25.7 11.8 Median age for Asian residents11.6 14.7 -666,666,666.0 Median age for Native Hawaiian / Pacific Islander residents-666,666,666.0 -666,666,666.0 31.2 Median age for Other race residents30.8 37.6 27.8 Median age for Two or more races residents24.5 32.6 44.0 Median age for White alone residents42.5 47.3 25.8 Median age for Hispanic or Latino residents25.4 25.8
Owner/renter occupied households by race in Hobbs
House owners and renters - White residents 4,610 71.1% Owner occupied1,873 28.9% Renter occupiedHouse owners and renters - Black or African American residents 197 32.3% Owner occupied414 67.7% Renter occupiedHouse owners and renters - American Indian / Alaska Native residents 36 35.5% Owner occupied66 64.5% Renter occupiedHouse owners and renters - Asian residents 21 24.3% Owner occupied65 75.7% Renter occupiedHouse owners and renters - Other race residents 1,022 51.6% Owner occupied959 48.4% Renter occupiedHouse owners and renters - Two or more races residents 3,797 73.5% Owner occupied1,372 26.5% Renter occupiedHouse owners and renters - White alone residents 3,672 75.0% Owner occupied1,227 25.0% Renter occupiedHouse owners and renters - Hispanic or Latino residents 5,159 64.8% Owner occupied2,797 35.2% Renter occupied
Language usage in Hobbs
English speakers - Total 52.7% of residents of Hobbs speak English at home.
43.3% of residents speak Spanish at home 10,103 63.9% Speak English very well5,718 36.1% Speak English less than very well4.2% of residents speak other language at home 1,376 90.7% Speak English very well141 9.3% Speak English less than very well
English speakers - Born in the United States 59.0% of residents of Hobbs speak English at home.
37.3% of residents speak Spanish at home 3,963 80.1% Speak English very well982 19.9% Speak English less than very well3.6% of residents speak other language at home 475 100.0% Speak English very well
English speakers - Native, born elsewhere 41.1% of residents of Hobbs speak English at home.
96.3% of residents speak Spanish at home 310 47.9% Speak English very well337 52.1% Speak English less than very well1.5% of residents speak other language at home 10 100.0% Speak English very well
English speakers - Foreign-born 6.4% of residents of Hobbs speak English at home.
83.5% of residents speak Spanish at home 2,322 36.7% Speak English very well4,012 63.3% Speak English less than very well4.7% of residents speak other language at home 205 57.3% Speak English very well153 42.7% Speak English less than very well
White (Caucasian) - Speak only English Native:
85.7% (11,358)Foreign-born:
24.6% (239)
White (Caucasian) - Speak another language Native:
14.8% (1,962)Foreign-born:
100.0% (974)
Black or African American - Speak only English Native:
96.7% (2,000)Foreign-born:
79.9% (80)
Black or African American - Speak another language Native:
3.6% (73)Foreign-born:
40.7% (41)
American Indian / Alaska Native - Speak another language Native:
41.3% (178)Foreign-born:
100.0% (42)
Asian - Speak only English Native:
64.2% (41)Foreign-born:
0.6% (1)
Asian - Speak another language Native:
35.7% (23)Foreign-born:
97.6% (211)
Other race - Speak only English Native:
52.9% (1,599)Foreign-born:
19.8% (252)
Other race - Speak another language Native:
48.2% (1,456)Foreign-born:
80.4% (1,025)
Two or more races - Speak only English Native:
40.6% (4,730)Foreign-born:
0.5% (27)
Two or more races - Speak another language Native:
56.9% (6,631)Foreign-born:
97.6% (5,466)
White alone - Speak only English Native:
96.0% (10,039)Foreign-born:
62.2% (78)
White alone - Speak another language Native:
3.9% (408)Foreign-born:
38.8% (49)
Hispanic or Latino - Speak only English Native:
40.6% (6,649)Foreign-born:
6.3% (424)
Hispanic or Latino - Speak another language Native:
57.0% (9,348)Foreign-born:
93.7% (6,326)
Foreign-born residents in Hobbs 7,143 residents are foreign born (16.7% Latin America ).
This city:
18.1%New Mexico:
9.2%
Marital status for residents in Hobbs Marital status - White (Caucasian) population 15 years and over
Males 44.1% Never married43.0% Now married1.2% Separated1.9% Widowed9.8% DivorcedFemales 30.8% Never married46.4% Now married2.9% Separated9.8% Widowed10.1% DivorcedWomen who gave birth in the past 12 months Now married:
33.8% (113)Unmarried:
66.2% (220)
Women who did not give birth in the past 12 months Now married:
48.8% (1,443)Unmarried:
51.2% (1,513)
Marital status - Black or African American population 15 years and over
Males 48.5% Never married37.5% Now married1.0% Separated9.9% Widowed3.2% DivorcedFemales 55.6% Never married11.0% Now married15.1% Separated13.0% Widowed5.3% DivorcedWomen who gave birth in the past 12 months Now married:
100.0% (65)Unmarried:
0.0% (0)
Women who did not give birth in the past 12 months Now married:
6.7% (34)Unmarried:
93.3% (468)
Marital status - American Indian / Alaska Native population 15 years and over
Males 28.9% Never married49.4% Now married2.6% Separated0.0% Widowed19.1% DivorcedFemales 83.5% Never married16.5% Now married0.0% Separated0.0% Widowed0.0% DivorcedWomen who gave birth in the past 12 months Now married:
0.0% (0)Unmarried:
100.0% (13)
Women who did not give birth in the past 12 months Now married:
8.6% (5)Unmarried:
91.4% (54)
Marital status - Asian population 15 years and over
Males 10.1% Never married89.9% Now married0.0% Separated0.0% Widowed0.0% DivorcedFemales 2.0% Never married86.3% Now married0.0% Separated11.8% Widowed0.0% DivorcedWomen who gave birth in the past 12 months Now married:
100.0% (4)Unmarried:
0.0% (0)
Women who did not give birth in the past 12 months Now married:
97.6% (98)Unmarried:
2.4% (2)
Marital status - Other race population 15 years and over
Males 49.6% Never married43.3% Now married0.9% Separated0.5% Widowed5.7% DivorcedFemales 38.1% Never married48.0% Now married1.9% Separated5.7% Widowed6.2% DivorcedWomen who gave birth in the past 12 months Now married:
41.2% (41)Unmarried:
58.8% (58)
Women who did not give birth in the past 12 months Now married:
39.1% (346)Unmarried:
60.9% (541)
Marital status - Two or more races population 15 years and over
Males 53.2% Never married36.3% Now married1.7% Separated2.3% Widowed6.6% DivorcedFemales 30.0% Never married41.8% Now married3.8% Separated2.9% Widowed21.4% DivorcedWomen who gave birth in the past 12 months Now married:
89.5% (141)Unmarried:
10.5% (16)
Women who did not give birth in the past 12 months Now married:
43.7% (1,978)Unmarried:
56.3% (2,545)
Marital status - White alone, not Hispanic / Latino population 15 years and over
Males 36.6% Never married46.7% Now married1.6% Separated2.6% Widowed12.5% DivorcedFemales 23.9% Never married53.7% Now married2.0% Separated11.8% Widowed8.6% DivorcedWomen who gave birth in the past 12 months Now married:
62.0% (106)Unmarried:
38.0% (65)
Women who did not give birth in the past 12 months Now married:
50.5% (1,064)Unmarried:
49.5% (1,044)
Marital status - Hispanic or Latino population 15 years and over
Males 52.6% Never married38.3% Now married1.2% Separated1.4% Widowed6.5% DivorcedFemales 36.6% Never married39.5% Now married3.8% Separated5.1% Widowed15.1% DivorcedWomen who gave birth in the past 12 months Now married:
33.9% (171)Unmarried:
66.1% (334)
Women who did not give birth in the past 12 months Now married:
43.9% (2,461)Unmarried:
56.1% (3,150)
Ancestries in Hobbs
2,591 9.6% American963 3.6% German808 3.0% English505 1.9% Irish291 1.1% European203 0.7% African117 0.4% Italian51 0.2% Nigerian45 0.2% French42 0.2% Scottish40 0.1% Norwegian39 0.1% Lebanese35 0.1% Welsh32 0.1% British24 0.09% Canadian22 0.08% Haitian21 0.08% Dutch16 0.06% Finnish13 0.05% French Canadian12 0.04% Danish12 0.04% Scotch-Irish9 0.03% Polish8 0.03% Swedish7 0.03% Belgian4 0.01% Ethiopian
Geographical mobility in Hobbs Same house 1 year ago 15,651 88.6% White (Caucasian)2,061 89.4% Black or African American361 78.8% American Indian / Alaska Native409 96.2% Asian3,579 74.6% Other race13,037 69.7% Two or more races9,649 86.3% White alone, not Hispanic / Latino19,523 77.3% Hispanic or LatinoMoved within same county 1,076 6.1% White / Caucasian186 8.1% Black or African American3 0.6% American Indian / Alaska Native15 3.5% Asian394 8.2% Other race2,545 13.6% Two or more races694 6.2% White alone, not Hispanic / Latino5,019 19.9% Hispanic or LatinoMoved within same state 136 0.8% White / Caucasian35 1.5% Black or African American54 11.9% American Indian / Alaska Native2 0.4% Asian33 0.7% Other race358 1.9% Two or more races112 1.0% White alone, not Hispanic / Latino350 1.4% Hispanic or LatinoMoved from different state 838 4.7% White / Caucasian40 1.7% Black or African American23 5.0% American Indian / Alaska Native413 8.6% Other race277 1.5% Two or more races731 6.5% White alone, not Hispanic / Latino885 3.5% Hispanic or LatinoMoved from abroad 15 0.1% White5 0.2% Black or African American57 12.5% American Indian / Alaska Native196 4.1% Other race169 0.9% Two or more races474 1.9% Hispanic or Latino
Children Nativity (place of birth) in Hobbs
Children under 6 years - Living with two parents Both parents native 726 100.0% NativeBoth parents foreign-born 356 100.0% NativeOne native, one foreign-born parent 404 100.0% NativeChildren under 6 years - Living with one parent Native parent 1,861 100.0% NativeForeign-born parent 223 100.0% NativeChildren 6 to 17 years - Living with two parents Both parents native 2,345 99.8% Native6 0.2% Foreign-bornBoth parents foreign-born 521 61.5% Native327 38.5% Foreign-bornOne native, one foreign-born parent 242 100.0% NativeChildren 6 to 17 years - Living with one parent Native parent 2,630 100.0% NativeForeign-born parent 880 59.0% Native611 41.0% Foreign-born
Grandparents responsible for own grandchildren in Hobbs
Grandparents (30 to 59 years) White / Caucasian 111 70.1% Responsible for grandchildren47 29.9% Not responsible for grandchildrenBlack or African American 22 100.0% Responsible for grandchildrenOther race 43 100.0% Responsible for grandchildrenTwo or more races 123 100.0% Responsible for grandchildrenWhite alone, not Hispanic / Latino 74 100.0% Not responsible for grandchildrenHispanic or Latino 216 100.0% Responsible for grandchildren
Grandparents (60 years and over) White / Caucasian 77 100.0% Not responsible for grandchildrenBlack or African American 12 100.0% Responsible for grandchildrenOther race 13 100.0% Not responsible for grandchildrenTwo or more races 250 100.0% Not responsible for grandchildrenWhite alone, not Hispanic / Latino 4 100.0% Not responsible for grandchildrenHispanic or Latino 223 100.0% Not responsible for grandchildren