Races in Highland Park, New Jersey (NJ) Detailed Stats
Data:
Races - White alone (%)
Races - White alone (% change since 2000)
Races - Black alone (%)
Races - Black alone (% change since 2000)
Races - American Indian alone (%)
Races - American Indian alone (% change since 2000)
Races - Asian alone (%)
Races - Asian alone (% change since 2000)
Races - Hispanic (%)
Races - Hispanic (% change since 2000)
Races - Native Hawaiian and Other Pacific Islander alone (%)
Races - Native Hawaiian and Other Pacific Islander alone (% change since 2000)
Races - Two or more races(%)
Races - Two or more races(% change since 2000)
Races - Other race alone (%)
Races - Other race alone (% change since 2000)
Racial diversity
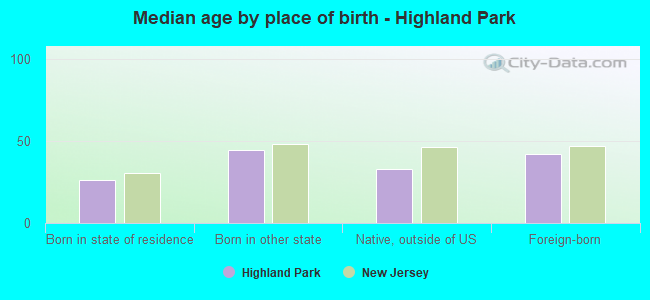
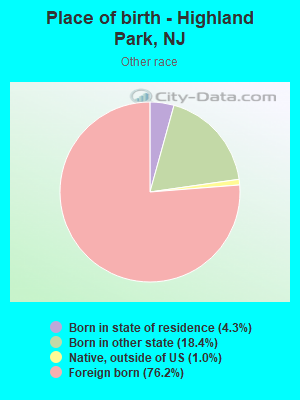
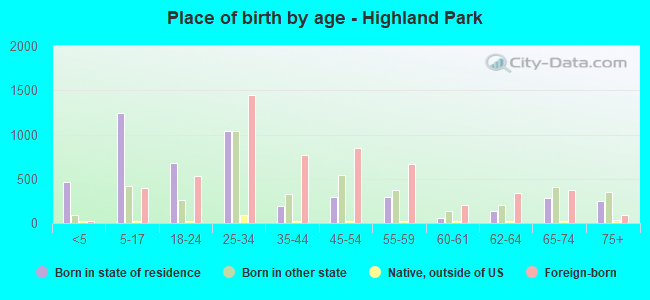
Place of birth - Born in state of residence (%)
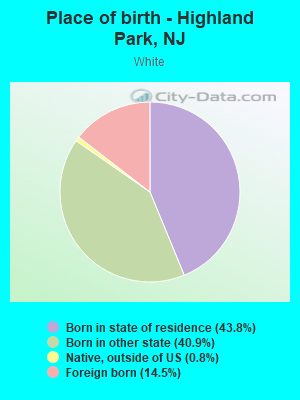
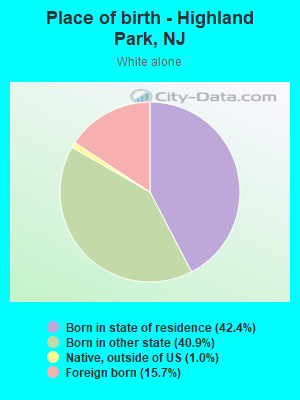
Place of birth - Born in state of residence (%) - White
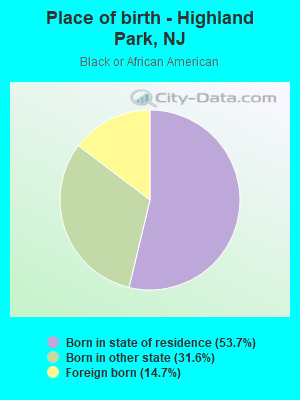
Place of birth - Born in state of residence (%) - Black or African American
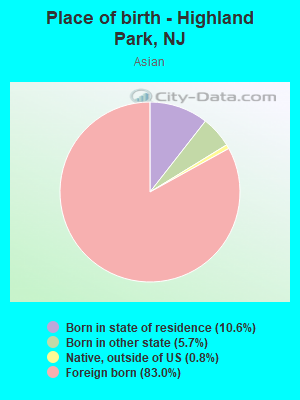
Place of birth - Born in state of residence (%) - Asian
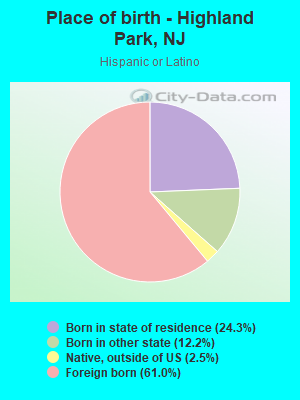
Place of birth - Born in state of residence (%) - Hispanic or Latino
Place of birth - Born in state of residence (%) - American Indian and Alaska Native
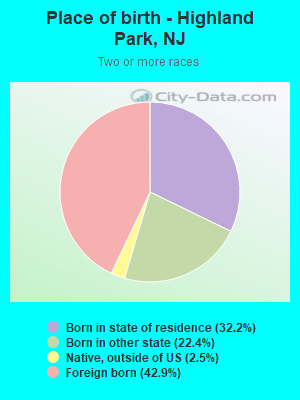
Place of birth - Born in state of residence (%) - Multirace
Place of birth - Born in state of residence (%) - Other Race
Place of birth - Born in other state (%)
Place of birth - Born in other state (%) - White
Place of birth - Born in other state (%) - Black or African American
Place of birth - Born in other state (%) - Asian
Place of birth - Born in other state (%) - Hispanic or Latino
Place of birth - Born in other state (%) - American Indian and Alaska Native
Place of birth - Born in other state (%) - Multirace
Place of birth - Born in other state (%) - Other Race
Place of birth - Native, outside of US (%)
Place of birth - Native, outside of US (%) - White
Place of birth - Native, outside of US (%) - Black or African American
Place of birth - Native, outside of US (%) - Asian
Place of birth - Native, outside of US (%) - Hispanic or Latino
Place of birth - Native, outside of US (%) - American Indian and Alaska Native
Place of birth - Native, outside of US (%) - Multirace
Place of birth - Native, outside of US (%) - Other Race
Place of birth - Foreign born (%)
Place of birth - Foreign born (%) - White
Place of birth - Foreign born (%) - Black or African American
Place of birth - Foreign born (%) - Asian
Place of birth - Foreign born (%) - Hispanic or Latino
Place of birth - Foreign born (%) - American Indian and Alaska Native
Place of birth - Foreign born (%) - Multirace
Place of birth - Foreign born (%) - Other Race
Residents speaking English at home (%)
Residents speaking English at home - Born in the United States (%)
Residents speaking English at home - Native, born elsewhere (%)
Residents speaking English at home - Foreign born (%)
Residents speaking Spanish at home (%)
Residents speaking Spanish at home - Born in the United States (%)
Residents speaking Spanish at home - Native, born elsewhere (%)
Residents speaking Spanish at home - Foreign born (%)
Residents speaking other language at home (%)
Residents speaking other language at home - Born in the United States (%)
Residents speaking other language at home - Native, born elsewhere (%)
Residents speaking other language at home - Foreign born (%)
Marital status - Never married (%)
Marital status - Now married (%)
Marital status - Separated (%)
Marital status - Widowed (%)
Marital status - Divorced (%)
Ancestries Reported - Arab (%)
Ancestries Reported - Czech (%)
Ancestries Reported - Danish (%)
Ancestries Reported - Dutch (%)
Ancestries Reported - English (%)
Ancestries Reported - French (%)
Ancestries Reported - French Canadian (%)
Ancestries Reported - German (%)
Ancestries Reported - Greek (%)
Ancestries Reported - Hungarian (%)
Ancestries Reported - Irish (%)
Ancestries Reported - Italian (%)
Ancestries Reported - Lithuanian (%)
Ancestries Reported - Norwegian (%)
Ancestries Reported - Polish (%)
Ancestries Reported - Portuguese (%)
Ancestries Reported - Russian (%)
Ancestries Reported - Scotch-Irish (%)
Ancestries Reported - Scottish (%)
Ancestries Reported - Slovak (%)
Ancestries Reported - Subsaharan African (%)
Ancestries Reported - Swedish (%)
Ancestries Reported - Swiss (%)
Ancestries Reported - Ukrainian (%)
Ancestries Reported - United States (%)
Ancestries Reported - Welsh (%)
Ancestries Reported - West Indian (%)
Ancestries Reported - Other (%)
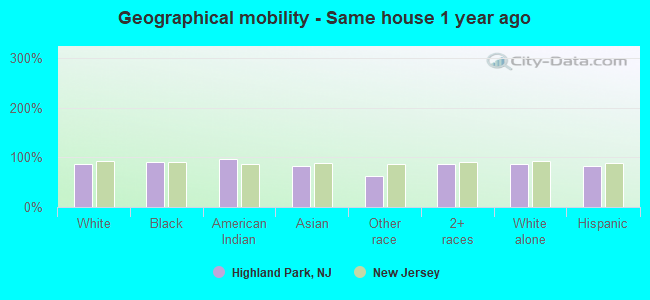
Geographical mobility - Same house 1 year ago (%)
Geographical mobility - Same house 1 year ago (%) - White
Geographical mobility - Same house 1 year ago (%) - Black or African American
Geographical mobility - Same house 1 year ago (%) - Asian
Geographical mobility - Same house 1 year ago (%) - Hispanic or Latino
Geographical mobility - Same house 1 year ago (%) - American Indian and Alaska Native
Geographical mobility - Same house 1 year ago (%) - Multirace
Geographical mobility - Same house 1 year ago (%) - Other Race
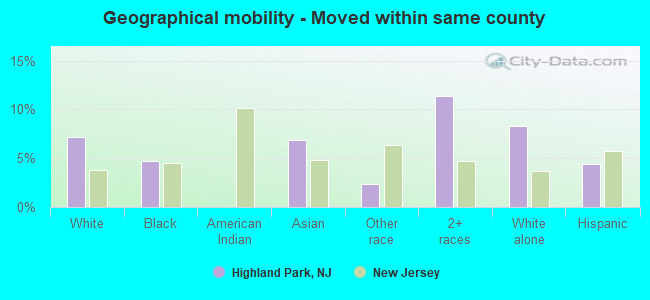
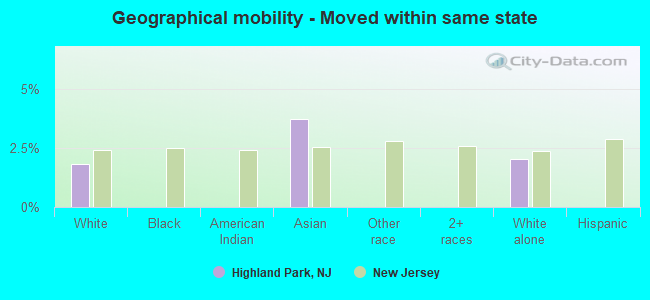
Geographical mobility - Moved within same county (%)
Geographical mobility - Moved within same county (%) - White
Geographical mobility - Moved within same county (%) - Black or African American
Geographical mobility - Moved within same county (%) - Asian
Geographical mobility - Moved within same county (%) - Hispanic or Latino
Geographical mobility - Moved within same county (%) - American Indian and Alaska Native
Geographical mobility - Moved within same county (%) - Multirace
Geographical mobility - Moved within same county (%) - Other Race
Geographical mobility - Moved from different county within same state (%)
Geographical mobility - Moved from different county within same state (%) - White
Geographical mobility - Moved from different county within same state (%) - Black or African American
Geographical mobility - Moved from different county within same state (%) - Asian
Geographical mobility - Moved from different county within same state (%) - Hispanic or Latino
Geographical mobility - Moved from different county within same state (%) - American Indian and Alaska Native
Geographical mobility - Moved from different county within same state (%) - Multirace
Geographical mobility - Moved from different county within same state (%) - Other Race
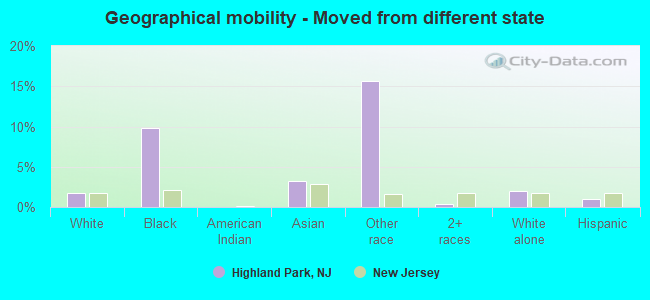
Geographical mobility - Moved from different state (%)
Geographical mobility - Moved from different state (%) - White
Geographical mobility - Moved from different state (%) - Black or African American
Geographical mobility - Moved from different state (%) - Asian
Geographical mobility - Moved from different state (%) - Hispanic or Latino
Geographical mobility - Moved from different state (%) - American Indian and Alaska Native
Geographical mobility - Moved from different state (%) - Multirace
Geographical mobility - Moved from different state (%) - Other Race
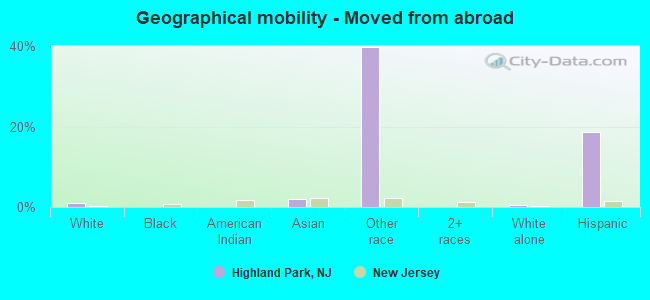
Geographical mobility - Moved from abroad (%)
Geographical mobility - Moved from abroad (%) - White
Geographical mobility - Moved from abroad (%) - Black or African American
Geographical mobility - Moved from abroad (%) - Asian
Geographical mobility - Moved from abroad (%) - Hispanic or Latino
Geographical mobility - Moved from abroad (%) - American Indian and Alaska Native
Geographical mobility - Moved from abroad (%) - Multirace
Geographical mobility - Moved from abroad (%) - Other Race
Place of birth for the foreign-born population - Ireland (%)
Place of birth for the foreign-born population - Denmark (%)
Place of birth for the foreign-born population - Norway (%)
Place of birth for the foreign-born population - Sweden (%)
Place of birth for the foreign-born population - United Kingdom (%)
Place of birth for the foreign-born population - England (%)
Place of birth for the foreign-born population - Scotland (%)
Place of birth for the foreign-born population - Other Northern Europe (%)
Place of birth for the foreign-born population - Austria (%)
Place of birth for the foreign-born population - Belgium (%)
Place of birth for the foreign-born population - France (%)
Place of birth for the foreign-born population - Germany (%)
Place of birth for the foreign-born population - Netherlands (%)
Place of birth for the foreign-born population - Switzerland (%)
Place of birth for the foreign-born population - Other Western Europe (%)
Place of birth for the foreign-born population - Greece (%)
Place of birth for the foreign-born population - Italy (%)
Place of birth for the foreign-born population - Portugal (%)
Place of birth for the foreign-born population - Spain (%)
Place of birth for the foreign-born population - Other Southern Europe (%)
Place of birth for the foreign-born population - Albania (%)
Place of birth for the foreign-born population - Belarus (%)
Place of birth for the foreign-born population - Bosnia and Herzegovina (%)
Place of birth for the foreign-born population - Bulgaria (%)
Place of birth for the foreign-born population - Croatia (%)
Place of birth for the foreign-born population - Czechoslovakia (%)
Place of birth for the foreign-born population - Hungary (%)
Place of birth for the foreign-born population - Latvia (%)
Place of birth for the foreign-born population - Lithuania (%)
Place of birth for the foreign-born population - North Macedonia (Macedonia) (%)
Place of birth for the foreign-born population - Moldova (%)
Place of birth for the foreign-born population - Poland (%)
Place of birth for the foreign-born population - Romania (%)
Place of birth for the foreign-born population - Russia (%)
Place of birth for the foreign-born population - Serbia (%)
Place of birth for the foreign-born population - Ukraine (%)
Place of birth for the foreign-born population - Other Eastern Europe (%)
Place of birth for the foreign-born population - China (%)
Place of birth for the foreign-born population - Hong Kong (%)
Place of birth for the foreign-born population - Taiwan (%)
Place of birth for the foreign-born population - Japan (%)
Place of birth for the foreign-born population - Korea (%)
Place of birth for the foreign-born population - Other Eastern Asia (%)
Place of birth for the foreign-born population - Afghanistan (%)
Place of birth for the foreign-born population - Bangladesh (%)
Place of birth for the foreign-born population - India (%)
Place of birth for the foreign-born population - Iran (%)
Place of birth for the foreign-born population - Kazakhstan (%)
Place of birth for the foreign-born population - Nepal (%)
Place of birth for the foreign-born population - Pakistan (%)
Place of birth for the foreign-born population - Sri Lanka (%)
Place of birth for the foreign-born population - Uzbekistan (%)
Place of birth for the foreign-born population - Other South Central Asia (%)
Place of birth for the foreign-born population - Burma (%)
Place of birth for the foreign-born population - Cambodia (%)
Place of birth for the foreign-born population - Indonesia (%)
Place of birth for the foreign-born population - Laos (%)
Place of birth for the foreign-born population - Malaysia (%)
Place of birth for the foreign-born population - Philippines (%)
Place of birth for the foreign-born population - Singapore (%)
Place of birth for the foreign-born population - Thailand (%)
Place of birth for the foreign-born population - Vietnam (%)
Place of birth for the foreign-born population - Other South Eastern Asia (%)
Place of birth for the foreign-born population - Armenia (%)
Place of birth for the foreign-born population - Iraq (%)
Place of birth for the foreign-born population - Israel (%)
Place of birth for the foreign-born population - Jordan (%)
Place of birth for the foreign-born population - Kuwait (%)
Place of birth for the foreign-born population - Lebanon (%)
Place of birth for the foreign-born population - Saudi Arabia (%)
Place of birth for the foreign-born population - Syria (%)
Place of birth for the foreign-born population - Turkey (%)
Place of birth for the foreign-born population - Yemen (%)
Place of birth for the foreign-born population - Other Western Asia (%)
Place of birth for the foreign-born population - Eritrea (%)
Place of birth for the foreign-born population - Ethiopia (%)
Place of birth for the foreign-born population - Kenya (%)
Place of birth for the foreign-born population - Somalia (%)
Place of birth for the foreign-born population - Uganda (%)
Place of birth for the foreign-born population - Zimbabwe (%)
Place of birth for the foreign-born population - Other Eastern Africa (%)
Place of birth for the foreign-born population - Cameroon (%)
Place of birth for the foreign-born population - Congo (%)
Place of birth for the foreign-born population - Democratic Republic of Congo (Zaire) (%)
Place of birth for the foreign-born population - Other Middle Africa (%)
Place of birth for the foreign-born population - Egypt (%)
Place of birth for the foreign-born population - Morocco (%)
Place of birth for the foreign-born population - Sudan (%)
Place of birth for the foreign-born population - Other Northern Africa (%)
Place of birth for the foreign-born population - South Africa (%)
Place of birth for the foreign-born population - Other Southern Africa (%)
Place of birth for the foreign-born population - Cabo Verde (%)
Place of birth for the foreign-born population - Ghana (%)
Place of birth for the foreign-born population - Liberia (%)
Place of birth for the foreign-born population - Nigeria (%)
Place of birth for the foreign-born population - Senegal (%)
Place of birth for the foreign-born population - Sierra Leone (%)
Place of birth for the foreign-born population - Other Western Africa (%)
Place of birth for the foreign-born population - Australia (%)
Place of birth for the foreign-born population - New Zealand (%)
Place of birth for the foreign-born population - Fiji (%)
Place of birth for the foreign-born population - Micronesia (%)
Place of birth for the foreign-born population - Bahamas (%)
Place of birth for the foreign-born population - Barbados (%)
Place of birth for the foreign-born population - Cuba (%)
Place of birth for the foreign-born population - Dominica (%)
Place of birth for the foreign-born population - Dominican Republic (%)
Place of birth for the foreign-born population - Grenada (%)
Place of birth for the foreign-born population - Haiti (%)
Place of birth for the foreign-born population - Jamaica (%)
Place of birth for the foreign-born population - St. Vincent and the Grenadines (%)
Place of birth for the foreign-born population - Trinidad and Tobago (%)
Place of birth for the foreign-born population - West Indies (%)
Place of birth for the foreign-born population - Other Caribbean (%)
Place of birth for the foreign-born population - Belize (%)
Place of birth for the foreign-born population - Costa Rica (%)
Place of birth for the foreign-born population - El Salvador (%)
Place of birth for the foreign-born population - Guatemala (%)
Place of birth for the foreign-born population - Honduras (%)
Place of birth for the foreign-born population - Mexico (%)
Place of birth for the foreign-born population - Nicaragua (%)
Place of birth for the foreign-born population - Panama (%)
Place of birth for the foreign-born population - Other Central America (%)
Place of birth for the foreign-born population - Argentina (%)
Place of birth for the foreign-born population - Bolivia (%)
Place of birth for the foreign-born population - Brazil (%)
Place of birth for the foreign-born population - Chile (%)
Place of birth for the foreign-born population - Colombia (%)
Place of birth for the foreign-born population - Ecuador (%)
Place of birth for the foreign-born population - Guyana (%)
Place of birth for the foreign-born population - Peru (%)
Place of birth for the foreign-born population - Uruguay (%)
Place of birth for the foreign-born population - Venezuela (%)
Place of birth for the foreign-born population - Other South America (%)
Place of birth for the foreign-born population - Canada (%)
Place of birth for the foreign-born population - Other Northern America (%)
Place of birth for the foreign-born population - Other (%)
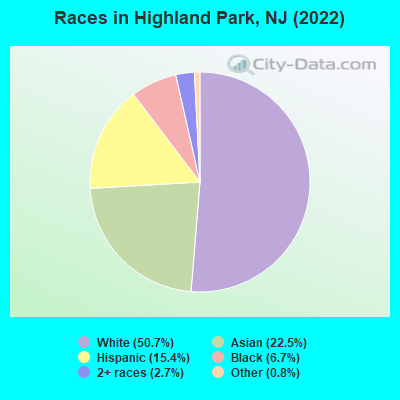
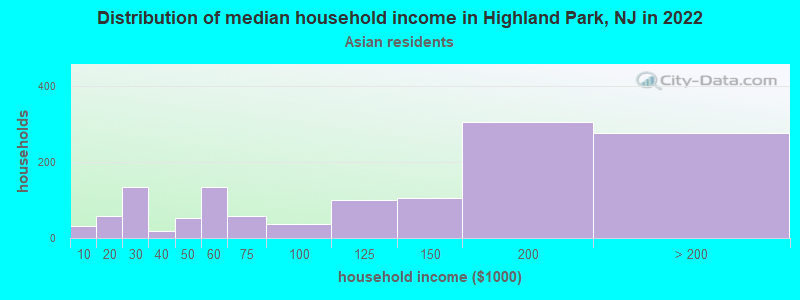
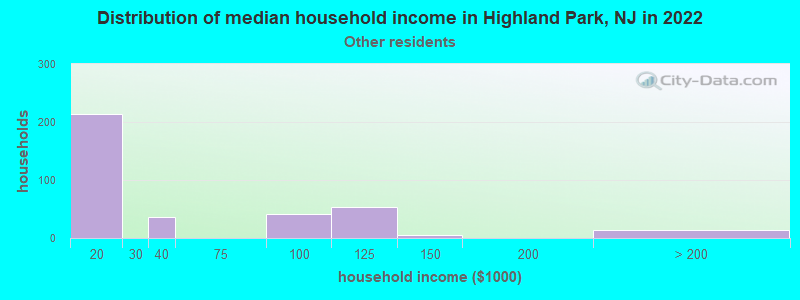
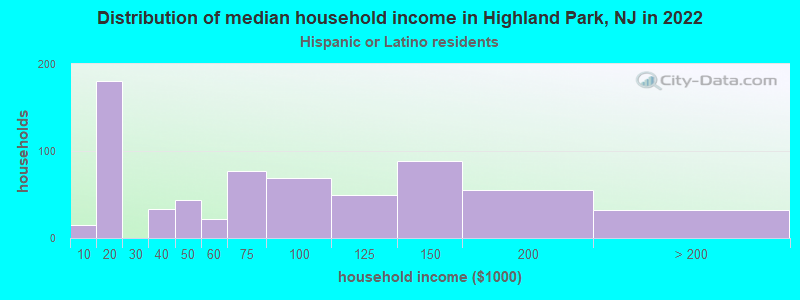
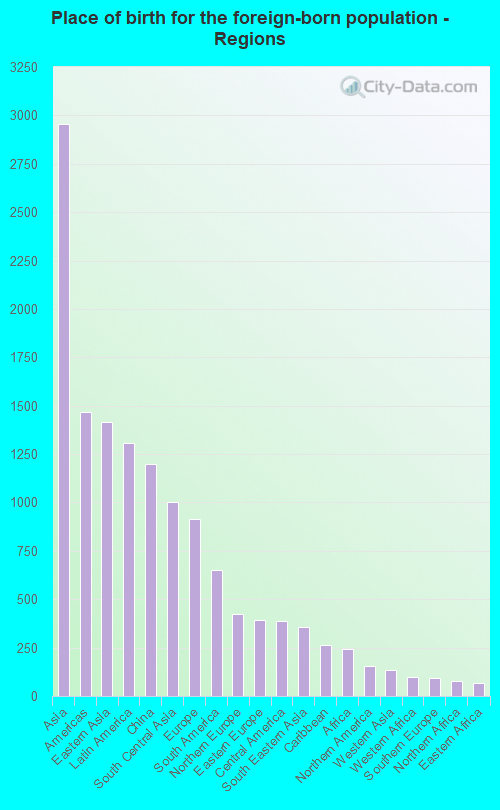
According to 2022 data, the most numerous races in Highland Park, NJ are White alone (7,607 residents), Hispanic (2,313 residents), and Black alone (1,012 residents). 57.9% of Highland Park residents speak English at home. 37.1% of Highland Park, NJ residents are foreign-born (19.4% born in Asia, 8.6% born in Latin America, 6.0% born in Europe), which is 38.1% greater than the foreign-born rate of 23.0% across the entire state of New Jersey.
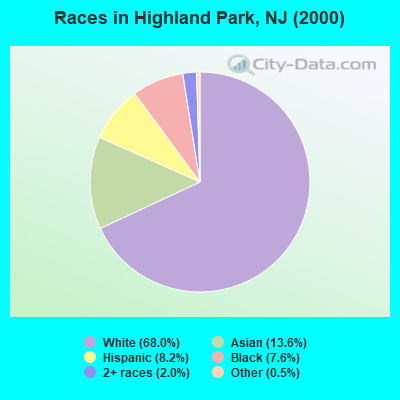
Race distribution in Highland Park
2000 2022
5,557,209 66.0% White alone 1,117,191 13.3% Hispanic 1,096,171 13.0% Black alone 477,012 5.7% Asian alone 133,689 1.6% Two or more races 19,565 0.2% Other race alone 11,338 0.1% American Indian alone 2,175 0.03% Native Hawaiian and Other
4,766,476 51.5% White alone 2,028,470 21.9% Hispanic 1,111,632 12.0% Black alone 923,546 10.0% Asian alone 332,237 3.6% Two or more races 89,847 1.0% Other race alone 8,557 0.09% American Indian alone 934 0.01% Native Hawaiian and Other
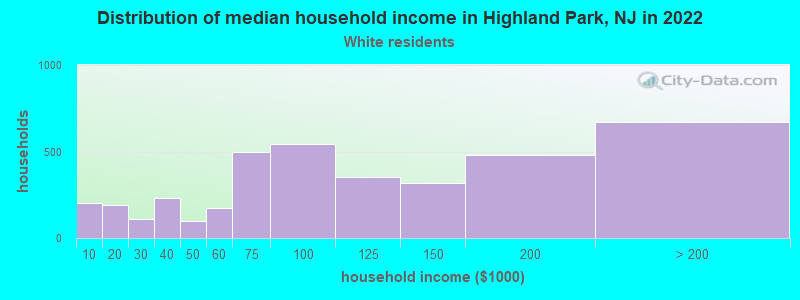
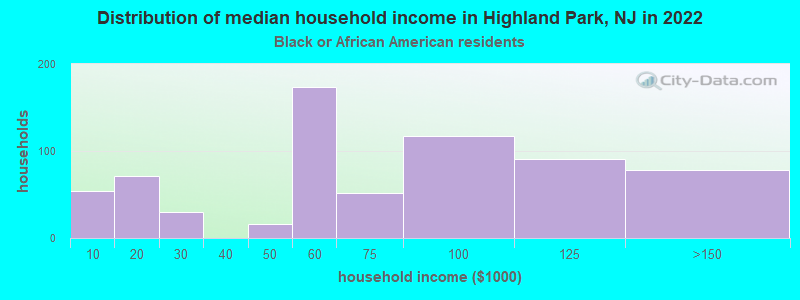
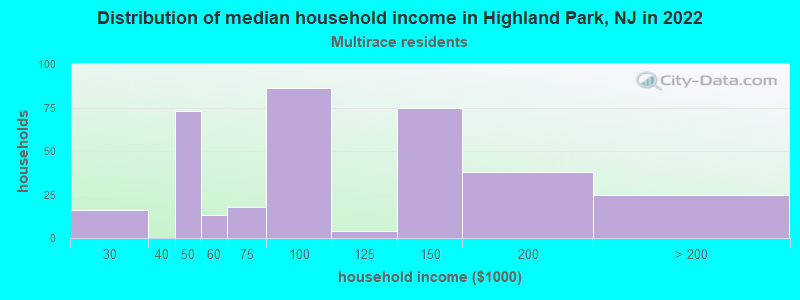
Income and house value in Highland Park Median household income in 2022 $91,014 White non-Hispanic householders$67,170 Black householders$124,980 Asian householders$78,246 Two or more races householders$66,953 Hispanic or Latino race householdersMedian 2022 house value $475,485 White Non-Hispanic householders$386,065 Black or African American householders $376,771 Asian householders$408,169 Some other race householders$305,436 Two or more races householders$450,116 Hispanic or Latino householders
Median age by race in Highland Park
36.9 Median age for White residents36.3 37.9 38.2 Median age for Black or African American residents39.6 26.7 48.6 Median age for American Indian / Alaska Native residents-624,624,624.0 -739,999,999.3 33.6 Median age for Asian residents34.0 33.2 -939,393,938.5 Median age for Native Hawaiian / Pacific Islander residents-860,335,194.7 -713,070,378.3 29.7 Median age for Other race residents44.5 29.2 44.2 Median age for Two or more races residents35.4 49.6 36.0 Median age for White alone residents35.3 37.9 33.1 Median age for Hispanic or Latino residents36.5 33.1
Owner/renter occupied households by race in Highland Park
House owners and renters - White residents 1,740 47.8% Owner occupied1,900 52.2% Renter occupiedHouse owners and renters - Black or African American residents 64 9.9% Owner occupied584 90.1% Renter occupiedHouse owners and renters - Asian residents 497 39.3% Owner occupied769 60.7% Renter occupiedHouse owners and renters - Other race residents 63 19.2% Owner occupied265 80.8% Renter occupiedHouse owners and renters - Two or more races residents 179 56.7% Owner occupied137 43.3% Renter occupiedHouse owners and renters - White alone residents 1,718 44.8% Owner occupied2,121 55.2% Renter occupiedHouse owners and renters - Hispanic or Latino residents 177 30.0% Owner occupied412 70.0% Renter occupied
Language usage in Highland Park
English speakers - Total 57.9% of residents of Highland Park speak English at home.
13.6% of residents speak Spanish at home 867 44.0% Speak English very well1,103 56.0% Speak English less than very well28.9% of residents speak other language at home 2,727 65.4% Speak English very well1,445 34.6% Speak English less than very well
English speakers - Born in the United States 84.6% of residents of Highland Park speak English at home.
5.4% of residents speak Spanish at home 208 93.7% Speak English very well14 6.3% Speak English less than very well10.1% of residents speak other language at home 393 94.7% Speak English very well22 5.3% Speak English less than very well
English speakers - Native, born elsewhere 38.6% of residents of Highland Park speak English at home.
32.7% of residents speak Spanish at home 23 41.1% Speak English very well33 58.9% Speak English less than very well30.4% of residents speak other language at home 52 100.0% Speak English very well
English speakers - Foreign-born 17.6% of residents of Highland Park speak English at home.
23.3% of residents speak Spanish at home 330 24.7% Speak English very well1,007 75.3% Speak English less than very well59.6% of residents speak other language at home 1,986 58.1% Speak English very well1,431 41.9% Speak English less than very well
White (Caucasian) - Speak only English Native:
94.5% (5,752)Foreign-born:
51.5% (578)
White (Caucasian) - Speak another language Native:
6.7% (405)Foreign-born:
59.0% (662)
Black or African American - Speak only English Native:
85.9% (750)Foreign-born:
26.6% (43)
Black or African American - Speak another language Native:
13.3% (116)Foreign-born:
79.4% (127)
Asian - Speak only English Native:
28.1% (158)Foreign-born:
8.4% (232)
Asian - Speak another language Native:
72.5% (407)Foreign-born:
91.5% (2,520)
Other race - Speak only English Native:
43.1% (127)Foreign-born:
6.1% (56)
Other race - Speak another language Native:
59.9% (177)Foreign-born:
93.4% (857)
Two or more races - Speak only English Native:
78.5% (471)Foreign-born:
11.4% (52)
Two or more races - Speak another language Native:
20.7% (124)Foreign-born:
88.7% (403)
White alone - Speak only English Native:
96.7% (5,773)Foreign-born:
46.3% (561)
White alone - Speak another language Native:
3.9% (235)Foreign-born:
55.9% (677)
Hispanic or Latino - Speak only English Native:
35.8% (310)Foreign-born:
11.1% (160)
Hispanic or Latino - Speak another language Native:
63.8% (552)Foreign-born:
90.2% (1,308)
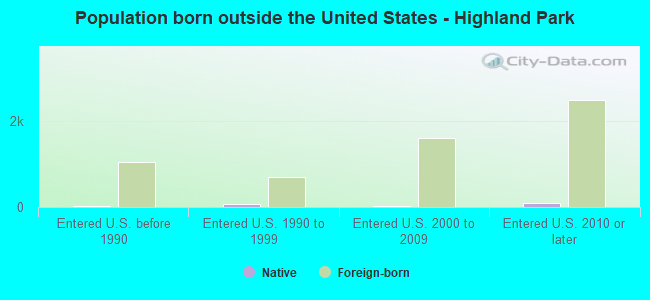
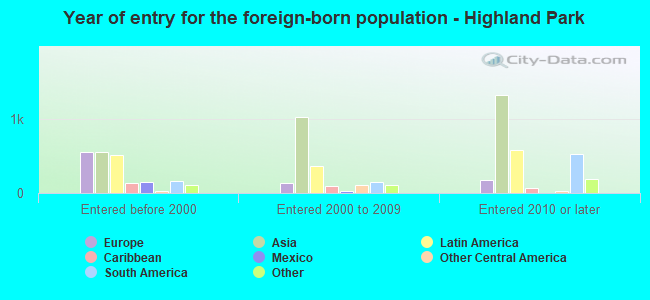
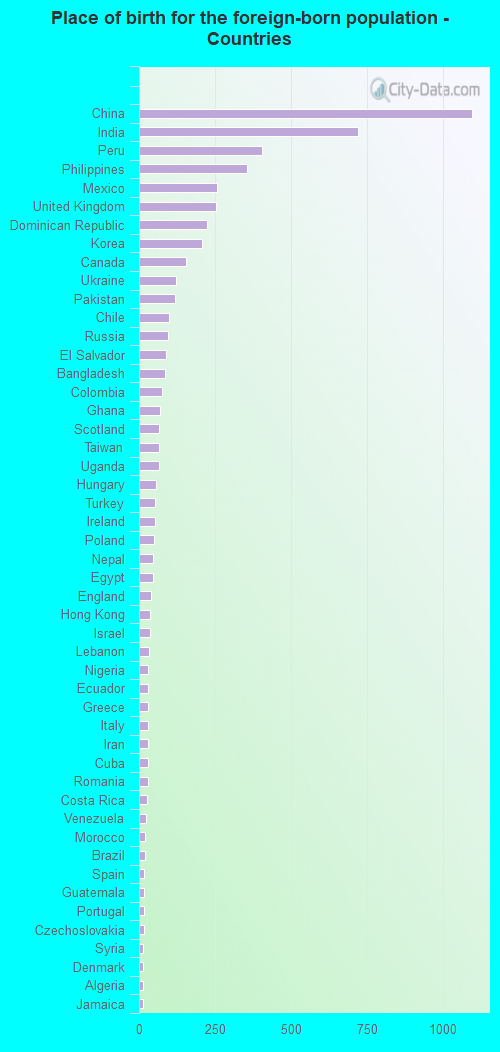
Foreign-born residents in Highland Park 5,576 residents are foreign born (19.4% Asia , 8.6% Latin America , 6.0% Europe ).
This city:
37.1%New Jersey:
23.2%
Marital status for residents in Highland Park Marital status - White (Caucasian) population 15 years and over
Males 34.8% Never married53.8% Now married1.1% Separated0.5% Widowed9.8% DivorcedFemales 41.2% Never married39.2% Now married0.8% Separated9.0% Widowed9.8% DivorcedWomen who gave birth in the past 12 months Now married:
100.0% (77)Unmarried:
0.0% (0)
Women who did not give birth in the past 12 months Now married:
27.0% (492)Unmarried:
73.0% (1,333)
Marital status - Black or African American population 15 years and over
Males 48.0% Never married11.9% Now married0.0% Separated5.8% Widowed34.3% DivorcedFemales 70.3% Never married8.9% Now married0.0% Separated11.1% Widowed9.7% DivorcedWomen who gave birth in the past 12 months Now married:
15.9% (21)Unmarried:
84.1% (112)
Women who did not give birth in the past 12 months Now married:
0.0% (0)Unmarried:
100.0% (255)
Marital status - American Indian / Alaska Native population 15 years and over
Males 100.0% Never married0.0% Now married0.0% Separated0.0% Widowed0.0% DivorcedFemales 80.0% Never married0.0% Now married0.0% Separated0.0% Widowed20.0% DivorcedWomen who did not give birth in the past 12 months Now married:
0.0% (0)Unmarried:
100.0% (62)
Marital status - Asian population 15 years and over
Males 45.0% Never married43.4% Now married0.0% Separated6.0% Widowed5.6% DivorcedFemales 42.1% Never married55.5% Now married0.0% Separated1.0% Widowed1.4% DivorcedWomen who gave birth in the past 12 months Now married:
100.0% (36)Unmarried:
0.0% (0)
Women who did not give birth in the past 12 months Now married:
45.2% (478)Unmarried:
54.8% (579)
Marital status - Other race population 15 years and over
Males 17.8% Never married49.4% Now married0.0% Separated11.7% Widowed21.1% DivorcedFemales 48.1% Never married40.2% Now married0.0% Separated0.0% Widowed11.7% DivorcedWomen who did not give birth in the past 12 months Now married:
25.6% (111)Unmarried:
74.4% (324)
Marital status - Two or more races population 15 years and over
Males 35.4% Never married54.0% Now married5.1% Separated0.0% Widowed5.5% DivorcedFemales 11.6% Never married70.9% Now married4.7% Separated5.6% Widowed7.1% DivorcedWomen who did not give birth in the past 12 months Now married:
76.4% (183)Unmarried:
23.6% (57)
Marital status - White alone, not Hispanic / Latino population 15 years and over
Males 33.7% Never married54.8% Now married1.2% Separated0.6% Widowed9.7% DivorcedFemales 40.2% Never married40.8% Now married0.9% Separated9.5% Widowed8.6% DivorcedWomen who gave birth in the past 12 months Now married:
100.0% (90)Unmarried:
0.0% (0)
Women who did not give birth in the past 12 months Now married:
28.8% (532)Unmarried:
71.2% (1,312)
Marital status - Hispanic or Latino population 15 years and over
Males 38.0% Never married47.8% Now married2.0% Separated0.0% Widowed12.1% DivorcedFemales 45.8% Never married33.8% Now married1.5% Separated4.0% Widowed14.8% DivorcedWomen who did not give birth in the past 12 months Now married:
18.1% (133)Unmarried:
81.9% (603)
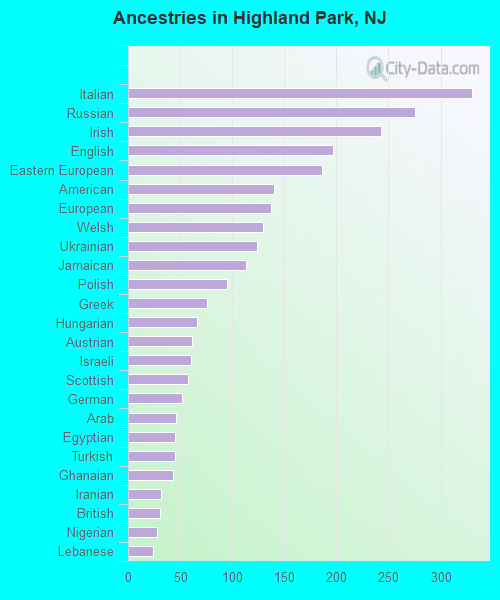
Ancestries in Highland Park
330 3.8% Italian275 3.2% Russian243 2.8% Irish197 2.3% English186 2.2% Eastern European140 1.6% American137 1.6% European130 1.5% Welsh124 1.4% Ukrainian113 1.3% Jamaican95 1.1% Polish76 0.9% Greek66 0.8% Hungarian61 0.7% Austrian60 0.7% Israeli58 0.7% Scottish52 0.6% German46 0.5% Arab45 0.5% Egyptian45 0.5% Turkish43 0.5% Ghanaian32 0.4% Iranian31 0.4% British28 0.3% Nigerian24 0.3% Lebanese20 0.2% Brazilian17 0.2% Romanian17 0.2% African16 0.2% Portuguese15 0.2% Czech13 0.2% Scotch-Irish12 0.1% Lithuanian11 0.1% Scandinavian11 0.1% Afghan10 0.1% French Canadian10 0.1% Slovak8 0.09% Iraqi8 0.09% Czechoslovakian7 0.08% Syrian7 0.08% Danish6 0.07% Moroccan
Children Nativity (place of birth) in Highland Park
Children under 6 years - Living with two parents Both parents native 422 100.0% NativeBoth parents foreign-born 14 23.4% Native45 76.6% Foreign-bornOne native, one foreign-born parent 119 100.0% NativeChildren under 6 years - Living with one parent Native parent 26 100.0% NativeForeign-born parent 104 88.6% Native13 11.4% Foreign-bornChildren 6 to 17 years - Living with two parents Both parents native 712 100.0% NativeBoth parents foreign-born 247 61.8% Native153 38.2% Foreign-bornOne native, one foreign-born parent 236 100.0% NativeChildren 6 to 17 years - Living with one parent Native parent 118 100.0% Foreign-bornForeign-born parent 379 69.6% Native165 30.4% Foreign-born
Grandparents responsible for own grandchildren in Highland Park
Grandparents (30 to 59 years) Black or African American 12 100.0% Responsible for grandchildrenHispanic or Latino 14 100.0% Responsible for grandchildren
Grandparents (60 years and over)