Races in Highland City, Florida (FL) Detailed Stats
Data:
Races - White alone (%)
Races - White alone (% change since 2000)
Races - Black alone (%)
Races - Black alone (% change since 2000)
Races - American Indian alone (%)
Races - American Indian alone (% change since 2000)
Races - Asian alone (%)
Races - Asian alone (% change since 2000)
Races - Hispanic (%)
Races - Hispanic (% change since 2000)
Races - Native Hawaiian and Other Pacific Islander alone (%)
Races - Native Hawaiian and Other Pacific Islander alone (% change since 2000)
Races - Two or more races(%)
Races - Two or more races(% change since 2000)
Races - Other race alone (%)
Races - Other race alone (% change since 2000)
Racial diversity
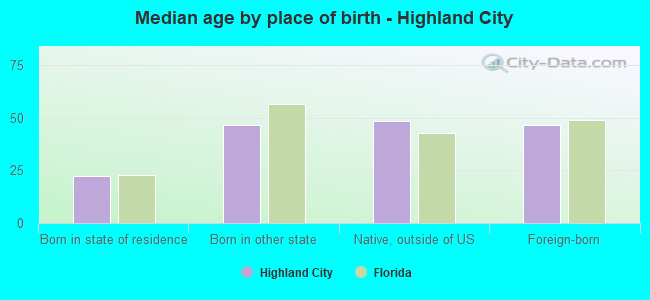
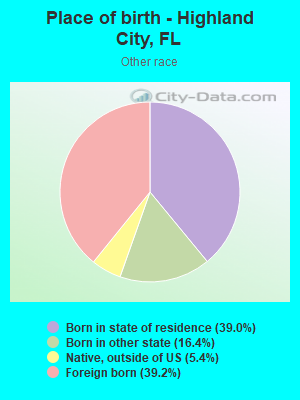
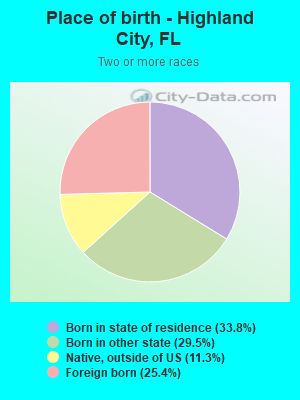
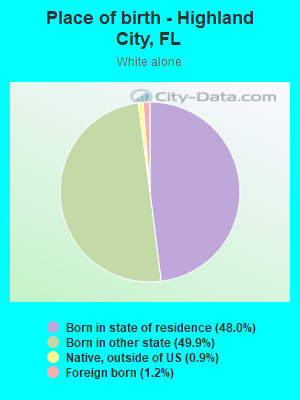
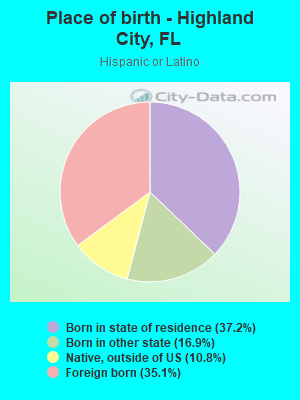
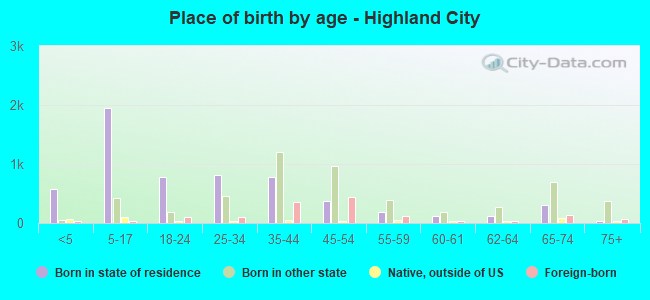
Place of birth - Born in state of residence (%)
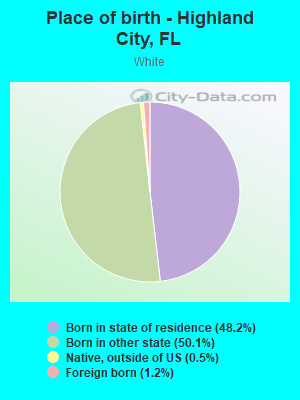
Place of birth - Born in state of residence (%) - White
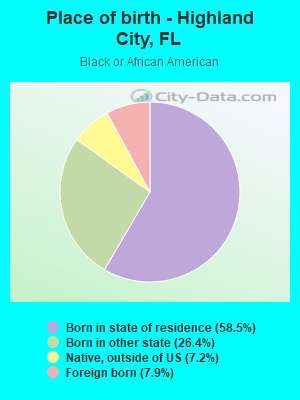
Place of birth - Born in state of residence (%) - Black or African American
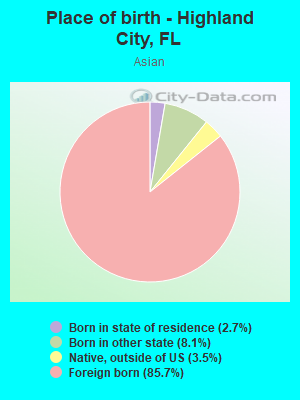
Place of birth - Born in state of residence (%) - Asian
Place of birth - Born in state of residence (%) - Hispanic or Latino
Place of birth - Born in state of residence (%) - American Indian and Alaska Native
Place of birth - Born in state of residence (%) - Multirace
Place of birth - Born in state of residence (%) - Other Race
Place of birth - Born in other state (%)
Place of birth - Born in other state (%) - White
Place of birth - Born in other state (%) - Black or African American
Place of birth - Born in other state (%) - Asian
Place of birth - Born in other state (%) - Hispanic or Latino
Place of birth - Born in other state (%) - American Indian and Alaska Native
Place of birth - Born in other state (%) - Multirace
Place of birth - Born in other state (%) - Other Race
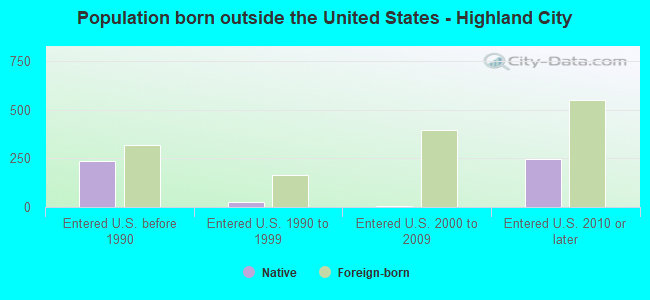
Place of birth - Native, outside of US (%)
Place of birth - Native, outside of US (%) - White
Place of birth - Native, outside of US (%) - Black or African American
Place of birth - Native, outside of US (%) - Asian
Place of birth - Native, outside of US (%) - Hispanic or Latino
Place of birth - Native, outside of US (%) - American Indian and Alaska Native
Place of birth - Native, outside of US (%) - Multirace
Place of birth - Native, outside of US (%) - Other Race
Place of birth - Foreign born (%)
Place of birth - Foreign born (%) - White
Place of birth - Foreign born (%) - Black or African American
Place of birth - Foreign born (%) - Asian
Place of birth - Foreign born (%) - Hispanic or Latino
Place of birth - Foreign born (%) - American Indian and Alaska Native
Place of birth - Foreign born (%) - Multirace
Place of birth - Foreign born (%) - Other Race
Residents speaking English at home (%)
Residents speaking English at home - Born in the United States (%)
Residents speaking English at home - Native, born elsewhere (%)
Residents speaking English at home - Foreign born (%)
Residents speaking Spanish at home (%)
Residents speaking Spanish at home - Born in the United States (%)
Residents speaking Spanish at home - Native, born elsewhere (%)
Residents speaking Spanish at home - Foreign born (%)
Residents speaking other language at home (%)
Residents speaking other language at home - Born in the United States (%)
Residents speaking other language at home - Native, born elsewhere (%)
Residents speaking other language at home - Foreign born (%)
Marital status - Never married (%)
Marital status - Now married (%)
Marital status - Separated (%)
Marital status - Widowed (%)
Marital status - Divorced (%)
Ancestries Reported - Arab (%)
Ancestries Reported - Czech (%)
Ancestries Reported - Danish (%)
Ancestries Reported - Dutch (%)
Ancestries Reported - English (%)
Ancestries Reported - French (%)
Ancestries Reported - French Canadian (%)
Ancestries Reported - German (%)
Ancestries Reported - Greek (%)
Ancestries Reported - Hungarian (%)
Ancestries Reported - Irish (%)
Ancestries Reported - Italian (%)
Ancestries Reported - Lithuanian (%)
Ancestries Reported - Norwegian (%)
Ancestries Reported - Polish (%)
Ancestries Reported - Portuguese (%)
Ancestries Reported - Russian (%)
Ancestries Reported - Scotch-Irish (%)
Ancestries Reported - Scottish (%)
Ancestries Reported - Slovak (%)
Ancestries Reported - Subsaharan African (%)
Ancestries Reported - Swedish (%)
Ancestries Reported - Swiss (%)
Ancestries Reported - Ukrainian (%)
Ancestries Reported - United States (%)
Ancestries Reported - Welsh (%)
Ancestries Reported - West Indian (%)
Ancestries Reported - Other (%)
Geographical mobility - Same house 1 year ago (%)
Geographical mobility - Same house 1 year ago (%) - White
Geographical mobility - Same house 1 year ago (%) - Black or African American
Geographical mobility - Same house 1 year ago (%) - Asian
Geographical mobility - Same house 1 year ago (%) - Hispanic or Latino
Geographical mobility - Same house 1 year ago (%) - American Indian and Alaska Native
Geographical mobility - Same house 1 year ago (%) - Multirace
Geographical mobility - Same house 1 year ago (%) - Other Race
Geographical mobility - Moved within same county (%)
Geographical mobility - Moved within same county (%) - White
Geographical mobility - Moved within same county (%) - Black or African American
Geographical mobility - Moved within same county (%) - Asian
Geographical mobility - Moved within same county (%) - Hispanic or Latino
Geographical mobility - Moved within same county (%) - American Indian and Alaska Native
Geographical mobility - Moved within same county (%) - Multirace
Geographical mobility - Moved within same county (%) - Other Race
Geographical mobility - Moved from different county within same state (%)
Geographical mobility - Moved from different county within same state (%) - White
Geographical mobility - Moved from different county within same state (%) - Black or African American
Geographical mobility - Moved from different county within same state (%) - Asian
Geographical mobility - Moved from different county within same state (%) - Hispanic or Latino
Geographical mobility - Moved from different county within same state (%) - American Indian and Alaska Native
Geographical mobility - Moved from different county within same state (%) - Multirace
Geographical mobility - Moved from different county within same state (%) - Other Race
Geographical mobility - Moved from different state (%)
Geographical mobility - Moved from different state (%) - White
Geographical mobility - Moved from different state (%) - Black or African American
Geographical mobility - Moved from different state (%) - Asian
Geographical mobility - Moved from different state (%) - Hispanic or Latino
Geographical mobility - Moved from different state (%) - American Indian and Alaska Native
Geographical mobility - Moved from different state (%) - Multirace
Geographical mobility - Moved from different state (%) - Other Race
Geographical mobility - Moved from abroad (%)
Geographical mobility - Moved from abroad (%) - White
Geographical mobility - Moved from abroad (%) - Black or African American
Geographical mobility - Moved from abroad (%) - Asian
Geographical mobility - Moved from abroad (%) - Hispanic or Latino
Geographical mobility - Moved from abroad (%) - American Indian and Alaska Native
Geographical mobility - Moved from abroad (%) - Multirace
Geographical mobility - Moved from abroad (%) - Other Race
Place of birth for the foreign-born population - Ireland (%)
Place of birth for the foreign-born population - Denmark (%)
Place of birth for the foreign-born population - Norway (%)
Place of birth for the foreign-born population - Sweden (%)
Place of birth for the foreign-born population - United Kingdom (%)
Place of birth for the foreign-born population - England (%)
Place of birth for the foreign-born population - Scotland (%)
Place of birth for the foreign-born population - Other Northern Europe (%)
Place of birth for the foreign-born population - Austria (%)
Place of birth for the foreign-born population - Belgium (%)
Place of birth for the foreign-born population - France (%)
Place of birth for the foreign-born population - Germany (%)
Place of birth for the foreign-born population - Netherlands (%)
Place of birth for the foreign-born population - Switzerland (%)
Place of birth for the foreign-born population - Other Western Europe (%)
Place of birth for the foreign-born population - Greece (%)
Place of birth for the foreign-born population - Italy (%)
Place of birth for the foreign-born population - Portugal (%)
Place of birth for the foreign-born population - Spain (%)
Place of birth for the foreign-born population - Other Southern Europe (%)
Place of birth for the foreign-born population - Albania (%)
Place of birth for the foreign-born population - Belarus (%)
Place of birth for the foreign-born population - Bosnia and Herzegovina (%)
Place of birth for the foreign-born population - Bulgaria (%)
Place of birth for the foreign-born population - Croatia (%)
Place of birth for the foreign-born population - Czechoslovakia (%)
Place of birth for the foreign-born population - Hungary (%)
Place of birth for the foreign-born population - Latvia (%)
Place of birth for the foreign-born population - Lithuania (%)
Place of birth for the foreign-born population - North Macedonia (Macedonia) (%)
Place of birth for the foreign-born population - Moldova (%)
Place of birth for the foreign-born population - Poland (%)
Place of birth for the foreign-born population - Romania (%)
Place of birth for the foreign-born population - Russia (%)
Place of birth for the foreign-born population - Serbia (%)
Place of birth for the foreign-born population - Ukraine (%)
Place of birth for the foreign-born population - Other Eastern Europe (%)
Place of birth for the foreign-born population - China (%)
Place of birth for the foreign-born population - Hong Kong (%)
Place of birth for the foreign-born population - Taiwan (%)
Place of birth for the foreign-born population - Japan (%)
Place of birth for the foreign-born population - Korea (%)
Place of birth for the foreign-born population - Other Eastern Asia (%)
Place of birth for the foreign-born population - Afghanistan (%)
Place of birth for the foreign-born population - Bangladesh (%)
Place of birth for the foreign-born population - India (%)
Place of birth for the foreign-born population - Iran (%)
Place of birth for the foreign-born population - Kazakhstan (%)
Place of birth for the foreign-born population - Nepal (%)
Place of birth for the foreign-born population - Pakistan (%)
Place of birth for the foreign-born population - Sri Lanka (%)
Place of birth for the foreign-born population - Uzbekistan (%)
Place of birth for the foreign-born population - Other South Central Asia (%)
Place of birth for the foreign-born population - Burma (%)
Place of birth for the foreign-born population - Cambodia (%)
Place of birth for the foreign-born population - Indonesia (%)
Place of birth for the foreign-born population - Laos (%)
Place of birth for the foreign-born population - Malaysia (%)
Place of birth for the foreign-born population - Philippines (%)
Place of birth for the foreign-born population - Singapore (%)
Place of birth for the foreign-born population - Thailand (%)
Place of birth for the foreign-born population - Vietnam (%)
Place of birth for the foreign-born population - Other South Eastern Asia (%)
Place of birth for the foreign-born population - Armenia (%)
Place of birth for the foreign-born population - Iraq (%)
Place of birth for the foreign-born population - Israel (%)
Place of birth for the foreign-born population - Jordan (%)
Place of birth for the foreign-born population - Kuwait (%)
Place of birth for the foreign-born population - Lebanon (%)
Place of birth for the foreign-born population - Saudi Arabia (%)
Place of birth for the foreign-born population - Syria (%)
Place of birth for the foreign-born population - Turkey (%)
Place of birth for the foreign-born population - Yemen (%)
Place of birth for the foreign-born population - Other Western Asia (%)
Place of birth for the foreign-born population - Eritrea (%)
Place of birth for the foreign-born population - Ethiopia (%)
Place of birth for the foreign-born population - Kenya (%)
Place of birth for the foreign-born population - Somalia (%)
Place of birth for the foreign-born population - Uganda (%)
Place of birth for the foreign-born population - Zimbabwe (%)
Place of birth for the foreign-born population - Other Eastern Africa (%)
Place of birth for the foreign-born population - Cameroon (%)
Place of birth for the foreign-born population - Congo (%)
Place of birth for the foreign-born population - Democratic Republic of Congo (Zaire) (%)
Place of birth for the foreign-born population - Other Middle Africa (%)
Place of birth for the foreign-born population - Egypt (%)
Place of birth for the foreign-born population - Morocco (%)
Place of birth for the foreign-born population - Sudan (%)
Place of birth for the foreign-born population - Other Northern Africa (%)
Place of birth for the foreign-born population - South Africa (%)
Place of birth for the foreign-born population - Other Southern Africa (%)
Place of birth for the foreign-born population - Cabo Verde (%)
Place of birth for the foreign-born population - Ghana (%)
Place of birth for the foreign-born population - Liberia (%)
Place of birth for the foreign-born population - Nigeria (%)
Place of birth for the foreign-born population - Senegal (%)
Place of birth for the foreign-born population - Sierra Leone (%)
Place of birth for the foreign-born population - Other Western Africa (%)
Place of birth for the foreign-born population - Australia (%)
Place of birth for the foreign-born population - New Zealand (%)
Place of birth for the foreign-born population - Fiji (%)
Place of birth for the foreign-born population - Micronesia (%)
Place of birth for the foreign-born population - Bahamas (%)
Place of birth for the foreign-born population - Barbados (%)
Place of birth for the foreign-born population - Cuba (%)
Place of birth for the foreign-born population - Dominica (%)
Place of birth for the foreign-born population - Dominican Republic (%)
Place of birth for the foreign-born population - Grenada (%)
Place of birth for the foreign-born population - Haiti (%)
Place of birth for the foreign-born population - Jamaica (%)
Place of birth for the foreign-born population - St. Vincent and the Grenadines (%)
Place of birth for the foreign-born population - Trinidad and Tobago (%)
Place of birth for the foreign-born population - West Indies (%)
Place of birth for the foreign-born population - Other Caribbean (%)
Place of birth for the foreign-born population - Belize (%)
Place of birth for the foreign-born population - Costa Rica (%)
Place of birth for the foreign-born population - El Salvador (%)
Place of birth for the foreign-born population - Guatemala (%)
Place of birth for the foreign-born population - Honduras (%)
Place of birth for the foreign-born population - Mexico (%)
Place of birth for the foreign-born population - Nicaragua (%)
Place of birth for the foreign-born population - Panama (%)
Place of birth for the foreign-born population - Other Central America (%)
Place of birth for the foreign-born population - Argentina (%)
Place of birth for the foreign-born population - Bolivia (%)
Place of birth for the foreign-born population - Brazil (%)
Place of birth for the foreign-born population - Chile (%)
Place of birth for the foreign-born population - Colombia (%)
Place of birth for the foreign-born population - Ecuador (%)
Place of birth for the foreign-born population - Guyana (%)
Place of birth for the foreign-born population - Peru (%)
Place of birth for the foreign-born population - Uruguay (%)
Place of birth for the foreign-born population - Venezuela (%)
Place of birth for the foreign-born population - Other South America (%)
Place of birth for the foreign-born population - Canada (%)
Place of birth for the foreign-born population - Other Northern America (%)
Place of birth for the foreign-born population - Other (%)
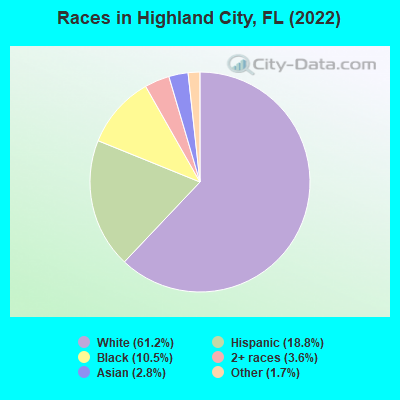
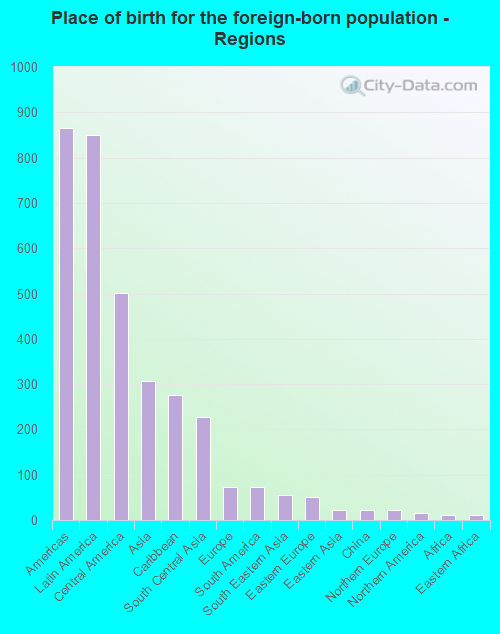
According to 2022 data, the most numerous races in Highland City, FL are White alone (8,159 residents), Hispanic (2,507 residents), and Black alone (1,401 residents). 82.0% of Highland City residents speak English at home. 9.4% of Highland City, FL residents are foreign-born (6.5% born in Latin America, 2.3% born in Asia), which is 122.6% less than the foreign-born rate of 21.0% across the entire state of Florida.
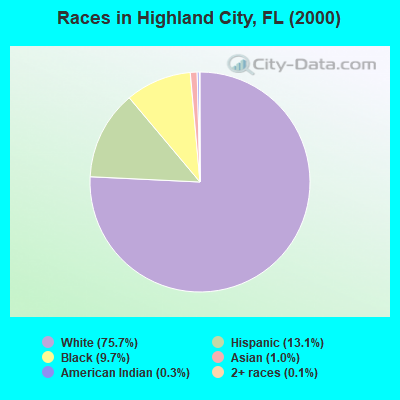
Race distribution in Highland City
2000 2022
10,458,509 65.4% White alone 2,682,715 16.8% Hispanic 2,264,268 14.2% Black alone 261,693 1.6% Asian alone 236,954 1.5% Two or more races 42,358 0.3% American Indian alone 28,994 0.2% Other race alone 6,887 0.04% Native Hawaiian and Other
11,309,403 50.8% White alone 6,025,039 27.1% Hispanic 3,241,015 14.6% Black alone 861,630 3.9% Two or more races 623,692 2.8% Asian alone 152,054 0.7% Other race alone 22,504 0.1% American Indian alone 9,486 0.04% Native Hawaiian and Other
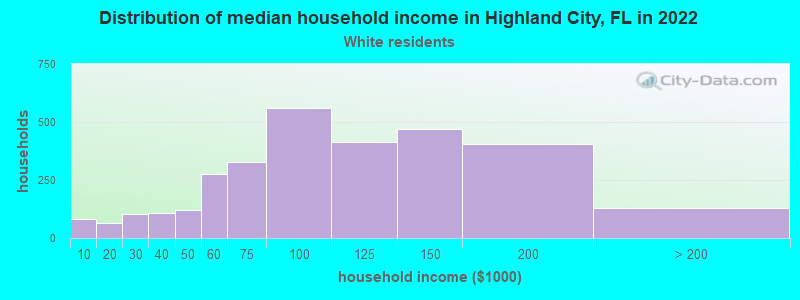
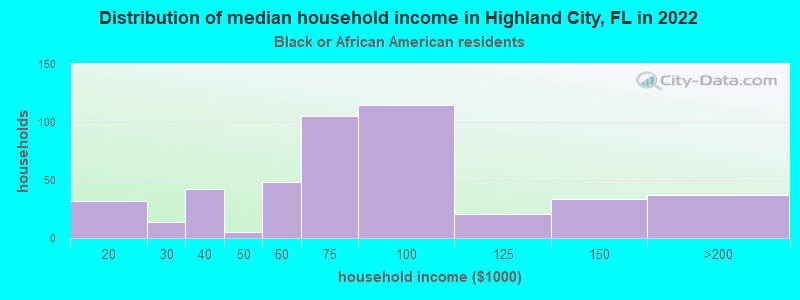
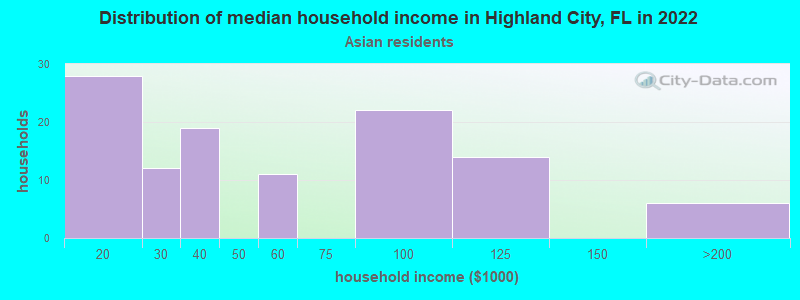
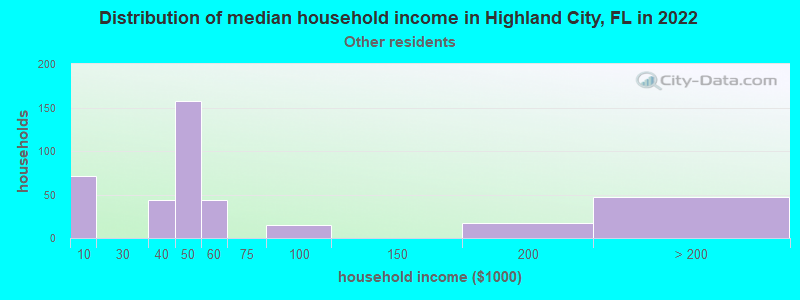
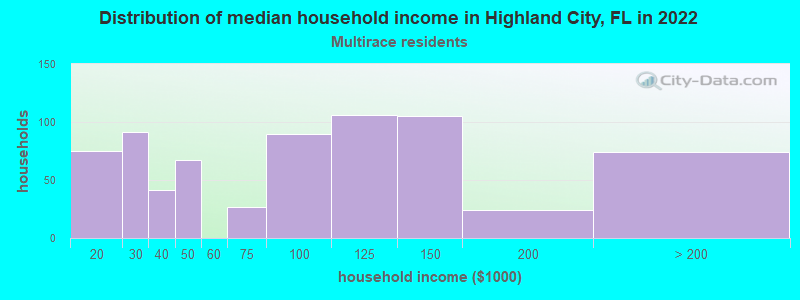
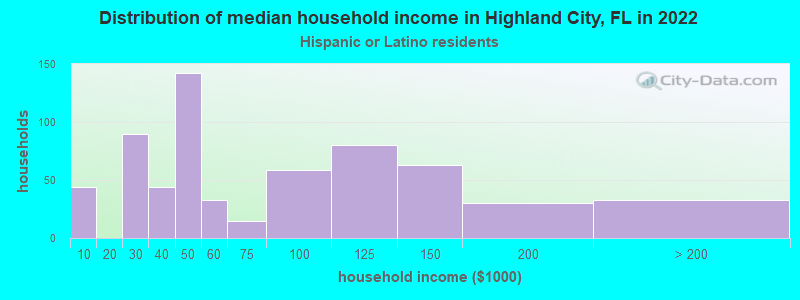
Income and house value in Highland City Median household income in 2022 $95,980 White non-Hispanic householders$68,107 Black householders$46,046 Some other race householders$98,411 Two or more races householders$51,301 Hispanic or Latino race householdersMedian 2022 house value $333,700 White Non-Hispanic householders$401,082 Black or African American householders$735,317 American Indian or Alaska Native householders$347,604 Some other race householders$347,604 Two or more races householders$367,926 Hispanic or Latino householders
Median age by race in Highland City
40.3 Median age for White residents39.8 41.1 29.6 Median age for Black or African American residents24.2 30.1 -898,856,639.4 Median age for American Indian / Alaska Native residents-899,908,171.7 -834,555,826.4 52.5 Median age for Asian residents51.3 46.0 -679,849,340.2 Median age for Native Hawaiian / Pacific Islander residents-858,307,848.3 -443,298,968.6 40.0 Median age for Other race residents19.5 40.9 38.3 Median age for Two or more races residents47.5 31.4 38.6 Median age for White alone residents38.3 39.0 40.0 Median age for Hispanic or Latino residents37.4 39.9
Owner/renter occupied households by race in Highland City
House owners and renters - White residents 2,402 81.6% Owner occupied541 18.4% Renter occupiedHouse owners and renters - Black or African American residents 400 80.6% Owner occupied96 19.4% Renter occupiedHouse owners and renters - Asian residents 79 82.5% Owner occupied17 17.5% Renter occupiedHouse owners and renters - Other race residents 444 95.1% Owner occupied23 4.9% Renter occupiedHouse owners and renters - Two or more races residents 474 70.5% Owner occupied198 29.5% Renter occupiedHouse owners and renters - White alone residents 2,437 79.8% Owner occupied615 20.2% Renter occupiedHouse owners and renters - Hispanic or Latino residents 601 88.2% Owner occupied81 11.8% Renter occupied
Language usage in Highland City
English speakers - Total 82.0% of residents of Highland City speak English at home.
12.3% of residents speak Spanish at home 859 55.3% Speak English very well695 44.7% Speak English less than very well4.2% of residents speak other language at home 256 48.2% Speak English very well275 51.8% Speak English less than very well
English speakers - Born in the United States 97.3% of residents of Highland City speak English at home.
2.7% of residents speak Spanish at home 141 100.0% Speak English very well0.3% of residents speak other language at home 18 100.0% Speak English very well
English speakers - Native, born elsewhere 44.3% of residents of Highland City speak English at home.
52.1% of residents speak Spanish at home 171 77.4% Speak English very well50 22.6% Speak English less than very well9.0% of residents speak other language at home 38 100.0% Speak English very well
English speakers - Foreign-born 7.4% of residents of Highland City speak English at home.
61.1% of residents speak Spanish at home 198 22.7% Speak English very well674 77.3% Speak English less than very well33.6% of residents speak other language at home 180 37.5% Speak English very well300 62.5% Speak English less than very well
White (Caucasian) - Speak only English Native:
100.0% (7,328)Foreign-born:
91.0% (76)
White (Caucasian) - Speak another language Native:
0.9% (63)Foreign-born:
34.2% (29)
Asian - Speak only English Native:
62.2% (29)Foreign-born:
5.5% (17)
Asian - Speak another language Native:
37.4% (17)Foreign-born:
96.9% (301)
Other race - Speak another language Native:
44.1% (368)Foreign-born:
100.0% (576)
Two or more races - Speak another language Native:
30.7% (496)Foreign-born:
93.7% (514)
White alone - Speak only English Native:
99.3% (7,591)Foreign-born:
94.4% (83)
White alone - Speak another language Native:
0.8% (58)Foreign-born:
15.1% (13)
Hispanic or Latino - Speak another language Native:
45.4% (666)Foreign-born:
99.3% (854)
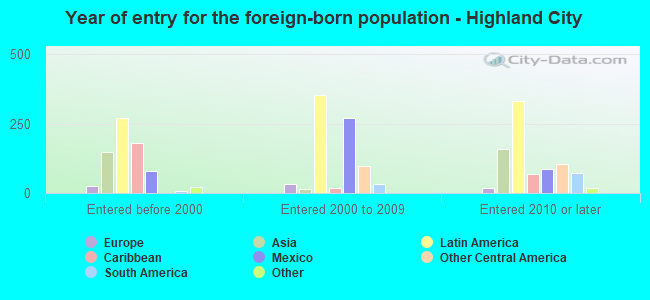
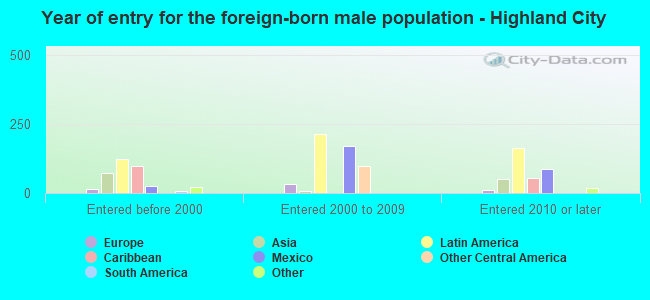
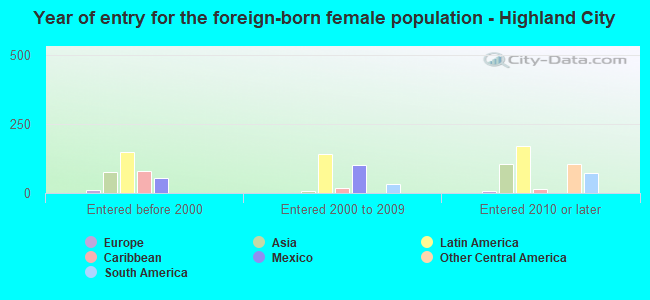
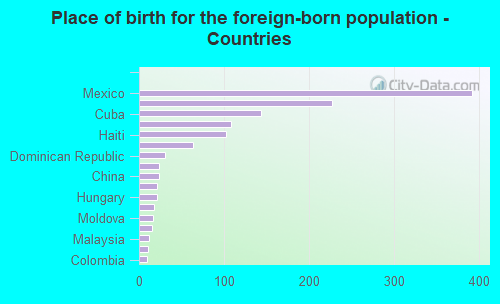
Foreign-born residents in Highland City 1,257 residents are foreign born (6.5% Latin America , 2.3% Asia ).
This city:
9.4%Florida:
21.1%
Marital status for residents in Highland City Marital status - White (Caucasian) population 15 years and over
Males 32.0% Never married48.6% Now married0.0% Separated1.6% Widowed17.9% DivorcedFemales 25.7% Never married59.4% Now married1.6% Separated2.3% Widowed11.0% DivorcedWomen who gave birth in the past 12 months Now married:
33.3% (25)Unmarried:
66.7% (50)
Women who did not give birth in the past 12 months Now married:
54.5% (842)Unmarried:
45.5% (702)
Marital status - Black or African American population 15 years and over
Males 42.7% Never married46.3% Now married0.0% Separated0.0% Widowed11.0% DivorcedFemales 56.7% Never married38.3% Now married0.0% Separated0.0% Widowed5.1% DivorcedWomen who gave birth in the past 12 months Now married:
100.0% (21)Unmarried:
0.0% (0)
Women who did not give birth in the past 12 months Now married:
23.7% (118)Unmarried:
76.3% (379)
Marital status - Asian population 15 years and over
Males 11.9% Never married88.1% Now married0.0% Separated0.0% Widowed0.0% DivorcedFemales 31.8% Never married52.7% Now married0.0% Separated15.4% Widowed0.0% DivorcedWomen who did not give birth in the past 12 months Now married:
48.0% (61)Unmarried:
52.0% (66)
Marital status - Other race population 15 years and over
Males 35.3% Never married64.7% Now married0.0% Separated0.0% Widowed0.0% DivorcedFemales 28.4% Never married47.8% Now married0.0% Separated5.7% Widowed18.2% DivorcedWomen who did not give birth in the past 12 months Now married:
71.8% (215)Unmarried:
28.2% (85)
Marital status - Two or more races population 15 years and over
Males 43.7% Never married47.4% Now married1.0% Separated0.0% Widowed7.9% DivorcedFemales 20.2% Never married53.8% Now married0.0% Separated17.1% Widowed8.9% DivorcedWomen who gave birth in the past 12 months Now married:
100.0% (15)Unmarried:
0.0% (0)
Women who did not give birth in the past 12 months Now married:
46.4% (191)Unmarried:
53.6% (221)
Marital status - White alone, not Hispanic / Latino population 15 years and over
Males 31.9% Never married48.1% Now married0.0% Separated1.6% Widowed18.4% DivorcedFemales 25.8% Never married59.5% Now married1.7% Separated2.4% Widowed10.6% DivorcedWomen who gave birth in the past 12 months Now married:
30.3% (20)Unmarried:
69.7% (46)
Women who did not give birth in the past 12 months Now married:
54.5% (942)Unmarried:
45.5% (788)
Marital status - Hispanic or Latino population 15 years and over
Males 41.0% Never married56.9% Now married0.0% Separated0.0% Widowed2.1% DivorcedFemales 17.8% Never married61.1% Now married0.0% Separated7.1% Widowed14.0% DivorcedWomen who gave birth in the past 12 months Now married:
42.9% (11)Unmarried:
57.1% (14)
Women who did not give birth in the past 12 months Now married:
60.0% (275)Unmarried:
40.0% (183)
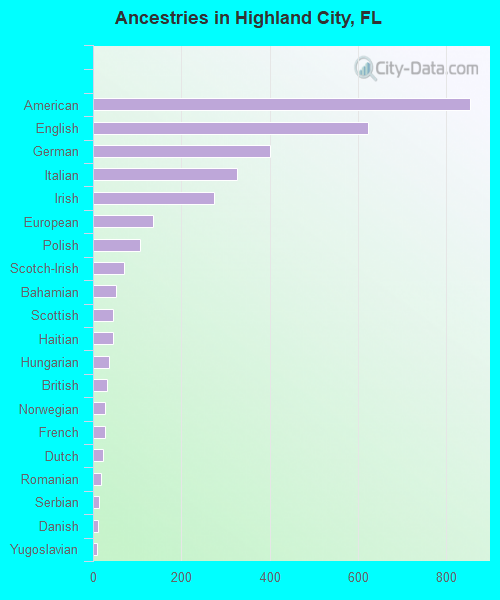
Ancestries in Highland City
854 13.5% American622 9.8% English400 6.3% German327 5.2% Italian273 4.3% Irish136 2.1% European106 1.7% Polish70 1.1% Scotch-Irish51 0.8% Bahamian45 0.7% Scottish45 0.7% Haitian37 0.6% Hungarian32 0.5% British28 0.4% Norwegian27 0.4% French22 0.3% Dutch17 0.3% Romanian14 0.2% Serbian12 0.2% Danish9 0.1% Yugoslavian
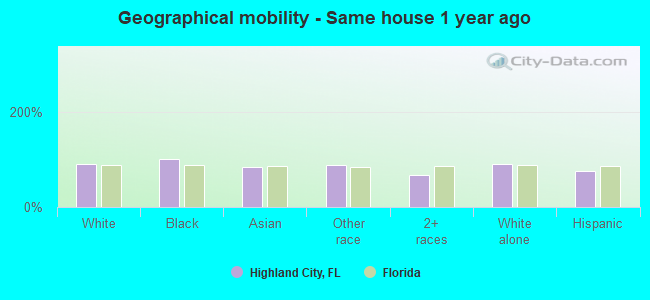
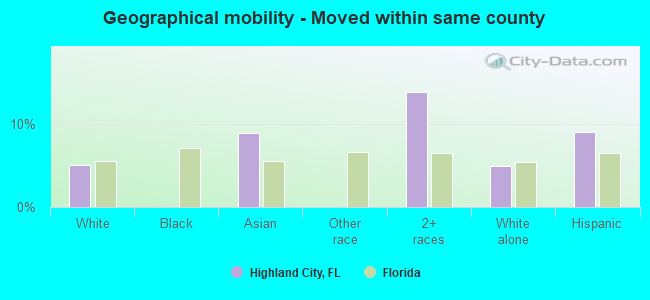
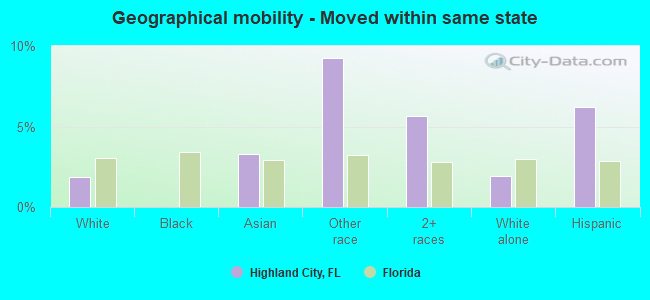
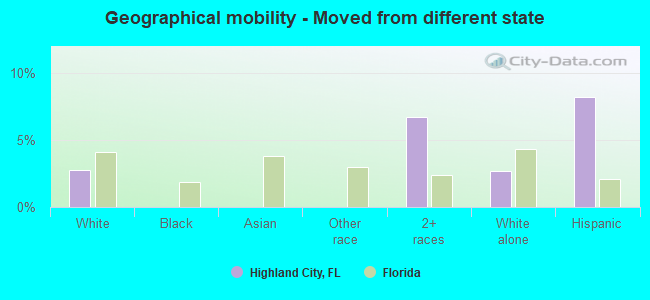
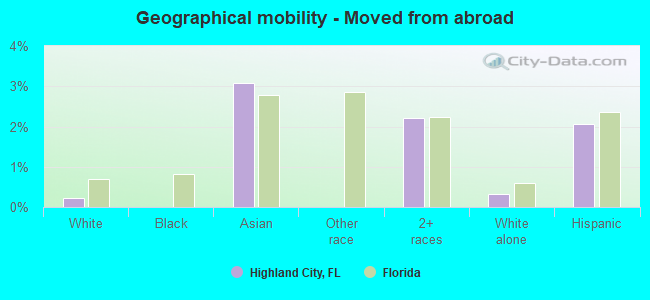
Geographical mobility in Highland City Same house 1 year ago 6,930 90.3% White (Caucasian)1,434 100.0% Black or African American305 84.0% Asian1,393 87.8% Other race1,458 67.3% Two or more races7,346 90.3% White alone, not Hispanic / Latino1,854 74.8% Hispanic or LatinoMoved within same county 390 5.1% White / Caucasian1 0.0% Black or African American33 9.0% Asian301 13.9% Two or more races409 5.0% White alone, not Hispanic / Latino224 9.0% Hispanic or LatinoMoved within same state 143 1.9% White / Caucasian12 3.3% Asian146 9.2% Other race122 5.7% Two or more races156 1.9% White alone, not Hispanic / Latino154 6.2% Hispanic or LatinoMoved from different state 211 2.7% White / Caucasian146 6.7% Two or more races219 2.7% White alone, not Hispanic / Latino203 8.2% Hispanic or LatinoMoved from abroad 17 0.2% White11 3.1% Asian48 2.2% Two or more races26 0.3% White alone, not Hispanic / Latino51 2.1% Hispanic or Latino
Children Nativity (place of birth) in Highland City
Children under 6 years - Living with two parents Both parents native 289 100.0% NativeBoth parents foreign-born 155 100.0% NativeOne native, one foreign-born parent 64 100.0% NativeChildren under 6 years - Living with one parent Native parent 220 100.0% NativeForeign-born parent 17 100.0% NativeChildren 6 to 17 years - Living with two parents Both parents native 1,374 100.0% NativeBoth parents foreign-born 189 100.0% NativeOne native, one foreign-born parent 120 100.0% NativeChildren 6 to 17 years - Living with one parent Native parent 459 100.0% NativeForeign-born parent 48 53.4% Native42 46.6% Foreign-born
Grandparents responsible for own grandchildren in Highland City
Grandparents (30 to 59 years) White / Caucasian 10 17.1% Responsible for grandchildren50 82.9% Not responsible for grandchildrenBlack or African American 17 100.0% Not responsible for grandchildrenTwo or more races 47 100.0% Not responsible for grandchildrenWhite alone, not Hispanic / Latino 12 16.5% Responsible for grandchildren61 83.5% Not responsible for grandchildrenHispanic or Latino 62 100.0% Not responsible for grandchildrenGrandparents (60 years and over) White / Caucasian 51 26.4% Responsible for grandchildren143 73.6% Not responsible for grandchildrenBlack or African American 30 100.0% Responsible for grandchildrenTwo or more races 10 100.0% Not responsible for grandchildrenWhite alone, not Hispanic / Latino 60 28.8% Responsible for grandchildren148 71.2% Not responsible for grandchildrenHispanic or Latino 18 100.0% Not responsible for grandchildren