Races in Herriman, Utah (UT) Detailed Stats
Data:
Races - White alone (%)
Races - White alone (% change since 2000)
Races - Black alone (%)
Races - Black alone (% change since 2000)
Races - American Indian alone (%)
Races - American Indian alone (% change since 2000)
Races - Asian alone (%)
Races - Asian alone (% change since 2000)
Races - Hispanic (%)
Races - Hispanic (% change since 2000)
Races - Native Hawaiian and Other Pacific Islander alone (%)
Races - Native Hawaiian and Other Pacific Islander alone (% change since 2000)
Races - Two or more races(%)
Races - Two or more races(% change since 2000)
Races - Other race alone (%)
Races - Other race alone (% change since 2000)
Racial diversity
Place of birth - Born in state of residence (%)
Place of birth - Born in state of residence (%) - White
Place of birth - Born in state of residence (%) - Black or African American
Place of birth - Born in state of residence (%) - Asian
Place of birth - Born in state of residence (%) - Hispanic or Latino
Place of birth - Born in state of residence (%) - American Indian and Alaska Native
Place of birth - Born in state of residence (%) - Multirace
Place of birth - Born in state of residence (%) - Other Race
Place of birth - Born in other state (%)
Place of birth - Born in other state (%) - White
Place of birth - Born in other state (%) - Black or African American
Place of birth - Born in other state (%) - Asian
Place of birth - Born in other state (%) - Hispanic or Latino
Place of birth - Born in other state (%) - American Indian and Alaska Native
Place of birth - Born in other state (%) - Multirace
Place of birth - Born in other state (%) - Other Race
Place of birth - Native, outside of US (%)
Place of birth - Native, outside of US (%) - White
Place of birth - Native, outside of US (%) - Black or African American
Place of birth - Native, outside of US (%) - Asian
Place of birth - Native, outside of US (%) - Hispanic or Latino
Place of birth - Native, outside of US (%) - American Indian and Alaska Native
Place of birth - Native, outside of US (%) - Multirace
Place of birth - Native, outside of US (%) - Other Race
Place of birth - Foreign born (%)
Place of birth - Foreign born (%) - White
Place of birth - Foreign born (%) - Black or African American
Place of birth - Foreign born (%) - Asian
Place of birth - Foreign born (%) - Hispanic or Latino
Place of birth - Foreign born (%) - American Indian and Alaska Native
Place of birth - Foreign born (%) - Multirace
Place of birth - Foreign born (%) - Other Race
Residents speaking English at home (%)
Residents speaking English at home - Born in the United States (%)
Residents speaking English at home - Native, born elsewhere (%)
Residents speaking English at home - Foreign born (%)
Residents speaking Spanish at home (%)
Residents speaking Spanish at home - Born in the United States (%)
Residents speaking Spanish at home - Native, born elsewhere (%)
Residents speaking Spanish at home - Foreign born (%)
Residents speaking other language at home (%)
Residents speaking other language at home - Born in the United States (%)
Residents speaking other language at home - Native, born elsewhere (%)
Residents speaking other language at home - Foreign born (%)
Marital status - Never married (%)
Marital status - Now married (%)
Marital status - Separated (%)
Marital status - Widowed (%)
Marital status - Divorced (%)
Ancestries Reported - Arab (%)
Ancestries Reported - Czech (%)
Ancestries Reported - Danish (%)
Ancestries Reported - Dutch (%)
Ancestries Reported - English (%)
Ancestries Reported - French (%)
Ancestries Reported - French Canadian (%)
Ancestries Reported - German (%)
Ancestries Reported - Greek (%)
Ancestries Reported - Hungarian (%)
Ancestries Reported - Irish (%)
Ancestries Reported - Italian (%)
Ancestries Reported - Lithuanian (%)
Ancestries Reported - Norwegian (%)
Ancestries Reported - Polish (%)
Ancestries Reported - Portuguese (%)
Ancestries Reported - Russian (%)
Ancestries Reported - Scotch-Irish (%)
Ancestries Reported - Scottish (%)
Ancestries Reported - Slovak (%)
Ancestries Reported - Subsaharan African (%)
Ancestries Reported - Swedish (%)
Ancestries Reported - Swiss (%)
Ancestries Reported - Ukrainian (%)
Ancestries Reported - United States (%)
Ancestries Reported - Welsh (%)
Ancestries Reported - West Indian (%)
Ancestries Reported - Other (%)
Geographical mobility - Same house 1 year ago (%)
Geographical mobility - Same house 1 year ago (%) - White
Geographical mobility - Same house 1 year ago (%) - Black or African American
Geographical mobility - Same house 1 year ago (%) - Asian
Geographical mobility - Same house 1 year ago (%) - Hispanic or Latino
Geographical mobility - Same house 1 year ago (%) - American Indian and Alaska Native
Geographical mobility - Same house 1 year ago (%) - Multirace
Geographical mobility - Same house 1 year ago (%) - Other Race
Geographical mobility - Moved within same county (%)
Geographical mobility - Moved within same county (%) - White
Geographical mobility - Moved within same county (%) - Black or African American
Geographical mobility - Moved within same county (%) - Asian
Geographical mobility - Moved within same county (%) - Hispanic or Latino
Geographical mobility - Moved within same county (%) - American Indian and Alaska Native
Geographical mobility - Moved within same county (%) - Multirace
Geographical mobility - Moved within same county (%) - Other Race
Geographical mobility - Moved from different county within same state (%)
Geographical mobility - Moved from different county within same state (%) - White
Geographical mobility - Moved from different county within same state (%) - Black or African American
Geographical mobility - Moved from different county within same state (%) - Asian
Geographical mobility - Moved from different county within same state (%) - Hispanic or Latino
Geographical mobility - Moved from different county within same state (%) - American Indian and Alaska Native
Geographical mobility - Moved from different county within same state (%) - Multirace
Geographical mobility - Moved from different county within same state (%) - Other Race
Geographical mobility - Moved from different state (%)
Geographical mobility - Moved from different state (%) - White
Geographical mobility - Moved from different state (%) - Black or African American
Geographical mobility - Moved from different state (%) - Asian
Geographical mobility - Moved from different state (%) - Hispanic or Latino
Geographical mobility - Moved from different state (%) - American Indian and Alaska Native
Geographical mobility - Moved from different state (%) - Multirace
Geographical mobility - Moved from different state (%) - Other Race
Geographical mobility - Moved from abroad (%)
Geographical mobility - Moved from abroad (%) - White
Geographical mobility - Moved from abroad (%) - Black or African American
Geographical mobility - Moved from abroad (%) - Asian
Geographical mobility - Moved from abroad (%) - Hispanic or Latino
Geographical mobility - Moved from abroad (%) - American Indian and Alaska Native
Geographical mobility - Moved from abroad (%) - Multirace
Geographical mobility - Moved from abroad (%) - Other Race
Place of birth for the foreign-born population - Ireland (%)
Place of birth for the foreign-born population - Denmark (%)
Place of birth for the foreign-born population - Norway (%)
Place of birth for the foreign-born population - Sweden (%)
Place of birth for the foreign-born population - United Kingdom (%)
Place of birth for the foreign-born population - England (%)
Place of birth for the foreign-born population - Scotland (%)
Place of birth for the foreign-born population - Other Northern Europe (%)
Place of birth for the foreign-born population - Austria (%)
Place of birth for the foreign-born population - Belgium (%)
Place of birth for the foreign-born population - France (%)
Place of birth for the foreign-born population - Germany (%)
Place of birth for the foreign-born population - Netherlands (%)
Place of birth for the foreign-born population - Switzerland (%)
Place of birth for the foreign-born population - Other Western Europe (%)
Place of birth for the foreign-born population - Greece (%)
Place of birth for the foreign-born population - Italy (%)
Place of birth for the foreign-born population - Portugal (%)
Place of birth for the foreign-born population - Spain (%)
Place of birth for the foreign-born population - Other Southern Europe (%)
Place of birth for the foreign-born population - Albania (%)
Place of birth for the foreign-born population - Belarus (%)
Place of birth for the foreign-born population - Bosnia and Herzegovina (%)
Place of birth for the foreign-born population - Bulgaria (%)
Place of birth for the foreign-born population - Croatia (%)
Place of birth for the foreign-born population - Czechoslovakia (%)
Place of birth for the foreign-born population - Hungary (%)
Place of birth for the foreign-born population - Latvia (%)
Place of birth for the foreign-born population - Lithuania (%)
Place of birth for the foreign-born population - North Macedonia (Macedonia) (%)
Place of birth for the foreign-born population - Moldova (%)
Place of birth for the foreign-born population - Poland (%)
Place of birth for the foreign-born population - Romania (%)
Place of birth for the foreign-born population - Russia (%)
Place of birth for the foreign-born population - Serbia (%)
Place of birth for the foreign-born population - Ukraine (%)
Place of birth for the foreign-born population - Other Eastern Europe (%)
Place of birth for the foreign-born population - China (%)
Place of birth for the foreign-born population - Hong Kong (%)
Place of birth for the foreign-born population - Taiwan (%)
Place of birth for the foreign-born population - Japan (%)
Place of birth for the foreign-born population - Korea (%)
Place of birth for the foreign-born population - Other Eastern Asia (%)
Place of birth for the foreign-born population - Afghanistan (%)
Place of birth for the foreign-born population - Bangladesh (%)
Place of birth for the foreign-born population - India (%)
Place of birth for the foreign-born population - Iran (%)
Place of birth for the foreign-born population - Kazakhstan (%)
Place of birth for the foreign-born population - Nepal (%)
Place of birth for the foreign-born population - Pakistan (%)
Place of birth for the foreign-born population - Sri Lanka (%)
Place of birth for the foreign-born population - Uzbekistan (%)
Place of birth for the foreign-born population - Other South Central Asia (%)
Place of birth for the foreign-born population - Burma (%)
Place of birth for the foreign-born population - Cambodia (%)
Place of birth for the foreign-born population - Indonesia (%)
Place of birth for the foreign-born population - Laos (%)
Place of birth for the foreign-born population - Malaysia (%)
Place of birth for the foreign-born population - Philippines (%)
Place of birth for the foreign-born population - Singapore (%)
Place of birth for the foreign-born population - Thailand (%)
Place of birth for the foreign-born population - Vietnam (%)
Place of birth for the foreign-born population - Other South Eastern Asia (%)
Place of birth for the foreign-born population - Armenia (%)
Place of birth for the foreign-born population - Iraq (%)
Place of birth for the foreign-born population - Israel (%)
Place of birth for the foreign-born population - Jordan (%)
Place of birth for the foreign-born population - Kuwait (%)
Place of birth for the foreign-born population - Lebanon (%)
Place of birth for the foreign-born population - Saudi Arabia (%)
Place of birth for the foreign-born population - Syria (%)
Place of birth for the foreign-born population - Turkey (%)
Place of birth for the foreign-born population - Yemen (%)
Place of birth for the foreign-born population - Other Western Asia (%)
Place of birth for the foreign-born population - Eritrea (%)
Place of birth for the foreign-born population - Ethiopia (%)
Place of birth for the foreign-born population - Kenya (%)
Place of birth for the foreign-born population - Somalia (%)
Place of birth for the foreign-born population - Uganda (%)
Place of birth for the foreign-born population - Zimbabwe (%)
Place of birth for the foreign-born population - Other Eastern Africa (%)
Place of birth for the foreign-born population - Cameroon (%)
Place of birth for the foreign-born population - Congo (%)
Place of birth for the foreign-born population - Democratic Republic of Congo (Zaire) (%)
Place of birth for the foreign-born population - Other Middle Africa (%)
Place of birth for the foreign-born population - Egypt (%)
Place of birth for the foreign-born population - Morocco (%)
Place of birth for the foreign-born population - Sudan (%)
Place of birth for the foreign-born population - Other Northern Africa (%)
Place of birth for the foreign-born population - South Africa (%)
Place of birth for the foreign-born population - Other Southern Africa (%)
Place of birth for the foreign-born population - Cabo Verde (%)
Place of birth for the foreign-born population - Ghana (%)
Place of birth for the foreign-born population - Liberia (%)
Place of birth for the foreign-born population - Nigeria (%)
Place of birth for the foreign-born population - Senegal (%)
Place of birth for the foreign-born population - Sierra Leone (%)
Place of birth for the foreign-born population - Other Western Africa (%)
Place of birth for the foreign-born population - Australia (%)
Place of birth for the foreign-born population - New Zealand (%)
Place of birth for the foreign-born population - Fiji (%)
Place of birth for the foreign-born population - Micronesia (%)
Place of birth for the foreign-born population - Bahamas (%)
Place of birth for the foreign-born population - Barbados (%)
Place of birth for the foreign-born population - Cuba (%)
Place of birth for the foreign-born population - Dominica (%)
Place of birth for the foreign-born population - Dominican Republic (%)
Place of birth for the foreign-born population - Grenada (%)
Place of birth for the foreign-born population - Haiti (%)
Place of birth for the foreign-born population - Jamaica (%)
Place of birth for the foreign-born population - St. Vincent and the Grenadines (%)
Place of birth for the foreign-born population - Trinidad and Tobago (%)
Place of birth for the foreign-born population - West Indies (%)
Place of birth for the foreign-born population - Other Caribbean (%)
Place of birth for the foreign-born population - Belize (%)
Place of birth for the foreign-born population - Costa Rica (%)
Place of birth for the foreign-born population - El Salvador (%)
Place of birth for the foreign-born population - Guatemala (%)
Place of birth for the foreign-born population - Honduras (%)
Place of birth for the foreign-born population - Mexico (%)
Place of birth for the foreign-born population - Nicaragua (%)
Place of birth for the foreign-born population - Panama (%)
Place of birth for the foreign-born population - Other Central America (%)
Place of birth for the foreign-born population - Argentina (%)
Place of birth for the foreign-born population - Bolivia (%)
Place of birth for the foreign-born population - Brazil (%)
Place of birth for the foreign-born population - Chile (%)
Place of birth for the foreign-born population - Colombia (%)
Place of birth for the foreign-born population - Ecuador (%)
Place of birth for the foreign-born population - Guyana (%)
Place of birth for the foreign-born population - Peru (%)
Place of birth for the foreign-born population - Uruguay (%)
Place of birth for the foreign-born population - Venezuela (%)
Place of birth for the foreign-born population - Other South America (%)
Place of birth for the foreign-born population - Canada (%)
Place of birth for the foreign-born population - Other Northern America (%)
Place of birth for the foreign-born population - Other (%)
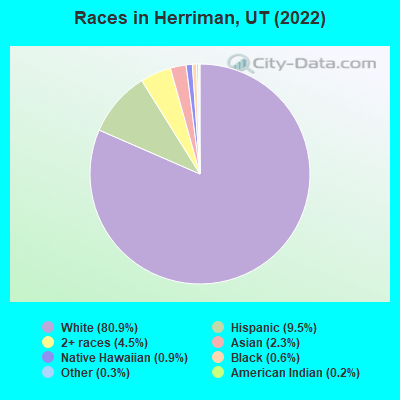
According to 2022 data, the most numerous races in Herriman, UT are White alone (44,977 residents), Hispanic (5,284 residents), and Two or more races (2,477 residents). 91.9% of Herriman residents speak English at home. 7.0% of Herriman, UT residents are foreign-born (2.7% born in Latin America, 2.1% born in Asia, 0.8% born in Oceania), which is 13.7% less than the foreign-born rate of 8.0% across the entire state of Utah.
Race distribution in Herriman
2000 2022
1,904,265 85.3% White alone 201,559 9.0% Hispanic 36,483 1.6% Asian alone 31,308 1.4% Two or more races 26,663 1.2% American Indian alone 14,806 0.7% Native Hawaiian and Other 16,137 0.7% Black alone 1,948 0.09% Other race alone
2,557,466 75.6% White alone 512,086 15.1% Hispanic 119,308 3.5% Two or more races 82,388 2.4% Asian alone 36,978 1.1% Native Hawaiian and Other 34,873 1.0% Black alone 22,803 0.7% American Indian alone 14,898 0.4% Other race alone
Income and house value in Herriman Median household income in 2022 $119,722 White non-Hispanic householders$64,325 Asian householders$73,776 Some other race householders$123,664 Two or more races householders$98,420 Hispanic or Latino race householdersMedian 2022 house value $589,539 White Non-Hispanic householders$536,695 Native Hawaiian and other Pacific Islander householders
Median age by race in Herriman
29.7 Median age for White residents28.8 30.2 18.1 Median age for Black or African American residents14.3 44.1 34.3 Median age for American Indian / Alaska Native residents35.1 -660,587,638.7 38.6 Median age for Asian residents40.7 38.3 36.3 Median age for Native Hawaiian / Pacific Islander residents34.9 25.0 27.0 Median age for Other race residents32.6 23.6 19.8 Median age for Two or more races residents18.8 24.7 29.6 Median age for White alone residents28.6 30.4 25.3 Median age for Hispanic or Latino residents27.0 20.7
Owner/renter occupied households by race in Herriman
House owners and renters - White residents 11,576 83.0% Owner occupied2,364 17.0% Renter occupiedHouse owners and renters - Black or African American residents 27 25.6% Owner occupied79 74.4% Renter occupiedHouse owners and renters - American Indian / Alaska Native residents 87 100.0% Owner occupiedHouse owners and renters - Asian residents 189 45.5% Owner occupied227 54.5% Renter occupiedHouse owners and renters - Native Hawaiian / Pacific Islander residents 146 100.0% Owner occupiedHouse owners and renters - Other race residents 143 56.4% Owner occupied110 43.6% Renter occupiedHouse owners and renters - Two or more races residents 1,455 83.0% Owner occupied297 17.0% Renter occupiedHouse owners and renters - White alone residents 11,602 82.7% Owner occupied2,426 17.3% Renter occupiedHouse owners and renters - Hispanic or Latino residents 1,002 71.8% Owner occupied393 28.2% Renter occupied
Language usage in Herriman
English speakers - Total 91.9% of residents of Herriman speak English at home.
4.2% of residents speak Spanish at home 1,397 66.1% Speak English very well718 33.9% Speak English less than very well3.3% of residents speak other language at home 1,210 74.1% Speak English very well423 25.9% Speak English less than very well
English speakers - Born in the United States 96.6% of residents of Herriman speak English at home.
2.4% of residents speak Spanish at home 271 78.8% Speak English very well73 21.2% Speak English less than very well0.8% of residents speak other language at home 68 60.7% Speak English very well44 39.3% Speak English less than very well
English speakers - Native, born elsewhere 72.4% of residents of Herriman speak English at home.
14.9% of residents speak Spanish at home 41 100.0% Speak English very well2.5% of residents speak other language at home 7 100.0% Speak English less than very well
English speakers - Foreign-born 47.1% of residents of Herriman speak English at home.
27.5% of residents speak Spanish at home 477 45.0% Speak English very well584 55.0% Speak English less than very well25.4% of residents speak other language at home 694 70.8% Speak English very well286 29.2% Speak English less than very well
White (Caucasian) - Speak only English Native:
98.0% (39,423)Foreign-born:
73.0% (412)
White (Caucasian) - Speak another language Native:
2.4% (964)Foreign-born:
36.3% (205)
Black or African American - Speak only English Native:
85.0% (276)Foreign-born:
100.0% (31)
Asian - Speak only English Native:
67.7% (148)Foreign-born:
39.7% (473)
Asian - Speak another language Native:
28.3% (62)Foreign-born:
63.7% (759)
Native Hawaiian / Pacific Islander - Speak only English Native:
87.0% (131)Foreign-born:
66.9% (284)
Other race - Speak only English Native:
65.6% (380)Foreign-born:
74.7% (244)
Other race - Speak another language Native:
25.7% (149)Foreign-born:
54.6% (179)
Two or more races - Speak only English Native:
93.2% (4,074)Foreign-born:
16.6% (276)
Two or more races - Speak another language Native:
6.6% (287)Foreign-born:
77.6% (1,294)
White alone - Speak only English Native:
97.2% (39,488)Foreign-born:
67.6% (409)
White alone - Speak another language Native:
2.8% (1,123)Foreign-born:
28.7% (173)
Hispanic or Latino - Speak only English Native:
85.1% (2,042)Foreign-born:
37.0% (591)
Hispanic or Latino - Speak another language Native:
17.2% (413)Foreign-born:
69.8% (1,114)
Foreign-born residents in Herriman 3,911 residents are foreign born (2.7% Latin America , 2.1% Asia , 0.8% Oceania ).
Marital status for residents in Herriman Marital status - White (Caucasian) population 15 years and over
Males 25.9% Never married68.8% Now married0.4% Separated1.6% Widowed3.3% DivorcedFemales 26.2% Never married59.4% Now married1.2% Separated4.0% Widowed9.1% DivorcedWomen who gave birth in the past 12 months Now married:
97.7% (771)Unmarried:
2.3% (18)
Women who did not give birth in the past 12 months Now married:
56.9% (7,206)Unmarried:
43.1% (5,458)
Marital status - Black or African American population 15 years and over
Males 73.2% Never married26.8% Now married0.0% Separated0.0% Widowed0.0% DivorcedFemales 78.9% Never married21.1% Now married0.0% Separated0.0% Widowed0.0% DivorcedWomen who did not give birth in the past 12 months Now married:
0.0% (0)Unmarried:
100.0% (82)
Marital status - Asian population 15 years and over
Males 58.8% Never married41.2% Now married0.0% Separated0.0% Widowed0.0% DivorcedFemales 22.7% Never married62.2% Now married0.0% Separated13.8% Widowed1.3% DivorcedWomen who did not give birth in the past 12 months Now married:
72.8% (471)Unmarried:
27.2% (176)
Marital status - Native Hawaiian / Pacific Islander population 15 years and over
Males 41.7% Never married36.9% Now married0.0% Separated21.4% Widowed0.0% DivorcedFemales 47.8% Never married52.2% Now married0.0% Separated0.0% Widowed0.0% DivorcedWomen who did not give birth in the past 12 months Now married:
0.0% (0)Unmarried:
100.0% (13)
Marital status - Other race population 15 years and over
Males 32.8% Never married67.2% Now married0.0% Separated0.0% Widowed0.0% DivorcedFemales 26.8% Never married67.8% Now married0.0% Separated5.4% Widowed0.0% DivorcedWomen who gave birth in the past 12 months Now married:
57.4% (28)Unmarried:
42.6% (21)
Women who did not give birth in the past 12 months Now married:
67.5% (147)Unmarried:
32.5% (71)
Marital status - Two or more races population 15 years and over
Males 30.8% Never married67.9% Now married0.0% Separated0.0% Widowed1.3% DivorcedFemales 27.9% Never married68.8% Now married0.4% Separated0.0% Widowed2.9% DivorcedWomen who gave birth in the past 12 months Now married:
100.0% (93)Unmarried:
0.0% (0)
Women who did not give birth in the past 12 months Now married:
68.1% (940)Unmarried:
31.9% (440)
Marital status - White alone, not Hispanic / Latino population 15 years and over
Males 25.6% Never married69.2% Now married0.4% Separated1.6% Widowed3.2% DivorcedFemales 26.4% Never married59.1% Now married1.3% Separated4.1% Widowed9.1% DivorcedWomen who gave birth in the past 12 months Now married:
97.5% (748)Unmarried:
2.5% (19)
Women who did not give birth in the past 12 months Now married:
56.7% (7,270)Unmarried:
43.3% (5,550)
Marital status - Hispanic or Latino population 15 years and over
Males 29.5% Never married69.3% Now married0.0% Separated0.0% Widowed1.2% DivorcedFemales 19.4% Never married75.9% Now married0.4% Separated0.0% Widowed4.3% DivorcedWomen who gave birth in the past 12 months Now married:
87.4% (145)Unmarried:
12.6% (21)
Women who did not give birth in the past 12 months Now married:
76.8% (615)Unmarried:
23.2% (185)
Ancestries in Herriman
9,690 37.8% English2,140 8.4% European1,685 6.6% American1,546 6.0% German1,492 5.8% Irish468 1.8% Swedish442 1.7% British400 1.6% Danish371 1.4% Italian313 1.2% Scotch-Irish269 1.1% Belgian263 1.0% Norwegian261 1.0% Scandinavian242 0.9% Scottish192 0.7% Welsh108 0.4% French Canadian101 0.4% Polish100 0.4% Portuguese60 0.2% Dutch57 0.2% Jamaican52 0.2% Northern European51 0.2% French39 0.2% Austrian27 0.1% Guyanese27 0.1% African25 0.10% Hungarian20 0.08% Greek19 0.07% Swiss12 0.05% Yugoslavian10 0.04% Croatian
Geographical mobility in Herriman Same house 1 year ago 38,888 89.5% White (Caucasian)381 100.0% Black or African American115 100.0% American Indian / Alaska Native1,134 80.3% Asian434 73.1% Native Hawaiian / Pacific Islander823 81.7% Other race6,356 85.2% Two or more races39,815 90.0% White alone, not Hispanic / Latino4,279 84.1% Hispanic or LatinoMoved within same county 2,633 6.1% White / Caucasian7 2.0% Black or African American132 9.3% Asian60 6.0% Other race728 9.8% Two or more races2,616 5.9% White alone, not Hispanic / Latino655 12.9% Hispanic or LatinoMoved within same state 832 1.9% White / Caucasian11 1.8% Native Hawaiian / Pacific Islander157 15.6% Other race55 0.7% Two or more races774 1.7% White alone, not Hispanic / Latino55 1.1% Hispanic or LatinoMoved from different state 1,106 2.5% White / Caucasian249 3.3% Two or more races1,108 2.5% White alone, not Hispanic / Latino19 0.4% Hispanic or LatinoMoved from abroad 20 0.0% White139 9.8% Asian71 12.0% Native Hawaiian / Pacific Islander36 0.7% Hispanic or Latino
Children Nativity (place of birth) in Herriman
Children under 6 years - Living with two parents Both parents native 4,549 100.0% NativeBoth parents foreign-born 79 100.0% NativeOne native, one foreign-born parent 782 100.0% NativeChildren under 6 years - Living with one parent Native parent 478 100.0% NativeForeign-born parent 31 100.0% NativeChildren 6 to 17 years - Living with two parents Both parents native 10,100 99.6% Native44 0.4% Foreign-bornBoth parents foreign-born 136 44.7% Native168 55.3% Foreign-bornOne native, one foreign-born parent 865 100.0% NativeChildren 6 to 17 years - Living with one parent Native parent 1,485 87.6% Native210 12.4% Foreign-bornForeign-born parent 146 100.0% Native
Grandparents responsible for own grandchildren in Herriman
Grandparents (30 to 59 years) White / Caucasian 17 8.5% Responsible for grandchildren186 91.5% Not responsible for grandchildrenBlack or African American 20 100.0% Responsible for grandchildrenTwo or more races 193 100.0% Not responsible for grandchildrenWhite alone, not Hispanic / Latino 21 9.4% Responsible for grandchildren203 90.6% Not responsible for grandchildrenHispanic or Latino 186 100.0% Not responsible for grandchildrenGrandparents (60 years and over) White / Caucasian 69 14.0% Responsible for grandchildren422 86.0% Not responsible for grandchildrenTwo or more races 224 100.0% Not responsible for grandchildrenWhite alone, not Hispanic / Latino 69 13.4% Responsible for grandchildren449 86.6% Not responsible for grandchildrenHispanic or Latino 41 21.7% Responsible for grandchildren150 78.3% Not responsible for grandchildren