Races in Hazleton, Pennsylvania (PA) Detailed Stats
Data:
Races - White alone (%)
Races - White alone (% change since 2000)
Races - Black alone (%)
Races - Black alone (% change since 2000)
Races - American Indian alone (%)
Races - American Indian alone (% change since 2000)
Races - Asian alone (%)
Races - Asian alone (% change since 2000)
Races - Hispanic (%)
Races - Hispanic (% change since 2000)
Races - Native Hawaiian and Other Pacific Islander alone (%)
Races - Native Hawaiian and Other Pacific Islander alone (% change since 2000)
Races - Two or more races(%)
Races - Two or more races(% change since 2000)
Races - Other race alone (%)
Races - Other race alone (% change since 2000)
Racial diversity
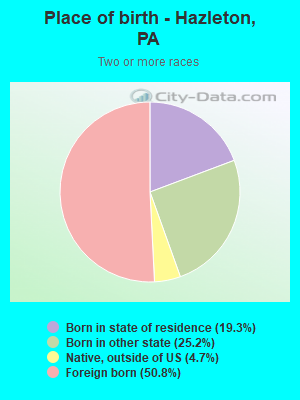
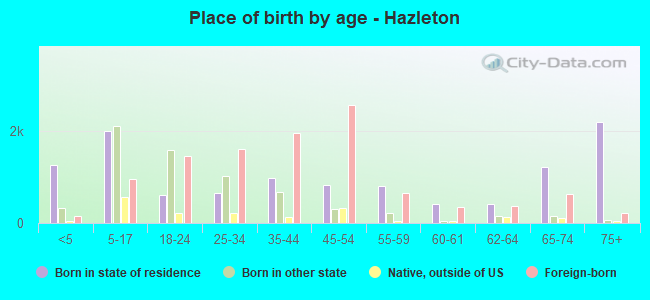
Place of birth - Born in state of residence (%)
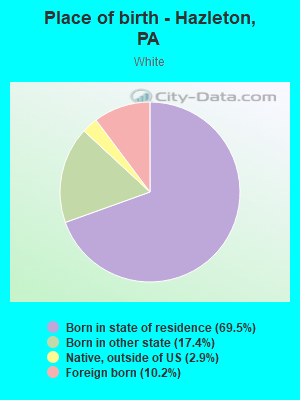
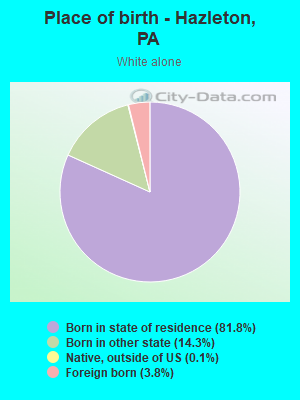
Place of birth - Born in state of residence (%) - White
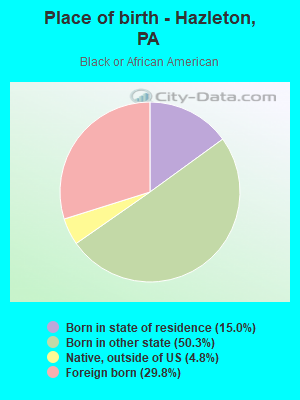
Place of birth - Born in state of residence (%) - Black or African American
Place of birth - Born in state of residence (%) - Asian
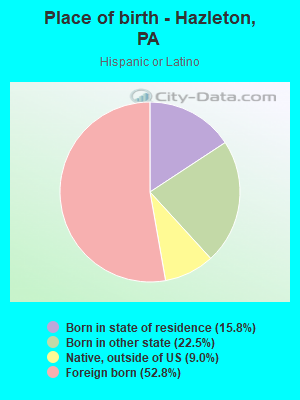
Place of birth - Born in state of residence (%) - Hispanic or Latino
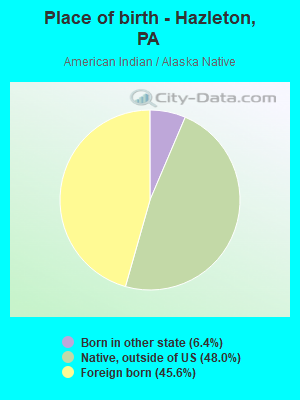
Place of birth - Born in state of residence (%) - American Indian and Alaska Native
Place of birth - Born in state of residence (%) - Multirace
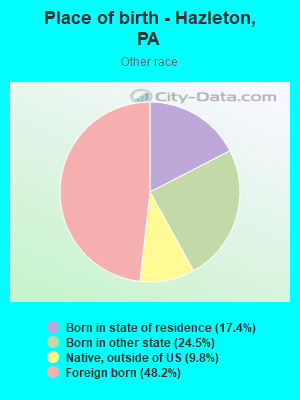
Place of birth - Born in state of residence (%) - Other Race
Place of birth - Born in other state (%)
Place of birth - Born in other state (%) - White
Place of birth - Born in other state (%) - Black or African American
Place of birth - Born in other state (%) - Asian
Place of birth - Born in other state (%) - Hispanic or Latino
Place of birth - Born in other state (%) - American Indian and Alaska Native
Place of birth - Born in other state (%) - Multirace
Place of birth - Born in other state (%) - Other Race
Place of birth - Native, outside of US (%)
Place of birth - Native, outside of US (%) - White
Place of birth - Native, outside of US (%) - Black or African American
Place of birth - Native, outside of US (%) - Asian
Place of birth - Native, outside of US (%) - Hispanic or Latino
Place of birth - Native, outside of US (%) - American Indian and Alaska Native
Place of birth - Native, outside of US (%) - Multirace
Place of birth - Native, outside of US (%) - Other Race
Place of birth - Foreign born (%)
Place of birth - Foreign born (%) - White
Place of birth - Foreign born (%) - Black or African American
Place of birth - Foreign born (%) - Asian
Place of birth - Foreign born (%) - Hispanic or Latino
Place of birth - Foreign born (%) - American Indian and Alaska Native
Place of birth - Foreign born (%) - Multirace
Place of birth - Foreign born (%) - Other Race
Residents speaking English at home (%)
Residents speaking English at home - Born in the United States (%)
Residents speaking English at home - Native, born elsewhere (%)
Residents speaking English at home - Foreign born (%)
Residents speaking Spanish at home (%)
Residents speaking Spanish at home - Born in the United States (%)
Residents speaking Spanish at home - Native, born elsewhere (%)
Residents speaking Spanish at home - Foreign born (%)
Residents speaking other language at home (%)
Residents speaking other language at home - Born in the United States (%)
Residents speaking other language at home - Native, born elsewhere (%)
Residents speaking other language at home - Foreign born (%)
Marital status - Never married (%)
Marital status - Now married (%)
Marital status - Separated (%)
Marital status - Widowed (%)
Marital status - Divorced (%)
Ancestries Reported - Arab (%)
Ancestries Reported - Czech (%)
Ancestries Reported - Danish (%)
Ancestries Reported - Dutch (%)
Ancestries Reported - English (%)
Ancestries Reported - French (%)
Ancestries Reported - French Canadian (%)
Ancestries Reported - German (%)
Ancestries Reported - Greek (%)
Ancestries Reported - Hungarian (%)
Ancestries Reported - Irish (%)
Ancestries Reported - Italian (%)
Ancestries Reported - Lithuanian (%)
Ancestries Reported - Norwegian (%)
Ancestries Reported - Polish (%)
Ancestries Reported - Portuguese (%)
Ancestries Reported - Russian (%)
Ancestries Reported - Scotch-Irish (%)
Ancestries Reported - Scottish (%)
Ancestries Reported - Slovak (%)
Ancestries Reported - Subsaharan African (%)
Ancestries Reported - Swedish (%)
Ancestries Reported - Swiss (%)
Ancestries Reported - Ukrainian (%)
Ancestries Reported - United States (%)
Ancestries Reported - Welsh (%)
Ancestries Reported - West Indian (%)
Ancestries Reported - Other (%)
Geographical mobility - Same house 1 year ago (%)
Geographical mobility - Same house 1 year ago (%) - White
Geographical mobility - Same house 1 year ago (%) - Black or African American
Geographical mobility - Same house 1 year ago (%) - Asian
Geographical mobility - Same house 1 year ago (%) - Hispanic or Latino
Geographical mobility - Same house 1 year ago (%) - American Indian and Alaska Native
Geographical mobility - Same house 1 year ago (%) - Multirace
Geographical mobility - Same house 1 year ago (%) - Other Race
Geographical mobility - Moved within same county (%)
Geographical mobility - Moved within same county (%) - White
Geographical mobility - Moved within same county (%) - Black or African American
Geographical mobility - Moved within same county (%) - Asian
Geographical mobility - Moved within same county (%) - Hispanic or Latino
Geographical mobility - Moved within same county (%) - American Indian and Alaska Native
Geographical mobility - Moved within same county (%) - Multirace
Geographical mobility - Moved within same county (%) - Other Race
Geographical mobility - Moved from different county within same state (%)
Geographical mobility - Moved from different county within same state (%) - White
Geographical mobility - Moved from different county within same state (%) - Black or African American
Geographical mobility - Moved from different county within same state (%) - Asian
Geographical mobility - Moved from different county within same state (%) - Hispanic or Latino
Geographical mobility - Moved from different county within same state (%) - American Indian and Alaska Native
Geographical mobility - Moved from different county within same state (%) - Multirace
Geographical mobility - Moved from different county within same state (%) - Other Race
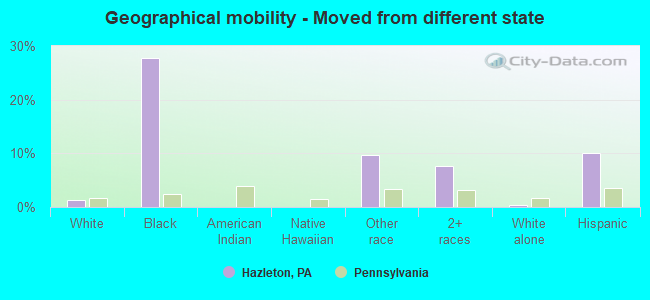
Geographical mobility - Moved from different state (%)
Geographical mobility - Moved from different state (%) - White
Geographical mobility - Moved from different state (%) - Black or African American
Geographical mobility - Moved from different state (%) - Asian
Geographical mobility - Moved from different state (%) - Hispanic or Latino
Geographical mobility - Moved from different state (%) - American Indian and Alaska Native
Geographical mobility - Moved from different state (%) - Multirace
Geographical mobility - Moved from different state (%) - Other Race
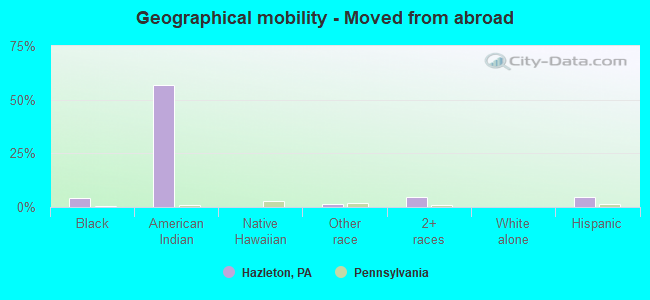
Geographical mobility - Moved from abroad (%)
Geographical mobility - Moved from abroad (%) - White
Geographical mobility - Moved from abroad (%) - Black or African American
Geographical mobility - Moved from abroad (%) - Asian
Geographical mobility - Moved from abroad (%) - Hispanic or Latino
Geographical mobility - Moved from abroad (%) - American Indian and Alaska Native
Geographical mobility - Moved from abroad (%) - Multirace
Geographical mobility - Moved from abroad (%) - Other Race
Place of birth for the foreign-born population - Ireland (%)
Place of birth for the foreign-born population - Denmark (%)
Place of birth for the foreign-born population - Norway (%)
Place of birth for the foreign-born population - Sweden (%)
Place of birth for the foreign-born population - United Kingdom (%)
Place of birth for the foreign-born population - England (%)
Place of birth for the foreign-born population - Scotland (%)
Place of birth for the foreign-born population - Other Northern Europe (%)
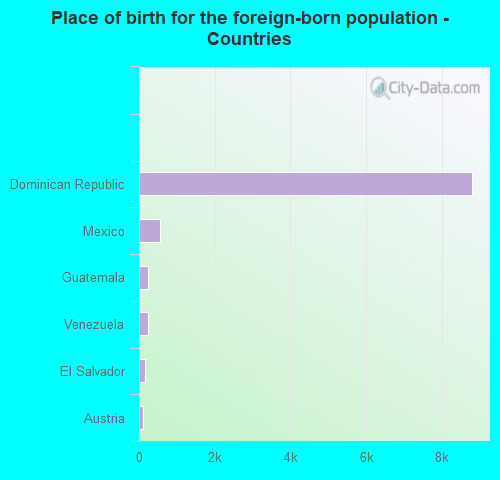
Place of birth for the foreign-born population - Austria (%)
Place of birth for the foreign-born population - Belgium (%)
Place of birth for the foreign-born population - France (%)
Place of birth for the foreign-born population - Germany (%)
Place of birth for the foreign-born population - Netherlands (%)
Place of birth for the foreign-born population - Switzerland (%)
Place of birth for the foreign-born population - Other Western Europe (%)
Place of birth for the foreign-born population - Greece (%)
Place of birth for the foreign-born population - Italy (%)
Place of birth for the foreign-born population - Portugal (%)
Place of birth for the foreign-born population - Spain (%)
Place of birth for the foreign-born population - Other Southern Europe (%)
Place of birth for the foreign-born population - Albania (%)
Place of birth for the foreign-born population - Belarus (%)
Place of birth for the foreign-born population - Bosnia and Herzegovina (%)
Place of birth for the foreign-born population - Bulgaria (%)
Place of birth for the foreign-born population - Croatia (%)
Place of birth for the foreign-born population - Czechoslovakia (%)
Place of birth for the foreign-born population - Hungary (%)
Place of birth for the foreign-born population - Latvia (%)
Place of birth for the foreign-born population - Lithuania (%)
Place of birth for the foreign-born population - North Macedonia (Macedonia) (%)
Place of birth for the foreign-born population - Moldova (%)
Place of birth for the foreign-born population - Poland (%)
Place of birth for the foreign-born population - Romania (%)
Place of birth for the foreign-born population - Russia (%)
Place of birth for the foreign-born population - Serbia (%)
Place of birth for the foreign-born population - Ukraine (%)
Place of birth for the foreign-born population - Other Eastern Europe (%)
Place of birth for the foreign-born population - China (%)
Place of birth for the foreign-born population - Hong Kong (%)
Place of birth for the foreign-born population - Taiwan (%)
Place of birth for the foreign-born population - Japan (%)
Place of birth for the foreign-born population - Korea (%)
Place of birth for the foreign-born population - Other Eastern Asia (%)
Place of birth for the foreign-born population - Afghanistan (%)
Place of birth for the foreign-born population - Bangladesh (%)
Place of birth for the foreign-born population - India (%)
Place of birth for the foreign-born population - Iran (%)
Place of birth for the foreign-born population - Kazakhstan (%)
Place of birth for the foreign-born population - Nepal (%)
Place of birth for the foreign-born population - Pakistan (%)
Place of birth for the foreign-born population - Sri Lanka (%)
Place of birth for the foreign-born population - Uzbekistan (%)
Place of birth for the foreign-born population - Other South Central Asia (%)
Place of birth for the foreign-born population - Burma (%)
Place of birth for the foreign-born population - Cambodia (%)
Place of birth for the foreign-born population - Indonesia (%)
Place of birth for the foreign-born population - Laos (%)
Place of birth for the foreign-born population - Malaysia (%)
Place of birth for the foreign-born population - Philippines (%)
Place of birth for the foreign-born population - Singapore (%)
Place of birth for the foreign-born population - Thailand (%)
Place of birth for the foreign-born population - Vietnam (%)
Place of birth for the foreign-born population - Other South Eastern Asia (%)
Place of birth for the foreign-born population - Armenia (%)
Place of birth for the foreign-born population - Iraq (%)
Place of birth for the foreign-born population - Israel (%)
Place of birth for the foreign-born population - Jordan (%)
Place of birth for the foreign-born population - Kuwait (%)
Place of birth for the foreign-born population - Lebanon (%)
Place of birth for the foreign-born population - Saudi Arabia (%)
Place of birth for the foreign-born population - Syria (%)
Place of birth for the foreign-born population - Turkey (%)
Place of birth for the foreign-born population - Yemen (%)
Place of birth for the foreign-born population - Other Western Asia (%)
Place of birth for the foreign-born population - Eritrea (%)
Place of birth for the foreign-born population - Ethiopia (%)
Place of birth for the foreign-born population - Kenya (%)
Place of birth for the foreign-born population - Somalia (%)
Place of birth for the foreign-born population - Uganda (%)
Place of birth for the foreign-born population - Zimbabwe (%)
Place of birth for the foreign-born population - Other Eastern Africa (%)
Place of birth for the foreign-born population - Cameroon (%)
Place of birth for the foreign-born population - Congo (%)
Place of birth for the foreign-born population - Democratic Republic of Congo (Zaire) (%)
Place of birth for the foreign-born population - Other Middle Africa (%)
Place of birth for the foreign-born population - Egypt (%)
Place of birth for the foreign-born population - Morocco (%)
Place of birth for the foreign-born population - Sudan (%)
Place of birth for the foreign-born population - Other Northern Africa (%)
Place of birth for the foreign-born population - South Africa (%)
Place of birth for the foreign-born population - Other Southern Africa (%)
Place of birth for the foreign-born population - Cabo Verde (%)
Place of birth for the foreign-born population - Ghana (%)
Place of birth for the foreign-born population - Liberia (%)
Place of birth for the foreign-born population - Nigeria (%)
Place of birth for the foreign-born population - Senegal (%)
Place of birth for the foreign-born population - Sierra Leone (%)
Place of birth for the foreign-born population - Other Western Africa (%)
Place of birth for the foreign-born population - Australia (%)
Place of birth for the foreign-born population - New Zealand (%)
Place of birth for the foreign-born population - Fiji (%)
Place of birth for the foreign-born population - Micronesia (%)
Place of birth for the foreign-born population - Bahamas (%)
Place of birth for the foreign-born population - Barbados (%)
Place of birth for the foreign-born population - Cuba (%)
Place of birth for the foreign-born population - Dominica (%)
Place of birth for the foreign-born population - Dominican Republic (%)
Place of birth for the foreign-born population - Grenada (%)
Place of birth for the foreign-born population - Haiti (%)
Place of birth for the foreign-born population - Jamaica (%)
Place of birth for the foreign-born population - St. Vincent and the Grenadines (%)
Place of birth for the foreign-born population - Trinidad and Tobago (%)
Place of birth for the foreign-born population - West Indies (%)
Place of birth for the foreign-born population - Other Caribbean (%)
Place of birth for the foreign-born population - Belize (%)
Place of birth for the foreign-born population - Costa Rica (%)
Place of birth for the foreign-born population - El Salvador (%)
Place of birth for the foreign-born population - Guatemala (%)
Place of birth for the foreign-born population - Honduras (%)
Place of birth for the foreign-born population - Mexico (%)
Place of birth for the foreign-born population - Nicaragua (%)
Place of birth for the foreign-born population - Panama (%)
Place of birth for the foreign-born population - Other Central America (%)
Place of birth for the foreign-born population - Argentina (%)
Place of birth for the foreign-born population - Bolivia (%)
Place of birth for the foreign-born population - Brazil (%)
Place of birth for the foreign-born population - Chile (%)
Place of birth for the foreign-born population - Colombia (%)
Place of birth for the foreign-born population - Ecuador (%)
Place of birth for the foreign-born population - Guyana (%)
Place of birth for the foreign-born population - Peru (%)
Place of birth for the foreign-born population - Uruguay (%)
Place of birth for the foreign-born population - Venezuela (%)
Place of birth for the foreign-born population - Other South America (%)
Place of birth for the foreign-born population - Canada (%)
Place of birth for the foreign-born population - Other Northern America (%)
Place of birth for the foreign-born population - Other (%)
Latest news about races in Hazleton, PA collected exclusively by city-data.com from local newspapers, TV, and radio stations
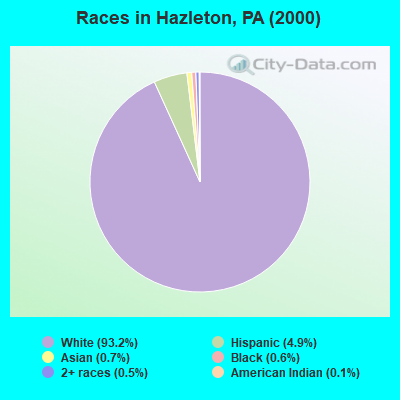
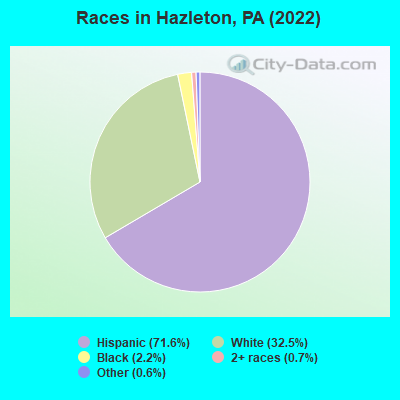
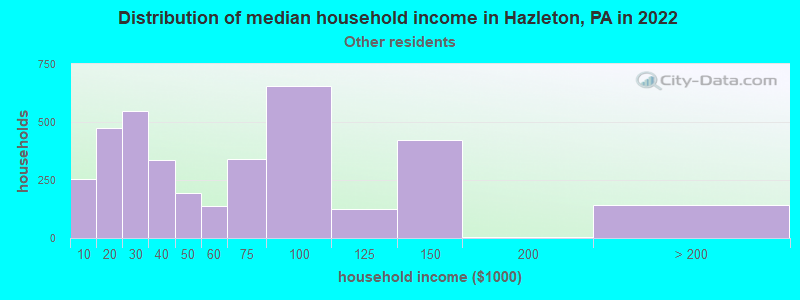
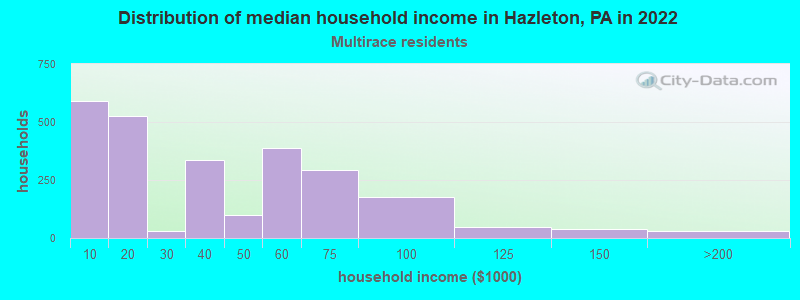
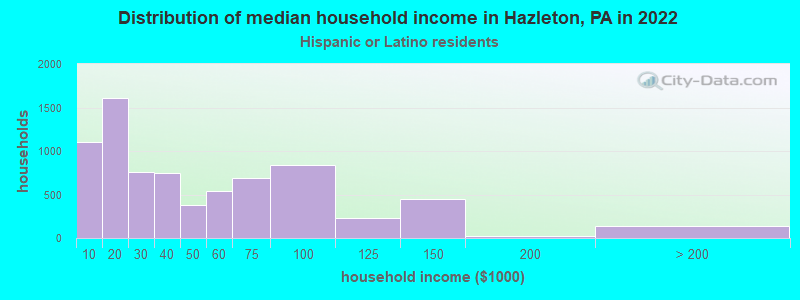
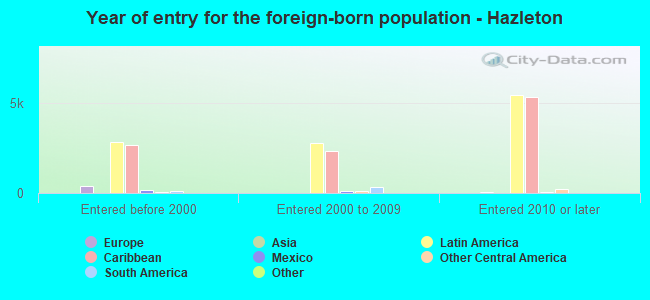
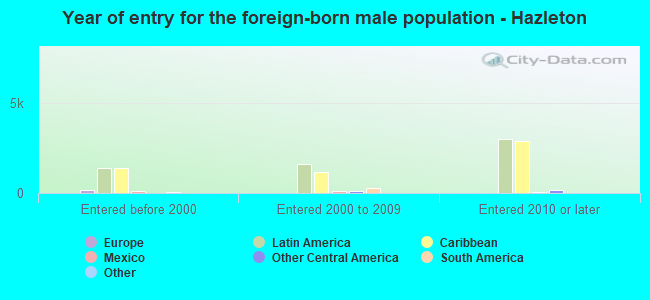
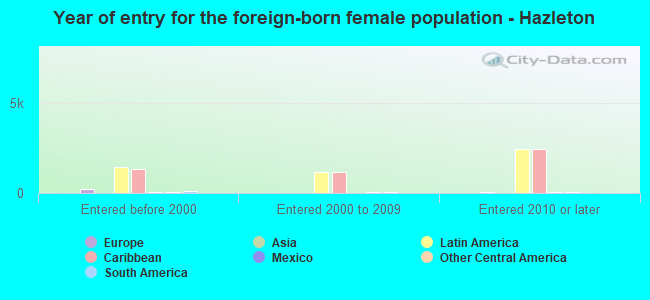
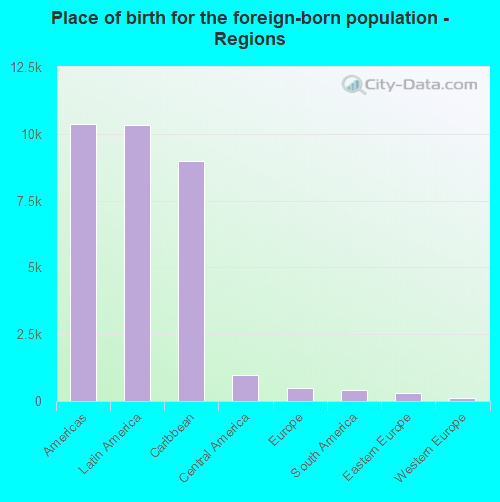
According to 2022 data, the most numerous races in Hazleton, PA are White alone (9,669 residents), Black alone (644 residents), and Hispanic (21,300 residents). 42.2% of Hazleton residents speak English at home. 36.5% of Hazleton, PA residents are foreign-born (33.6% born in Latin America), which is 80.8% greater than the foreign-born rate of 7.0% across the entire state of Pennsylvania.
Race distribution in Hazleton
2000 2022
10,322,455 84.1% White alone 1,202,437 9.8% Black alone 394,088 3.2% Hispanic 218,296 1.8% Asian alone 113,097 0.9% Two or more races 13,086 0.1% Other race alone 14,904 0.1% American Indian alone 2,691 0.02% Native Hawaiian and Other
9,487,228 73.1% White alone 1,311,581 10.1% Black alone 1,115,997 8.6% Hispanic 493,942 3.8% Two or more races 487,124 3.8% Asian alone 63,582 0.5% Other race alone 10,130 0.08% American Indian alone 2,424 0.02% Native Hawaiian and Other
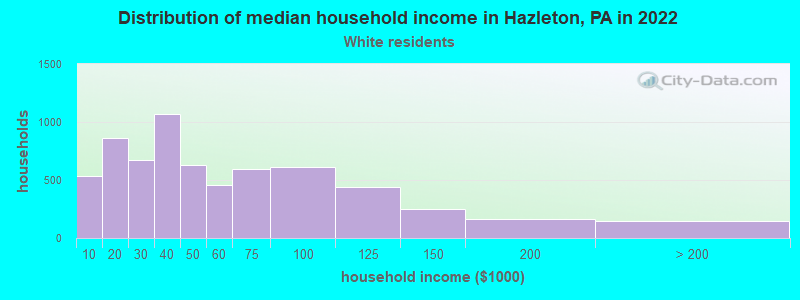
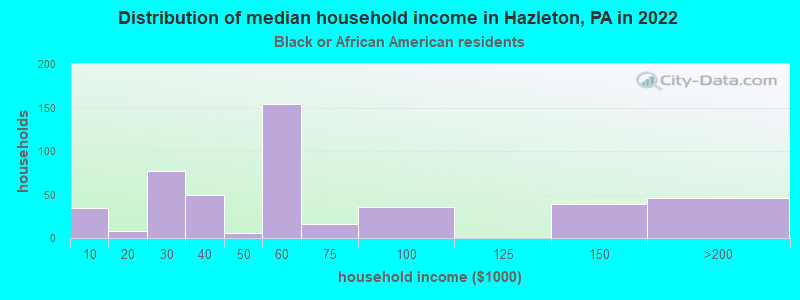
Income and house value in Hazleton Median household income in 2022 $39,873 White non-Hispanic householders$67,347 Black householders$42,672 Some other race householders$27,170 Two or more races householders$29,128 Hispanic or Latino race householdersMedian 2022 house value $133,011 White Non-Hispanic householders$321,165 Black or African American householders$54,351 American Indian or Alaska Native householders $349,427 Asian householders$103,365 Some other race householders$105,144 Two or more races householders$124,710 Hispanic or Latino householders
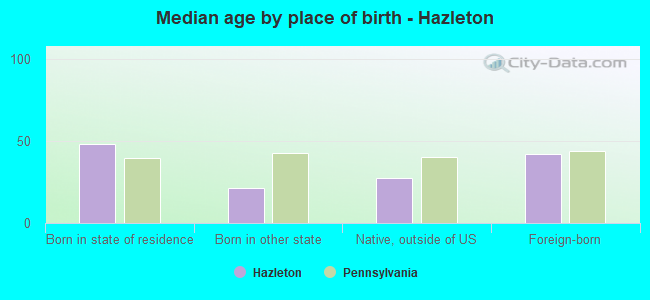
Median age by race in Hazleton
51.8 Median age for White residents47.7 56.5 24.0 Median age for Black or African American residents24.0 23.6 54.7 Median age for American Indian / Alaska Native residents27.5 -1,340,606,059.3 -709,732,988.1 Median age for Asian residents-672,268,906.9 -753,760,886.0 -750,524,108.3 Median age for Native Hawaiian / Pacific Islander residents-424,242,423.8 -747,474,746.7 28.9 Median age for Other race residents28.0 27.5 29.0 Median age for Two or more races residents26.5 34.0 59.3 Median age for White alone residents56.6 62.4 28.0 Median age for Hispanic or Latino residents28.5 29.6
Owner/renter occupied households by race in Hazleton
House owners and renters - White residents 3,790 58.5% Owner occupied2,688 41.5% Renter occupiedHouse owners and renters - Black or African American residents 77 20.0% Owner occupied310 80.0% Renter occupiedHouse owners and renters - American Indian / Alaska Native residents 34 100.0% Renter occupiedHouse owners and renters - Native Hawaiian / Pacific Islander residents 49 100.0% Renter occupiedHouse owners and renters - Other race residents 1,573 42.0% Owner occupied2,167 58.0% Renter occupiedHouse owners and renters - Two or more races residents 723 25.4% Owner occupied2,128 74.6% Renter occupiedHouse owners and renters - White alone residents 3,399 64.0% Owner occupied1,911 36.0% Renter occupiedHouse owners and renters - Hispanic or Latino residents 2,548 36.2% Owner occupied4,481 63.8% Renter occupied
Language usage in Hazleton
English speakers - Total 42.2% of residents of Hazleton speak English at home.
65.4% of residents speak Spanish at home 8,568 46.9% Speak English very well9,699 53.1% Speak English less than very well1.7% of residents speak other language at home 336 71.3% Speak English very well135 28.7% Speak English less than very well
English speakers - Born in the United States 41.1% of residents of Hazleton speak English at home.
64.3% of residents speak Spanish at home 3,157 77.6% Speak English very well910 22.4% Speak English less than very well1.4% of residents speak other language at home 87 100.0% Speak English very well
English speakers - Native, born elsewhere 7.6% of residents of Hazleton speak English at home.
96.0% of residents speak Spanish at home 674 41.4% Speak English very well953 58.6% Speak English less than very well0.6% of residents speak other language at home 11 100.0% Speak English very well
English speakers - Foreign-born 6.5% of residents of Hazleton speak English at home.
96.7% of residents speak Spanish at home 3,065 29.3% Speak English very well7,394 70.7% Speak English less than very well2.8% of residents speak other language at home 210 69.8% Speak English very well91 30.2% Speak English less than very well
White (Caucasian) - Speak only English Native:
85.7% (9,122)Foreign-born:
13.2% (164)
White (Caucasian) - Speak another language Native:
8.4% (890)Foreign-born:
100.0% (1,249)
Black or African American - Speak only English Native:
73.5% (760)Foreign-born:
10.0% (48)
Black or African American - Speak another language Native:
33.0% (341)Foreign-born:
81.5% (392)
American Indian / Alaska Native - Speak another language Native:
100.0% (70)Foreign-born:
100.0% (59)
Other race - Speak only English Native:
10.3% (533)Foreign-born:
3.6% (207)
Other race - Speak another language Native:
92.3% (4,762)Foreign-born:
96.3% (5,537)
Two or more races - Speak only English Native:
26.1% (840)Foreign-born:
10.7% (381)
Two or more races - Speak another language Native:
66.5% (2,142)Foreign-born:
89.1% (3,175)
White alone - Speak only English Native:
95.6% (8,673)Foreign-born:
39.0% (143)
White alone - Speak another language Native:
3.7% (336)Foreign-born:
45.5% (167)
Hispanic or Latino - Speak only English Native:
17.5% (1,480)Foreign-born:
4.9% (538)
Hispanic or Latino - Speak another language Native:
86.9% (7,336)Foreign-born:
95.1% (10,551)
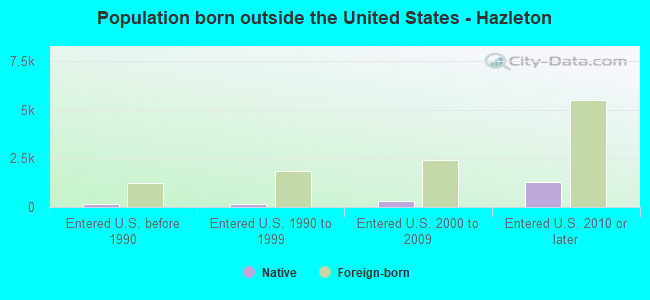
Foreign-born residents in Hazleton 10,854 residents are foreign born (33.6% Latin America ).
This city:
36.5%Pennsylvania:
7.3%
Marital status for residents in Hazleton Marital status - White (Caucasian) population 15 years and over
Males 42.6% Never married38.2% Now married1.1% Separated6.3% Widowed11.8% DivorcedFemales 27.7% Never married39.1% Now married4.6% Separated14.6% Widowed14.0% DivorcedWomen who gave birth in the past 12 months Now married:
25.0% (23)Unmarried:
75.0% (70)
Women who did not give birth in the past 12 months Now married:
43.3% (956)Unmarried:
56.7% (1,254)
Marital status - Black or African American population 15 years and over
Males 54.2% Never married40.2% Now married3.7% Separated0.0% Widowed2.0% DivorcedFemales 46.5% Never married35.8% Now married13.8% Separated3.0% Widowed1.0% DivorcedWomen who gave birth in the past 12 months Now married:
27.6% (7)Unmarried:
72.4% (19)
Women who did not give birth in the past 12 months Now married:
47.8% (249)Unmarried:
52.2% (271)
Marital status - American Indian / Alaska Native population 15 years and over
Males 21.4% Never married78.6% Now married0.0% Separated0.0% Widowed0.0% DivorcedFemales 62.1% Never married37.9% Now married0.0% Separated0.0% Widowed0.0% DivorcedWomen who did not give birth in the past 12 months Now married:
37.9% (20)Unmarried:
62.1% (33)
Marital status - Other race population 15 years and over
Males 47.3% Never married43.3% Now married3.0% Separated2.7% Widowed3.7% DivorcedFemales 51.2% Never married29.0% Now married4.9% Separated4.4% Widowed10.4% DivorcedWomen who gave birth in the past 12 months Now married:
22.0% (78)Unmarried:
78.0% (276)
Women who did not give birth in the past 12 months Now married:
28.2% (890)Unmarried:
71.8% (2,263)
Marital status - Two or more races population 15 years and over
Males 62.8% Never married30.0% Now married2.4% Separated1.5% Widowed3.2% DivorcedFemales 43.9% Never married32.0% Now married12.8% Separated5.1% Widowed6.1% DivorcedWomen who gave birth in the past 12 months Now married:
20.5% (24)Unmarried:
79.5% (94)
Women who did not give birth in the past 12 months Now married:
39.9% (550)Unmarried:
60.1% (829)
Marital status - White alone, not Hispanic / Latino population 15 years and over
Males 40.1% Never married39.4% Now married1.1% Separated7.3% Widowed12.2% DivorcedFemales 23.5% Never married42.3% Now married3.2% Separated17.6% Widowed13.4% DivorcedWomen who gave birth in the past 12 months Now married:
100.0% (9)Unmarried:
0.0% (0)
Women who did not give birth in the past 12 months Now married:
42.3% (599)Unmarried:
57.7% (816)
Marital status - Hispanic or Latino population 15 years and over
Males 53.1% Never married37.2% Now married2.2% Separated2.4% Widowed5.1% DivorcedFemales 46.9% Never married29.9% Now married8.8% Separated4.5% Widowed9.9% DivorcedWomen who gave birth in the past 12 months Now married:
21.0% (109)Unmarried:
79.0% (409)
Women who did not give birth in the past 12 months Now married:
35.6% (1,839)Unmarried:
64.4% (3,324)
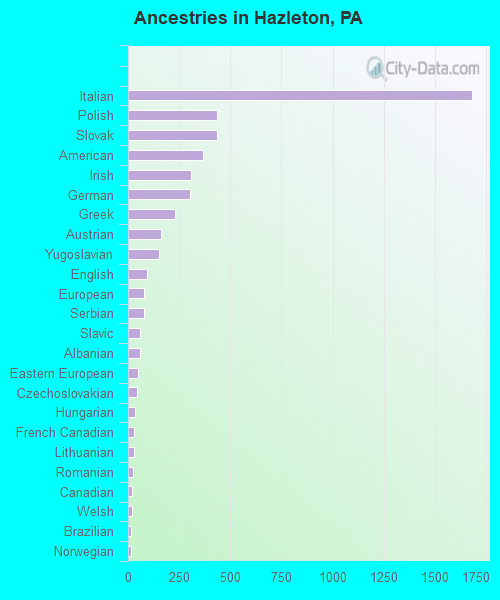
Ancestries in Hazleton
1,681 9.1% Italian433 2.3% Polish433 2.3% Slovak368 2.0% American309 1.7% Irish301 1.6% German230 1.2% Greek159 0.9% Austrian154 0.8% Yugoslavian92 0.5% English80 0.4% European80 0.4% Serbian61 0.3% Slavic60 0.3% Albanian50 0.3% Eastern European45 0.2% Czechoslovakian35 0.2% Hungarian30 0.2% French Canadian27 0.1% Lithuanian24 0.1% Romanian19 0.1% Canadian18 0.10% Welsh17 0.09% Brazilian17 0.09% Norwegian14 0.08% Dutch12 0.06% Pennsylvania German11 0.06% Russian10 0.05% French8 0.04% Lebanese8 0.04% Syrian7 0.04% Carpatho Rusyn
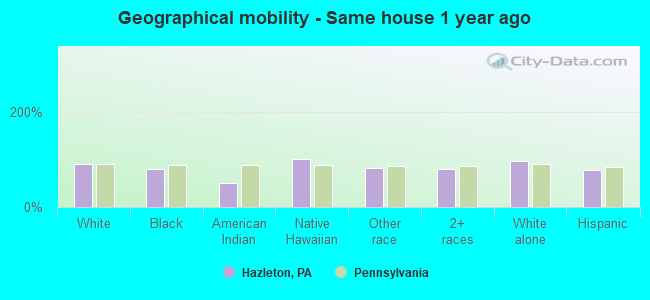
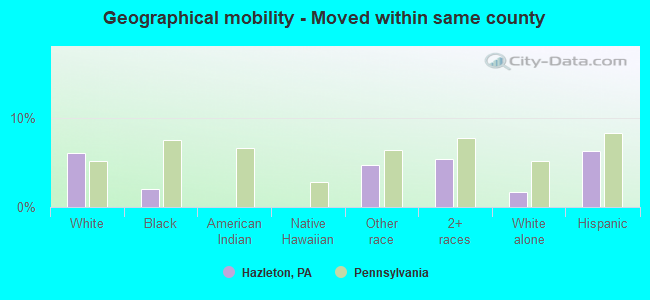
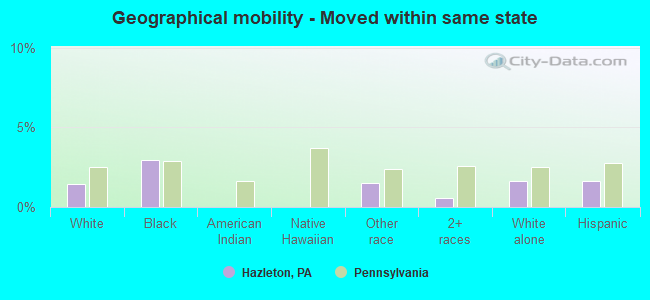
Geographical mobility in Hazleton Same house 1 year ago 12,125 90.1% White (Caucasian)1,419 78.7% Black or African American65 50.4% American Indian / Alaska Native69 100.0% Native Hawaiian / Pacific Islander9,703 81.0% Other race5,340 80.4% Two or more races9,297 96.3% White alone, not Hispanic / Latino16,251 78.4% Hispanic or LatinoMoved within same county 814 6.0% White / Caucasian36 2.0% Black or African American568 4.7% Other race356 5.4% Two or more races167 1.7% White alone, not Hispanic / Latino1,301 6.3% Hispanic or LatinoMoved within same state 198 1.5% White / Caucasian53 3.0% Black or African American181 1.5% Other race40 0.6% Two or more races157 1.6% White alone, not Hispanic / Latino339 1.6% Hispanic or LatinoMoved from different state 182 1.4% White / Caucasian502 27.8% Black or African American1,168 9.8% Other race513 7.7% Two or more races36 0.4% White alone, not Hispanic / Latino2,093 10.1% Hispanic or LatinoMoved from abroad 52 0.4% White73 4.1% Black or African American74 57.1% American Indian / Alaska Native161 1.3% Other race314 4.7% Two or more races966 4.7% Hispanic or Latino
Children Nativity (place of birth) in Hazleton
Children under 6 years - Living with two parents Both parents foreign-born 504 94.4% Native30 5.6% Foreign-bornOne native, one foreign-born parent 10 100.0% NativeChildren under 6 years - Living with one parent Native parent 820 92.5% Native66 7.5% Foreign-bornForeign-born parent 745 86.2% Native119 13.8% Foreign-bornChildren 6 to 17 years - Living with two parents Both parents native 11 100.0% Foreign-bornBoth parents foreign-born 998 80.8% Native237 19.2% Foreign-bornOne native, one foreign-born parent 622 93.3% Native44 6.7% Foreign-bornChildren 6 to 17 years - Living with one parent Native parent 563 100.0% NativeForeign-born parent 1,183 62.9% Native697 37.1% Foreign-born
Grandparents responsible for own grandchildren in Hazleton
Grandparents (30 to 59 years) White / Caucasian 19 17.7% Responsible for grandchildren87 82.3% Not responsible for grandchildrenBlack or African American 23 100.0% Responsible for grandchildrenOther race 32 9.4% Responsible for grandchildren309 90.6% Not responsible for grandchildrenTwo or more races 67 100.0% Not responsible for grandchildrenWhite alone, not Hispanic / Latino 40 100.0% Not responsible for grandchildrenHispanic or Latino 68 14.7% Responsible for grandchildren397 85.3% Not responsible for grandchildrenGrandparents (60 years and over) White / Caucasian 57 58.2% Responsible for grandchildren41 41.8% Not responsible for grandchildrenBlack or African American 141 100.0% Responsible for grandchildrenOther race 101 100.0% Not responsible for grandchildrenTwo or more races 167 100.0% Not responsible for grandchildrenWhite alone, not Hispanic / Latino 20 100.0% Not responsible for grandchildrenHispanic or Latino 238 49.4% Responsible for grandchildren244 50.6% Not responsible for grandchildren