Races in Hartford, Connecticut (CT) Detailed Stats
Data:
Races - White alone (%)
Races - White alone (% change since 2000)
Races - Black alone (%)
Races - Black alone (% change since 2000)
Races - American Indian alone (%)
Races - American Indian alone (% change since 2000)
Races - Asian alone (%)
Races - Asian alone (% change since 2000)
Races - Hispanic (%)
Races - Hispanic (% change since 2000)
Races - Native Hawaiian and Other Pacific Islander alone (%)
Races - Native Hawaiian and Other Pacific Islander alone (% change since 2000)
Races - Two or more races(%)
Races - Two or more races(% change since 2000)
Races - Other race alone (%)
Races - Other race alone (% change since 2000)
Racial diversity
Place of birth - Born in state of residence (%)
Place of birth - Born in state of residence (%) - White
Place of birth - Born in state of residence (%) - Black or African American
Place of birth - Born in state of residence (%) - Asian
Place of birth - Born in state of residence (%) - Hispanic or Latino
Place of birth - Born in state of residence (%) - American Indian and Alaska Native
Place of birth - Born in state of residence (%) - Multirace
Place of birth - Born in state of residence (%) - Other Race
Place of birth - Born in other state (%)
Place of birth - Born in other state (%) - White
Place of birth - Born in other state (%) - Black or African American
Place of birth - Born in other state (%) - Asian
Place of birth - Born in other state (%) - Hispanic or Latino
Place of birth - Born in other state (%) - American Indian and Alaska Native
Place of birth - Born in other state (%) - Multirace
Place of birth - Born in other state (%) - Other Race
Place of birth - Native, outside of US (%)
Place of birth - Native, outside of US (%) - White
Place of birth - Native, outside of US (%) - Black or African American
Place of birth - Native, outside of US (%) - Asian
Place of birth - Native, outside of US (%) - Hispanic or Latino
Place of birth - Native, outside of US (%) - American Indian and Alaska Native
Place of birth - Native, outside of US (%) - Multirace
Place of birth - Native, outside of US (%) - Other Race
Place of birth - Foreign born (%)
Place of birth - Foreign born (%) - White
Place of birth - Foreign born (%) - Black or African American
Place of birth - Foreign born (%) - Asian
Place of birth - Foreign born (%) - Hispanic or Latino
Place of birth - Foreign born (%) - American Indian and Alaska Native
Place of birth - Foreign born (%) - Multirace
Place of birth - Foreign born (%) - Other Race
Residents speaking English at home (%)
Residents speaking English at home - Born in the United States (%)
Residents speaking English at home - Native, born elsewhere (%)
Residents speaking English at home - Foreign born (%)
Residents speaking Spanish at home (%)
Residents speaking Spanish at home - Born in the United States (%)
Residents speaking Spanish at home - Native, born elsewhere (%)
Residents speaking Spanish at home - Foreign born (%)
Residents speaking other language at home (%)
Residents speaking other language at home - Born in the United States (%)
Residents speaking other language at home - Native, born elsewhere (%)
Residents speaking other language at home - Foreign born (%)
Marital status - Never married (%)
Marital status - Now married (%)
Marital status - Separated (%)
Marital status - Widowed (%)
Marital status - Divorced (%)
Ancestries Reported - Arab (%)
Ancestries Reported - Czech (%)
Ancestries Reported - Danish (%)
Ancestries Reported - Dutch (%)
Ancestries Reported - English (%)
Ancestries Reported - French (%)
Ancestries Reported - French Canadian (%)
Ancestries Reported - German (%)
Ancestries Reported - Greek (%)
Ancestries Reported - Hungarian (%)
Ancestries Reported - Irish (%)
Ancestries Reported - Italian (%)
Ancestries Reported - Lithuanian (%)
Ancestries Reported - Norwegian (%)
Ancestries Reported - Polish (%)
Ancestries Reported - Portuguese (%)
Ancestries Reported - Russian (%)
Ancestries Reported - Scotch-Irish (%)
Ancestries Reported - Scottish (%)
Ancestries Reported - Slovak (%)
Ancestries Reported - Subsaharan African (%)
Ancestries Reported - Swedish (%)
Ancestries Reported - Swiss (%)
Ancestries Reported - Ukrainian (%)
Ancestries Reported - United States (%)
Ancestries Reported - Welsh (%)
Ancestries Reported - West Indian (%)
Ancestries Reported - Other (%)
Geographical mobility - Same house 1 year ago (%)
Geographical mobility - Same house 1 year ago (%) - White
Geographical mobility - Same house 1 year ago (%) - Black or African American
Geographical mobility - Same house 1 year ago (%) - Asian
Geographical mobility - Same house 1 year ago (%) - Hispanic or Latino
Geographical mobility - Same house 1 year ago (%) - American Indian and Alaska Native
Geographical mobility - Same house 1 year ago (%) - Multirace
Geographical mobility - Same house 1 year ago (%) - Other Race
Geographical mobility - Moved within same county (%)
Geographical mobility - Moved within same county (%) - White
Geographical mobility - Moved within same county (%) - Black or African American
Geographical mobility - Moved within same county (%) - Asian
Geographical mobility - Moved within same county (%) - Hispanic or Latino
Geographical mobility - Moved within same county (%) - American Indian and Alaska Native
Geographical mobility - Moved within same county (%) - Multirace
Geographical mobility - Moved within same county (%) - Other Race
Geographical mobility - Moved from different county within same state (%)
Geographical mobility - Moved from different county within same state (%) - White
Geographical mobility - Moved from different county within same state (%) - Black or African American
Geographical mobility - Moved from different county within same state (%) - Asian
Geographical mobility - Moved from different county within same state (%) - Hispanic or Latino
Geographical mobility - Moved from different county within same state (%) - American Indian and Alaska Native
Geographical mobility - Moved from different county within same state (%) - Multirace
Geographical mobility - Moved from different county within same state (%) - Other Race
Geographical mobility - Moved from different state (%)
Geographical mobility - Moved from different state (%) - White
Geographical mobility - Moved from different state (%) - Black or African American
Geographical mobility - Moved from different state (%) - Asian
Geographical mobility - Moved from different state (%) - Hispanic or Latino
Geographical mobility - Moved from different state (%) - American Indian and Alaska Native
Geographical mobility - Moved from different state (%) - Multirace
Geographical mobility - Moved from different state (%) - Other Race
Geographical mobility - Moved from abroad (%)
Geographical mobility - Moved from abroad (%) - White
Geographical mobility - Moved from abroad (%) - Black or African American
Geographical mobility - Moved from abroad (%) - Asian
Geographical mobility - Moved from abroad (%) - Hispanic or Latino
Geographical mobility - Moved from abroad (%) - American Indian and Alaska Native
Geographical mobility - Moved from abroad (%) - Multirace
Geographical mobility - Moved from abroad (%) - Other Race
Place of birth for the foreign-born population - Ireland (%)
Place of birth for the foreign-born population - Denmark (%)
Place of birth for the foreign-born population - Norway (%)
Place of birth for the foreign-born population - Sweden (%)
Place of birth for the foreign-born population - United Kingdom (%)
Place of birth for the foreign-born population - England (%)
Place of birth for the foreign-born population - Scotland (%)
Place of birth for the foreign-born population - Other Northern Europe (%)
Place of birth for the foreign-born population - Austria (%)
Place of birth for the foreign-born population - Belgium (%)
Place of birth for the foreign-born population - France (%)
Place of birth for the foreign-born population - Germany (%)
Place of birth for the foreign-born population - Netherlands (%)
Place of birth for the foreign-born population - Switzerland (%)
Place of birth for the foreign-born population - Other Western Europe (%)
Place of birth for the foreign-born population - Greece (%)
Place of birth for the foreign-born population - Italy (%)
Place of birth for the foreign-born population - Portugal (%)
Place of birth for the foreign-born population - Spain (%)
Place of birth for the foreign-born population - Other Southern Europe (%)
Place of birth for the foreign-born population - Albania (%)
Place of birth for the foreign-born population - Belarus (%)
Place of birth for the foreign-born population - Bosnia and Herzegovina (%)
Place of birth for the foreign-born population - Bulgaria (%)
Place of birth for the foreign-born population - Croatia (%)
Place of birth for the foreign-born population - Czechoslovakia (%)
Place of birth for the foreign-born population - Hungary (%)
Place of birth for the foreign-born population - Latvia (%)
Place of birth for the foreign-born population - Lithuania (%)
Place of birth for the foreign-born population - North Macedonia (Macedonia) (%)
Place of birth for the foreign-born population - Moldova (%)
Place of birth for the foreign-born population - Poland (%)
Place of birth for the foreign-born population - Romania (%)
Place of birth for the foreign-born population - Russia (%)
Place of birth for the foreign-born population - Serbia (%)
Place of birth for the foreign-born population - Ukraine (%)
Place of birth for the foreign-born population - Other Eastern Europe (%)
Place of birth for the foreign-born population - China (%)
Place of birth for the foreign-born population - Hong Kong (%)
Place of birth for the foreign-born population - Taiwan (%)
Place of birth for the foreign-born population - Japan (%)
Place of birth for the foreign-born population - Korea (%)
Place of birth for the foreign-born population - Other Eastern Asia (%)
Place of birth for the foreign-born population - Afghanistan (%)
Place of birth for the foreign-born population - Bangladesh (%)
Place of birth for the foreign-born population - India (%)
Place of birth for the foreign-born population - Iran (%)
Place of birth for the foreign-born population - Kazakhstan (%)
Place of birth for the foreign-born population - Nepal (%)
Place of birth for the foreign-born population - Pakistan (%)
Place of birth for the foreign-born population - Sri Lanka (%)
Place of birth for the foreign-born population - Uzbekistan (%)
Place of birth for the foreign-born population - Other South Central Asia (%)
Place of birth for the foreign-born population - Burma (%)
Place of birth for the foreign-born population - Cambodia (%)
Place of birth for the foreign-born population - Indonesia (%)
Place of birth for the foreign-born population - Laos (%)
Place of birth for the foreign-born population - Malaysia (%)
Place of birth for the foreign-born population - Philippines (%)
Place of birth for the foreign-born population - Singapore (%)
Place of birth for the foreign-born population - Thailand (%)
Place of birth for the foreign-born population - Vietnam (%)
Place of birth for the foreign-born population - Other South Eastern Asia (%)
Place of birth for the foreign-born population - Armenia (%)
Place of birth for the foreign-born population - Iraq (%)
Place of birth for the foreign-born population - Israel (%)
Place of birth for the foreign-born population - Jordan (%)
Place of birth for the foreign-born population - Kuwait (%)
Place of birth for the foreign-born population - Lebanon (%)
Place of birth for the foreign-born population - Saudi Arabia (%)
Place of birth for the foreign-born population - Syria (%)
Place of birth for the foreign-born population - Turkey (%)
Place of birth for the foreign-born population - Yemen (%)
Place of birth for the foreign-born population - Other Western Asia (%)
Place of birth for the foreign-born population - Eritrea (%)
Place of birth for the foreign-born population - Ethiopia (%)
Place of birth for the foreign-born population - Kenya (%)
Place of birth for the foreign-born population - Somalia (%)
Place of birth for the foreign-born population - Uganda (%)
Place of birth for the foreign-born population - Zimbabwe (%)
Place of birth for the foreign-born population - Other Eastern Africa (%)
Place of birth for the foreign-born population - Cameroon (%)
Place of birth for the foreign-born population - Congo (%)
Place of birth for the foreign-born population - Democratic Republic of Congo (Zaire) (%)
Place of birth for the foreign-born population - Other Middle Africa (%)
Place of birth for the foreign-born population - Egypt (%)
Place of birth for the foreign-born population - Morocco (%)
Place of birth for the foreign-born population - Sudan (%)
Place of birth for the foreign-born population - Other Northern Africa (%)
Place of birth for the foreign-born population - South Africa (%)
Place of birth for the foreign-born population - Other Southern Africa (%)
Place of birth for the foreign-born population - Cabo Verde (%)
Place of birth for the foreign-born population - Ghana (%)
Place of birth for the foreign-born population - Liberia (%)
Place of birth for the foreign-born population - Nigeria (%)
Place of birth for the foreign-born population - Senegal (%)
Place of birth for the foreign-born population - Sierra Leone (%)
Place of birth for the foreign-born population - Other Western Africa (%)
Place of birth for the foreign-born population - Australia (%)
Place of birth for the foreign-born population - New Zealand (%)
Place of birth for the foreign-born population - Fiji (%)
Place of birth for the foreign-born population - Micronesia (%)
Place of birth for the foreign-born population - Bahamas (%)
Place of birth for the foreign-born population - Barbados (%)
Place of birth for the foreign-born population - Cuba (%)
Place of birth for the foreign-born population - Dominica (%)
Place of birth for the foreign-born population - Dominican Republic (%)
Place of birth for the foreign-born population - Grenada (%)
Place of birth for the foreign-born population - Haiti (%)
Place of birth for the foreign-born population - Jamaica (%)
Place of birth for the foreign-born population - St. Vincent and the Grenadines (%)
Place of birth for the foreign-born population - Trinidad and Tobago (%)
Place of birth for the foreign-born population - West Indies (%)
Place of birth for the foreign-born population - Other Caribbean (%)
Place of birth for the foreign-born population - Belize (%)
Place of birth for the foreign-born population - Costa Rica (%)
Place of birth for the foreign-born population - El Salvador (%)
Place of birth for the foreign-born population - Guatemala (%)
Place of birth for the foreign-born population - Honduras (%)
Place of birth for the foreign-born population - Mexico (%)
Place of birth for the foreign-born population - Nicaragua (%)
Place of birth for the foreign-born population - Panama (%)
Place of birth for the foreign-born population - Other Central America (%)
Place of birth for the foreign-born population - Argentina (%)
Place of birth for the foreign-born population - Bolivia (%)
Place of birth for the foreign-born population - Brazil (%)
Place of birth for the foreign-born population - Chile (%)
Place of birth for the foreign-born population - Colombia (%)
Place of birth for the foreign-born population - Ecuador (%)
Place of birth for the foreign-born population - Guyana (%)
Place of birth for the foreign-born population - Peru (%)
Place of birth for the foreign-born population - Uruguay (%)
Place of birth for the foreign-born population - Venezuela (%)
Place of birth for the foreign-born population - Other South America (%)
Place of birth for the foreign-born population - Canada (%)
Place of birth for the foreign-born population - Other Northern America (%)
Place of birth for the foreign-born population - Other (%)
Latest news about races in Hartford, CT collected exclusively by city-data.com from local newspapers, TV, and radio stations
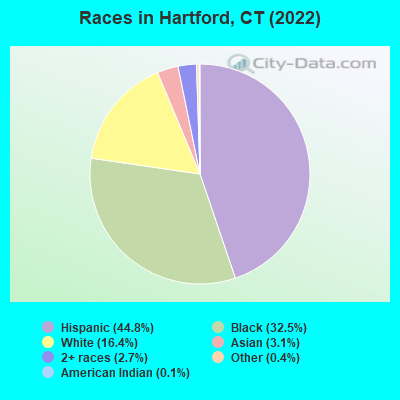
According to 2022 data, the most numerous races in Hartford, CT are White alone (19,835 residents), Hispanic (54,050 residents), and Black alone (39,245 residents). 58.0% of Hartford residents speak English at home. 22.1% of Hartford, CT residents are foreign-born (16.2% born in Latin America), which is 32.3% greater than the foreign-born rate of 15.0% across the entire state of Connecticut.
Race distribution in Hartford
2000 2022
49,260 40.5% Hispanic 43,775 36.0% Black alone 21,677 17.8% White alone 3,913 3.2% Two or more races 1,898 1.6% Asian alone 685 0.6% Other race alone 328 0.3% American Indian alone 42 0.03% Native Hawaiian and Other
54,050 44.8% Hispanic 39,245 32.5% Black alone 19,835 16.4% White alone 3,711 3.1% Asian alone 3,200 2.7% Two or more races 461 0.4% Other race alone 180 0.1% American Indian alone
2000 2022
2,638,845 77.5% White alone 320,323 9.4% Hispanic 295,571 8.7% Black alone 81,564 2.4% Asian alone 52,896 1.6% Two or more races 8,141 0.2% Other race alone 7,267 0.2% American Indian alone 958 0.03% Native Hawaiian and Other
2,246,913 62.0% White alone 658,978 18.2% Hispanic 353,973 9.8% Black alone 172,929 4.8% Asian alone 159,631 4.4% Two or more races 29,761 0.8% Other race alone 3,428 0.09% American Indian alone 592 0.02% Native Hawaiian and Other
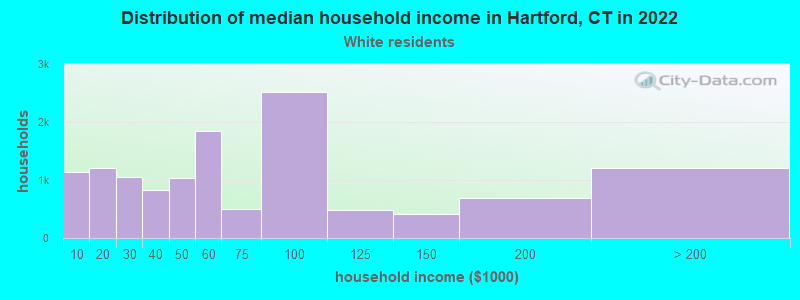
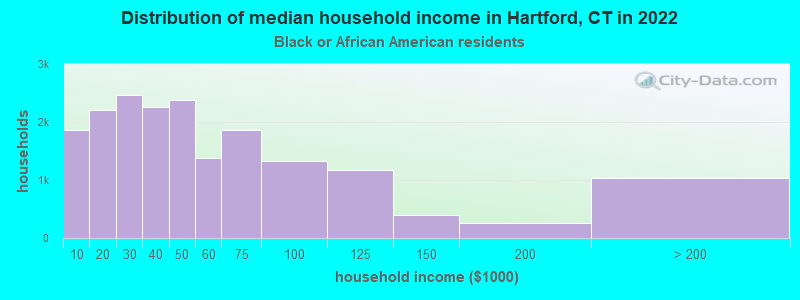
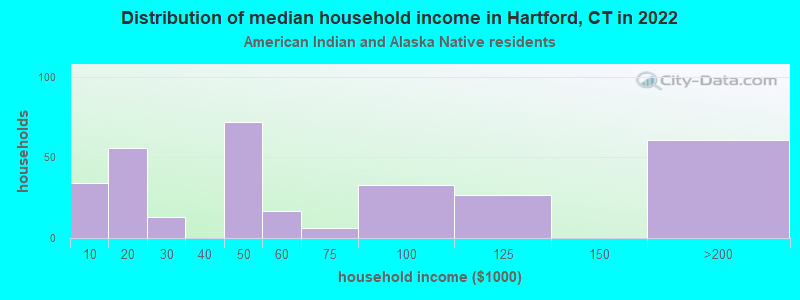
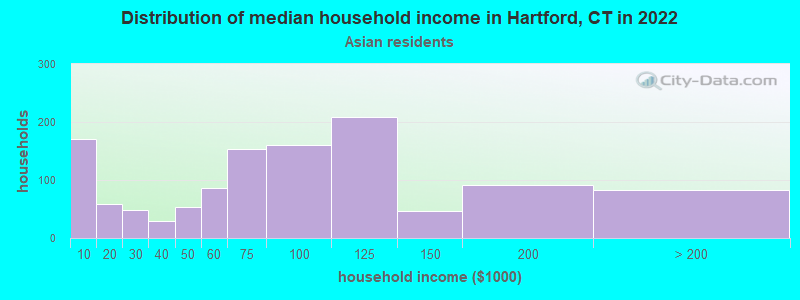
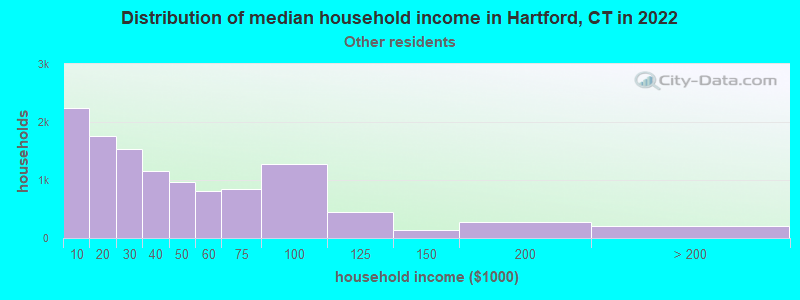
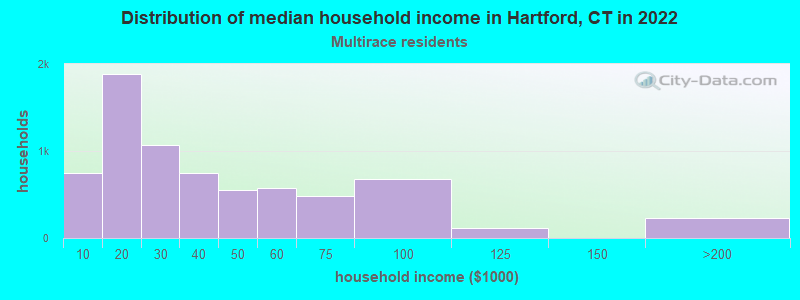
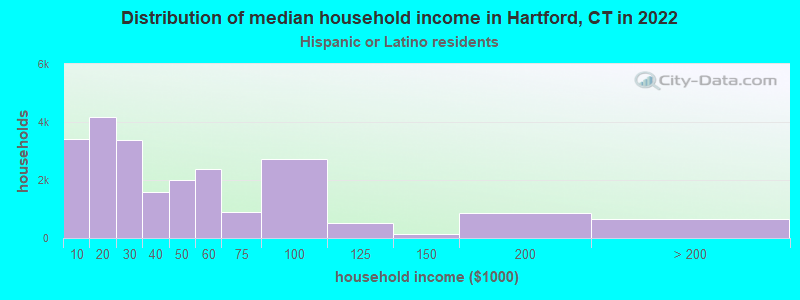
Income and house value in Hartford Median household income in 2022 $76,280 White non-Hispanic householders$42,237 Black householders$41,153 American Indian and Alaska Native householders$71,451 Asian householders$28,925 Some other race householders$27,406 Two or more races householders$31,964 Hispanic or Latino race householdersMedian 2022 house value $252,763 White Non-Hispanic householders$234,268 Black or African American householders$685,080 American Indian or Alaska Native householders $343,952 Asian householders$230,671 Some other race householders$230,928 Two or more races householders$236,323 Hispanic or Latino householders
Median age by race in Hartford
32.1 Median age for White residents29.4 38.8 35.7 Median age for Black or African American residents33.0 38.5 41.6 Median age for American Indian / Alaska Native residents-666,666,666.0 41.3 23.4 Median age for Asian residents21.2 25.5 -666,666,666.0 Median age for Native Hawaiian / Pacific Islander residents-666,666,666.0 -666,666,666.0 29.3 Median age for Other race residents26.0 32.8 32.4 Median age for Two or more races residents32.0 33.5 34.4 Median age for White alone residents32.8 42.0 29.7 Median age for Hispanic or Latino residents27.9 32.8
Owner/renter occupied households by race in Hartford
House owners and renters - White residents 3,463 26.8% Owner occupied9,453 73.2% Renter occupiedHouse owners and renters - Black or African American residents 5,265 28.3% Owner occupied13,323 71.7% Renter occupiedHouse owners and renters - American Indian / Alaska Native residents 139 47.0% Owner occupied157 53.0% Renter occupiedHouse owners and renters - Asian residents 438 30.3% Owner occupied1,008 69.7% Renter occupiedHouse owners and renters - Native Hawaiian / Pacific Islander residents 28 100.0% Renter occupiedHouse owners and renters - Other race residents 1,479 13.9% Owner occupied9,197 86.1% Renter occupiedHouse owners and renters - Two or more races residents 1,299 18.4% Owner occupied5,777 81.6% Renter occupiedHouse owners and renters - White alone residents 2,817 36.0% Owner occupied5,007 64.0% Renter occupiedHouse owners and renters - Hispanic or Latino residents 3,347 14.7% Owner occupied19,377 85.3% Renter occupied
Language usage in Hartford
English speakers - Total 58.0% of residents of Hartford speak English at home.
32.8% of residents speak Spanish at home 17,604 47.2% Speak English very well19,667 52.8% Speak English less than very well9.2% of residents speak other language at home 7,090 67.8% Speak English very well3,362 32.2% Speak English less than very well
English speakers - Born in the United States 77.1% of residents of Hartford speak English at home.
20.0% of residents speak Spanish at home 3,374 87.7% Speak English very well474 12.3% Speak English less than very well2.9% of residents speak other language at home 506 91.0% Speak English very well50 9.0% Speak English less than very well
English speakers - Native, born elsewhere 21.2% of residents of Hartford speak English at home.
78.3% of residents speak Spanish at home 6,367 39.1% Speak English very well9,906 60.9% Speak English less than very well0.5% of residents speak other language at home 110 100.0% Speak English very well
English speakers - Foreign-born 47.0% of residents of Hartford speak English at home.
29.5% of residents speak Spanish at home 2,198 21.5% Speak English very well8,044 78.5% Speak English less than very well23.6% of residents speak other language at home 4,993 61.0% Speak English very well3,193 39.0% Speak English less than very well
White (Caucasian) - Speak only English Native:
70.6% (16,724)Foreign-born:
19.1% (1,279)
White (Caucasian) - Speak another language Native:
29.4% (6,970)Foreign-born:
80.9% (5,419)
Black or African American - Speak only English Native:
94.1% (22,078)Foreign-born:
85.1% (13,905)
Black or African American - Speak another language Native:
5.9% (1,385)Foreign-born:
14.9% (2,428)
American Indian / Alaska Native - Speak only English Native:
57.3% (211)Foreign-born:
44.4% (214)
American Indian / Alaska Native - Speak another language Native:
44.6% (164)Foreign-born:
62.0% (298)
Asian - Speak only English Native:
20.9% (189)Foreign-born:
10.7% (290)
Asian - Speak another language Native:
79.1% (714)Foreign-born:
89.3% (2,414)
Other race - Speak only English Native:
31.3% (5,437)Foreign-born:
13.1% (857)
Other race - Speak another language Native:
68.7% (11,919)Foreign-born:
86.9% (5,704)
Two or more races - Speak another language Native:
61.3% (8,063)Foreign-born:
100.0% (2,463)
White alone - Speak only English Native:
92.3% (13,768)Foreign-born:
23.9% (1,152)
White alone - Speak another language Native:
7.7% (1,146)Foreign-born:
76.1% (3,659)
Hispanic or Latino - Speak only English Native:
29.9% (11,338)Foreign-born:
8.2% (889)
Hispanic or Latino - Speak another language Native:
70.1% (26,634)Foreign-born:
91.8% (9,982)
Foreign-born residents in Hartford 26,918 residents are foreign born (16.2% Latin America ).
This city:
22.1%Connecticut:
15.0%
Marital status for residents in Hartford Marital status - White (Caucasian) population 15 years and over
Males 66.5% Never married18.9% Now married3.4% Separated1.7% Widowed9.5% DivorcedFemales 56.5% Never married20.4% Now married2.1% Separated9.7% Widowed11.3% DivorcedWomen who gave birth in the past 12 months Now married:
45.6% (82)Unmarried:
54.4% (97)
Women who did not give birth in the past 12 months Now married:
17.3% (1,471)Unmarried:
82.7% (7,017)
Marital status - Black or African American population 15 years and over
Males 53.5% Never married29.0% Now married2.1% Separated4.2% Widowed11.2% DivorcedFemales 60.5% Never married20.3% Now married0.7% Separated6.3% Widowed12.3% DivorcedWomen who gave birth in the past 12 months Now married:
28.3% (72)Unmarried:
71.7% (182)
Women who did not give birth in the past 12 months Now married:
18.2% (1,866)Unmarried:
81.8% (8,405)
Marital status - American Indian / Alaska Native population 15 years and over
Males 43.7% Never married52.2% Now married0.0% Separated0.0% Widowed4.1% DivorcedFemales 49.3% Never married47.7% Now married1.0% Separated0.0% Widowed2.0% DivorcedWomen who did not give birth in the past 12 months Now married:
50.7% (137)Unmarried:
49.3% (133)
Marital status - Asian population 15 years and over
Males 60.4% Never married32.8% Now married0.0% Separated2.1% Widowed4.7% DivorcedFemales 39.7% Never married45.8% Now married0.7% Separated4.7% Widowed9.1% DivorcedWomen who gave birth in the past 12 months Now married:
100.0% (11)Unmarried:
0.0% (0)
Women who did not give birth in the past 12 months Now married:
41.7% (253)Unmarried:
58.3% (353)
Marital status - Other race population 15 years and over
Males 74.7% Never married6.4% Now married2.7% Separated1.4% Widowed14.9% DivorcedFemales 73.3% Never married4.7% Now married1.8% Separated1.5% Widowed18.7% DivorcedWomen who gave birth in the past 12 months Now married:
44.0% (203)Unmarried:
56.0% (259)
Women who did not give birth in the past 12 months Now married:
25.6% (2,193)Unmarried:
74.4% (6,384)
Marital status - Two or more races population 15 years and over
Males 57.9% Never married13.9% Now married9.6% Separated5.1% Widowed13.5% DivorcedFemales 63.1% Never married13.5% Now married1.8% Separated2.4% Widowed19.2% DivorcedWomen who gave birth in the past 12 months Now married:
33.3% (66)Unmarried:
66.7% (131)
Women who did not give birth in the past 12 months Now married:
25.2% (1,564)Unmarried:
74.8% (4,639)
Marital status - White alone, not Hispanic / Latino population 15 years and over
Males 68.0% Never married21.2% Now married2.5% Separated0.9% Widowed7.5% DivorcedFemales 53.5% Never married23.8% Now married2.6% Separated9.3% Widowed10.9% DivorcedWomen who gave birth in the past 12 months Now married:
74.2% (45)Unmarried:
25.8% (15)
Women who did not give birth in the past 12 months Now married:
16.3% (769)Unmarried:
83.7% (3,954)
Marital status - Hispanic or Latino population 15 years and over
Males 64.4% Never married12.1% Now married5.8% Separated3.2% Widowed14.5% DivorcedFemales 67.7% Never married8.8% Now married1.7% Separated3.5% Widowed18.3% DivorcedWomen who gave birth in the past 12 months Now married:
16.3% (72)Unmarried:
83.7% (369)
Women who did not give birth in the past 12 months Now married:
10.3% (1,525)Unmarried:
89.7% (13,257)
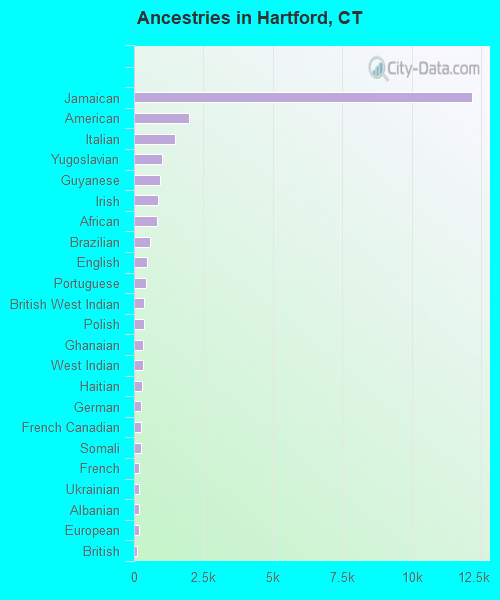
Ancestries in Hartford
12,169 14.7% Jamaican1,977 2.4% American1,465 1.8% Italian1,020 1.2% Yugoslavian940 1.1% Guyanese875 1.1% Irish845 1.0% African575 0.7% Brazilian478 0.6% English436 0.5% Portuguese357 0.4% British West Indian345 0.4% Polish326 0.4% Ghanaian312 0.4% West Indian292 0.4% Haitian249 0.3% German238 0.3% French Canadian237 0.3% Somali197 0.2% French182 0.2% Ukrainian171 0.2% Albanian163 0.2% European120 0.1% British110 0.1% Trinidadian and Tobagonian85 0.1% Nigerian83 0.10% Russian71 0.09% Hungarian58 0.07% Ethiopian58 0.07% Barbadian49 0.06% Romanian45 0.05% Eastern European42 0.05% Lithuanian40 0.05% Swedish35 0.04% Greek35 0.04% Norwegian33 0.04% Arab31 0.04% South African29 0.03% Afghan25 0.03% Belgian24 0.03% Northern European23 0.03% Moroccan20 0.02% Armenian20 0.02% Canadian19 0.02% Senegalese16 0.02% Lebanese16 0.02% Scottish16 0.02% Iranian14 0.02% Egyptian11 0.01% Bulgarian10 0.01% U.S. Virgin Islander9 0.01% Croatian9 0.01% Slavic5 0.01% Scotch-Irish5 0.01% Belizean
Geographical mobility in Hartford Same house 1 year ago 21,718 70.1% White (Caucasian)34,944 84.1% Black or African American619 74.2% American Indian / Alaska Native3,600 84.1% Asian110 100.0% Native Hawaiian / Pacific Islander22,591 86.3% Other race19,250 82.9% Two or more races14,048 70.8% White alone, not Hispanic / Latino48,128 83.5% Hispanic or LatinoMoved within same county 5,712 18.4% White / Caucasian3,908 9.4% Black or African American50 6.0% American Indian / Alaska Native73 1.7% Asian3,246 12.4% Other race2,547 11.0% Two or more races2,864 14.4% White alone, not Hispanic / Latino5,803 10.1% Hispanic or LatinoMoved within same state 556 1.8% White / Caucasian166 0.4% Black or African American52 1.2% Asian51 0.2% Other race438 1.9% Two or more races556 2.8% White alone, not Hispanic / Latino442 0.8% Hispanic or LatinoMoved from different state 2,923 9.4% White / Caucasian2,231 5.4% Black or African American197 23.7% American Indian / Alaska Native222 5.2% Asian302 1.2% Other race270 1.2% Two or more races2,275 11.5% White alone, not Hispanic / Latino1,621 2.8% Hispanic or LatinoMoved from abroad 92 0.3% White303 0.7% Black or African American332 7.8% Asian395 1.7% Two or more races92 0.5% White alone, not Hispanic / Latino945 1.6% Hispanic or Latino
Children Nativity (place of birth) in Hartford
Children under 6 years - Living with two parents Both parents native 190 100.0% NativeBoth parents foreign-born 152 84.4% Native28 15.6% Foreign-bornOne native, one foreign-born parent 238 100.0% NativeChildren under 6 years - Living with one parent Native parent 4,094 100.0% NativeForeign-born parent 1,739 71.0% Native710 29.0% Foreign-bornChildren 6 to 17 years - Living with two parents Both parents native 1,416 100.0% NativeBoth parents foreign-born 1,283 63.9% Native725 36.1% Foreign-bornOne native, one foreign-born parent 184 100.0% NativeChildren 6 to 17 years - Living with one parent Native parent 7,553 100.0% NativeForeign-born parent 3,389 66.0% Native1,745 34.0% Foreign-born
Place of birth for residents in Hartford 20,689 Americas20,477 Latin America12,960 Caribbean4,929 South America2,737 Europe2,587 Central America2,286 Asia1,551 Eastern Europe1,205 Africa1,114 South Central Asia718 Southern Europe671 South Eastern Asia590 Western Africa330 Eastern Asia305 Northern Europe280 China230 Eastern Africa211 Northern America168 Western Asia162 Western Europe143 Northern Africa109 Middle Africa9,290 Jamaica2,384 Dominican Republic1,594 Peru1,099 Colombia1,038 Mexico1,022 Bosnia and Herzegovina929 India868 Guyana762 Guatemala576 Brazil420 Honduras362 Portugal335 Cuba315 El Salvador296 Venezuela270 Togo259 Italy219 China217 Trinidad and Tobago214 Ghana211 Canada188 Ecuador165 St. Lucia162 England161 Burma (Myanmar)159 Philippines155 Poland143 Haiti133 Kuwait123 Chile121 Barbados119 Vietnam116 Albania115 Bahamas108 Sudan106 Germany102 Thailand96 Greece96 Ukraine92 United Kingdom86 Uruguay75 Malaysia68 Russia66 Moldova60 Taiwan58 Pakistan58 Cameroon54 Somalia51 Ireland50 Laos40 West Indies39 Sri Lanka39 Democratic Republic of Congo (Zaire)38 Korea32 Bolivia31 Dominica29 Belize28 Nigeria27 Iraq27 Belgium26 Argentina26 Morocco24 Nepal23 Bhutan21 Nicaragua20 Iran18 Afghanistan17 Romania17 Kenya15 France12 Austria11 Japan10 Cabo Verde8 Egypt4 Israel4 Cambodia3 Turkey
Grandparents responsible for own grandchildren in Hartford
Grandparents (30 to 59 years) White / Caucasian 138 64.7% Responsible for grandchildren76 35.3% Not responsible for grandchildrenBlack or African American 155 39.6% Responsible for grandchildren237 60.4% Not responsible for grandchildrenAsian 9 100.0% Not responsible for grandchildrenOther race 61 14.0% Responsible for grandchildren377 86.0% Not responsible for grandchildrenTwo or more races 23 11.6% Responsible for grandchildren172 88.4% Not responsible for grandchildrenWhite alone, not Hispanic / Latino 38 100.0% Responsible for grandchildrenHispanic or Latino 266 37.5% Responsible for grandchildren443 62.5% Not responsible for grandchildrenGrandparents (60 years and over) White / Caucasian 34 15.0% Responsible for grandchildren191 85.0% Not responsible for grandchildrenBlack or African American 127 18.7% Responsible for grandchildren551 81.3% Not responsible for grandchildrenAsian 39 100.0% Not responsible for grandchildrenOther race 48 11.0% Responsible for grandchildren386 89.0% Not responsible for grandchildrenTwo or more races 147 100.0% Not responsible for grandchildrenWhite alone, not Hispanic / Latino 19 19.5% Responsible for grandchildren77 80.5% Not responsible for grandchildrenHispanic or Latino 49 7.3% Responsible for grandchildren624 92.7% Not responsible for grandchildren