Races in Hanover, Pennsylvania (PA) Detailed Stats
Data:
Races - White alone (%)
Races - White alone (% change since 2000)
Races - Black alone (%)
Races - Black alone (% change since 2000)
Races - American Indian alone (%)
Races - American Indian alone (% change since 2000)
Races - Asian alone (%)
Races - Asian alone (% change since 2000)
Races - Hispanic (%)
Races - Hispanic (% change since 2000)
Races - Native Hawaiian and Other Pacific Islander alone (%)
Races - Native Hawaiian and Other Pacific Islander alone (% change since 2000)
Races - Two or more races(%)
Races - Two or more races(% change since 2000)
Races - Other race alone (%)
Races - Other race alone (% change since 2000)
Racial diversity
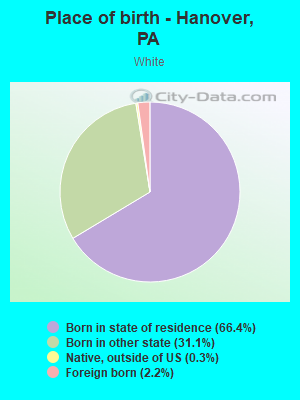
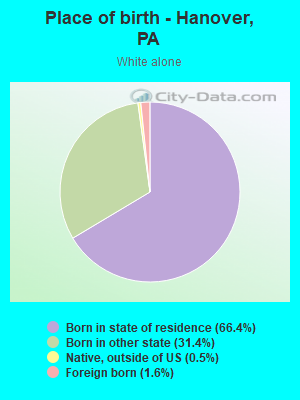
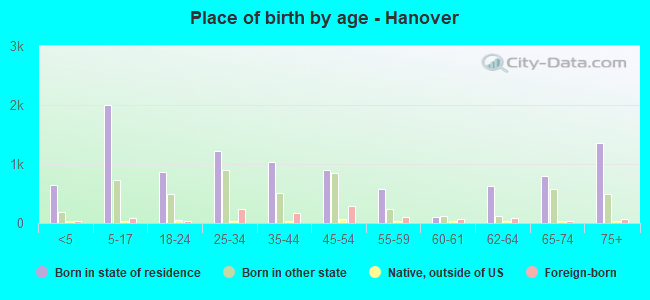
Place of birth - Born in state of residence (%)
Place of birth - Born in state of residence (%) - White
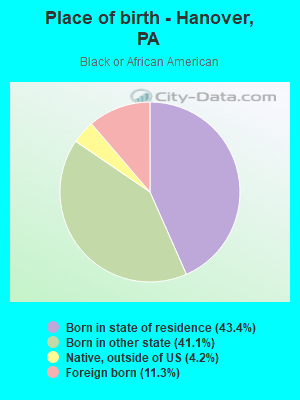
Place of birth - Born in state of residence (%) - Black or African American
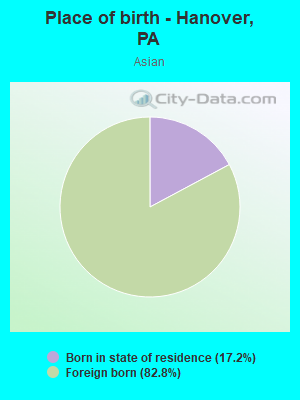
Place of birth - Born in state of residence (%) - Asian
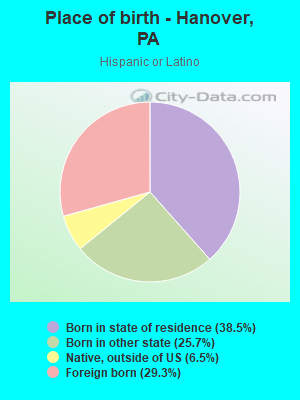
Place of birth - Born in state of residence (%) - Hispanic or Latino
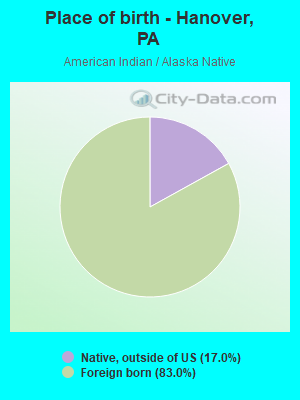
Place of birth - Born in state of residence (%) - American Indian and Alaska Native
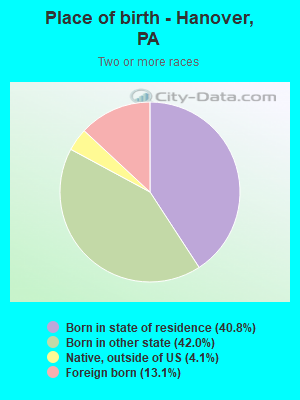
Place of birth - Born in state of residence (%) - Multirace
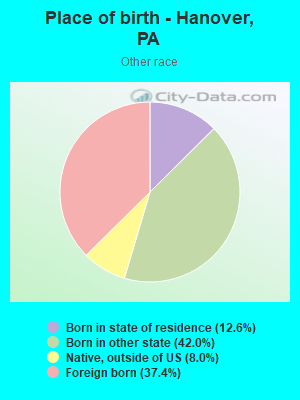
Place of birth - Born in state of residence (%) - Other Race
Place of birth - Born in other state (%)
Place of birth - Born in other state (%) - White
Place of birth - Born in other state (%) - Black or African American
Place of birth - Born in other state (%) - Asian
Place of birth - Born in other state (%) - Hispanic or Latino
Place of birth - Born in other state (%) - American Indian and Alaska Native
Place of birth - Born in other state (%) - Multirace
Place of birth - Born in other state (%) - Other Race
Place of birth - Native, outside of US (%)
Place of birth - Native, outside of US (%) - White
Place of birth - Native, outside of US (%) - Black or African American
Place of birth - Native, outside of US (%) - Asian
Place of birth - Native, outside of US (%) - Hispanic or Latino
Place of birth - Native, outside of US (%) - American Indian and Alaska Native
Place of birth - Native, outside of US (%) - Multirace
Place of birth - Native, outside of US (%) - Other Race
Place of birth - Foreign born (%)
Place of birth - Foreign born (%) - White
Place of birth - Foreign born (%) - Black or African American
Place of birth - Foreign born (%) - Asian
Place of birth - Foreign born (%) - Hispanic or Latino
Place of birth - Foreign born (%) - American Indian and Alaska Native
Place of birth - Foreign born (%) - Multirace
Place of birth - Foreign born (%) - Other Race
Residents speaking English at home (%)
Residents speaking English at home - Born in the United States (%)
Residents speaking English at home - Native, born elsewhere (%)
Residents speaking English at home - Foreign born (%)
Residents speaking Spanish at home (%)
Residents speaking Spanish at home - Born in the United States (%)
Residents speaking Spanish at home - Native, born elsewhere (%)
Residents speaking Spanish at home - Foreign born (%)
Residents speaking other language at home (%)
Residents speaking other language at home - Born in the United States (%)
Residents speaking other language at home - Native, born elsewhere (%)
Residents speaking other language at home - Foreign born (%)
Marital status - Never married (%)
Marital status - Now married (%)
Marital status - Separated (%)
Marital status - Widowed (%)
Marital status - Divorced (%)
Ancestries Reported - Arab (%)
Ancestries Reported - Czech (%)
Ancestries Reported - Danish (%)
Ancestries Reported - Dutch (%)
Ancestries Reported - English (%)
Ancestries Reported - French (%)
Ancestries Reported - French Canadian (%)
Ancestries Reported - German (%)
Ancestries Reported - Greek (%)
Ancestries Reported - Hungarian (%)
Ancestries Reported - Irish (%)
Ancestries Reported - Italian (%)
Ancestries Reported - Lithuanian (%)
Ancestries Reported - Norwegian (%)
Ancestries Reported - Polish (%)
Ancestries Reported - Portuguese (%)
Ancestries Reported - Russian (%)
Ancestries Reported - Scotch-Irish (%)
Ancestries Reported - Scottish (%)
Ancestries Reported - Slovak (%)
Ancestries Reported - Subsaharan African (%)
Ancestries Reported - Swedish (%)
Ancestries Reported - Swiss (%)
Ancestries Reported - Ukrainian (%)
Ancestries Reported - United States (%)
Ancestries Reported - Welsh (%)
Ancestries Reported - West Indian (%)
Ancestries Reported - Other (%)
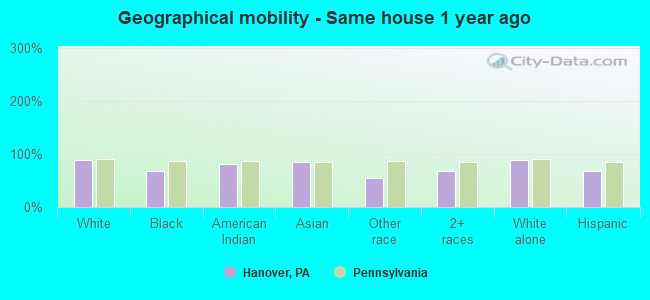
Geographical mobility - Same house 1 year ago (%)
Geographical mobility - Same house 1 year ago (%) - White
Geographical mobility - Same house 1 year ago (%) - Black or African American
Geographical mobility - Same house 1 year ago (%) - Asian
Geographical mobility - Same house 1 year ago (%) - Hispanic or Latino
Geographical mobility - Same house 1 year ago (%) - American Indian and Alaska Native
Geographical mobility - Same house 1 year ago (%) - Multirace
Geographical mobility - Same house 1 year ago (%) - Other Race
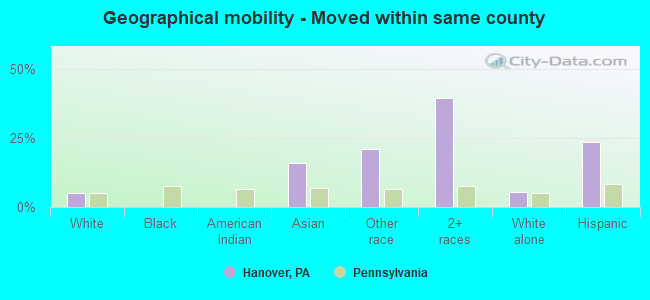
Geographical mobility - Moved within same county (%)
Geographical mobility - Moved within same county (%) - White
Geographical mobility - Moved within same county (%) - Black or African American
Geographical mobility - Moved within same county (%) - Asian
Geographical mobility - Moved within same county (%) - Hispanic or Latino
Geographical mobility - Moved within same county (%) - American Indian and Alaska Native
Geographical mobility - Moved within same county (%) - Multirace
Geographical mobility - Moved within same county (%) - Other Race
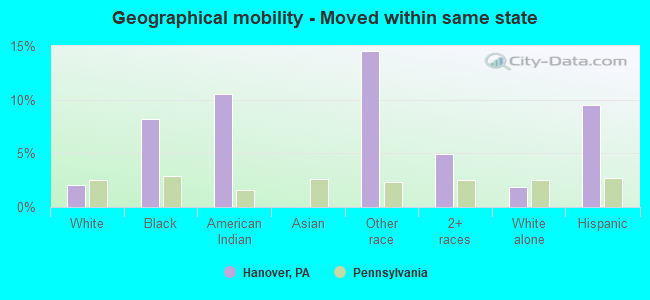
Geographical mobility - Moved from different county within same state (%)
Geographical mobility - Moved from different county within same state (%) - White
Geographical mobility - Moved from different county within same state (%) - Black or African American
Geographical mobility - Moved from different county within same state (%) - Asian
Geographical mobility - Moved from different county within same state (%) - Hispanic or Latino
Geographical mobility - Moved from different county within same state (%) - American Indian and Alaska Native
Geographical mobility - Moved from different county within same state (%) - Multirace
Geographical mobility - Moved from different county within same state (%) - Other Race
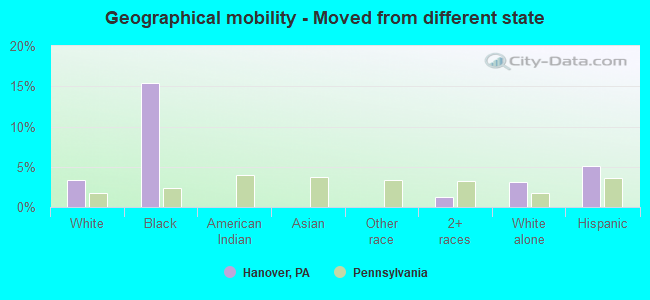
Geographical mobility - Moved from different state (%)
Geographical mobility - Moved from different state (%) - White
Geographical mobility - Moved from different state (%) - Black or African American
Geographical mobility - Moved from different state (%) - Asian
Geographical mobility - Moved from different state (%) - Hispanic or Latino
Geographical mobility - Moved from different state (%) - American Indian and Alaska Native
Geographical mobility - Moved from different state (%) - Multirace
Geographical mobility - Moved from different state (%) - Other Race
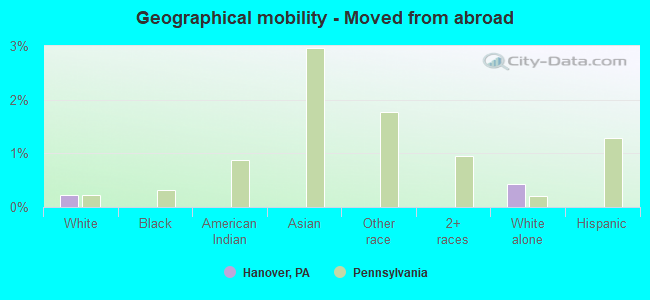
Geographical mobility - Moved from abroad (%)
Geographical mobility - Moved from abroad (%) - White
Geographical mobility - Moved from abroad (%) - Black or African American
Geographical mobility - Moved from abroad (%) - Asian
Geographical mobility - Moved from abroad (%) - Hispanic or Latino
Geographical mobility - Moved from abroad (%) - American Indian and Alaska Native
Geographical mobility - Moved from abroad (%) - Multirace
Geographical mobility - Moved from abroad (%) - Other Race
Place of birth for the foreign-born population - Ireland (%)
Place of birth for the foreign-born population - Denmark (%)
Place of birth for the foreign-born population - Norway (%)
Place of birth for the foreign-born population - Sweden (%)
Place of birth for the foreign-born population - United Kingdom (%)
Place of birth for the foreign-born population - England (%)
Place of birth for the foreign-born population - Scotland (%)
Place of birth for the foreign-born population - Other Northern Europe (%)
Place of birth for the foreign-born population - Austria (%)
Place of birth for the foreign-born population - Belgium (%)
Place of birth for the foreign-born population - France (%)
Place of birth for the foreign-born population - Germany (%)
Place of birth for the foreign-born population - Netherlands (%)
Place of birth for the foreign-born population - Switzerland (%)
Place of birth for the foreign-born population - Other Western Europe (%)
Place of birth for the foreign-born population - Greece (%)
Place of birth for the foreign-born population - Italy (%)
Place of birth for the foreign-born population - Portugal (%)
Place of birth for the foreign-born population - Spain (%)
Place of birth for the foreign-born population - Other Southern Europe (%)
Place of birth for the foreign-born population - Albania (%)
Place of birth for the foreign-born population - Belarus (%)
Place of birth for the foreign-born population - Bosnia and Herzegovina (%)
Place of birth for the foreign-born population - Bulgaria (%)
Place of birth for the foreign-born population - Croatia (%)
Place of birth for the foreign-born population - Czechoslovakia (%)
Place of birth for the foreign-born population - Hungary (%)
Place of birth for the foreign-born population - Latvia (%)
Place of birth for the foreign-born population - Lithuania (%)
Place of birth for the foreign-born population - North Macedonia (Macedonia) (%)
Place of birth for the foreign-born population - Moldova (%)
Place of birth for the foreign-born population - Poland (%)
Place of birth for the foreign-born population - Romania (%)
Place of birth for the foreign-born population - Russia (%)
Place of birth for the foreign-born population - Serbia (%)
Place of birth for the foreign-born population - Ukraine (%)
Place of birth for the foreign-born population - Other Eastern Europe (%)
Place of birth for the foreign-born population - China (%)
Place of birth for the foreign-born population - Hong Kong (%)
Place of birth for the foreign-born population - Taiwan (%)
Place of birth for the foreign-born population - Japan (%)
Place of birth for the foreign-born population - Korea (%)
Place of birth for the foreign-born population - Other Eastern Asia (%)
Place of birth for the foreign-born population - Afghanistan (%)
Place of birth for the foreign-born population - Bangladesh (%)
Place of birth for the foreign-born population - India (%)
Place of birth for the foreign-born population - Iran (%)
Place of birth for the foreign-born population - Kazakhstan (%)
Place of birth for the foreign-born population - Nepal (%)
Place of birth for the foreign-born population - Pakistan (%)
Place of birth for the foreign-born population - Sri Lanka (%)
Place of birth for the foreign-born population - Uzbekistan (%)
Place of birth for the foreign-born population - Other South Central Asia (%)
Place of birth for the foreign-born population - Burma (%)
Place of birth for the foreign-born population - Cambodia (%)
Place of birth for the foreign-born population - Indonesia (%)
Place of birth for the foreign-born population - Laos (%)
Place of birth for the foreign-born population - Malaysia (%)
Place of birth for the foreign-born population - Philippines (%)
Place of birth for the foreign-born population - Singapore (%)
Place of birth for the foreign-born population - Thailand (%)
Place of birth for the foreign-born population - Vietnam (%)
Place of birth for the foreign-born population - Other South Eastern Asia (%)
Place of birth for the foreign-born population - Armenia (%)
Place of birth for the foreign-born population - Iraq (%)
Place of birth for the foreign-born population - Israel (%)
Place of birth for the foreign-born population - Jordan (%)
Place of birth for the foreign-born population - Kuwait (%)
Place of birth for the foreign-born population - Lebanon (%)
Place of birth for the foreign-born population - Saudi Arabia (%)
Place of birth for the foreign-born population - Syria (%)
Place of birth for the foreign-born population - Turkey (%)
Place of birth for the foreign-born population - Yemen (%)
Place of birth for the foreign-born population - Other Western Asia (%)
Place of birth for the foreign-born population - Eritrea (%)
Place of birth for the foreign-born population - Ethiopia (%)
Place of birth for the foreign-born population - Kenya (%)
Place of birth for the foreign-born population - Somalia (%)
Place of birth for the foreign-born population - Uganda (%)
Place of birth for the foreign-born population - Zimbabwe (%)
Place of birth for the foreign-born population - Other Eastern Africa (%)
Place of birth for the foreign-born population - Cameroon (%)
Place of birth for the foreign-born population - Congo (%)
Place of birth for the foreign-born population - Democratic Republic of Congo (Zaire) (%)
Place of birth for the foreign-born population - Other Middle Africa (%)
Place of birth for the foreign-born population - Egypt (%)
Place of birth for the foreign-born population - Morocco (%)
Place of birth for the foreign-born population - Sudan (%)
Place of birth for the foreign-born population - Other Northern Africa (%)
Place of birth for the foreign-born population - South Africa (%)
Place of birth for the foreign-born population - Other Southern Africa (%)
Place of birth for the foreign-born population - Cabo Verde (%)
Place of birth for the foreign-born population - Ghana (%)
Place of birth for the foreign-born population - Liberia (%)
Place of birth for the foreign-born population - Nigeria (%)
Place of birth for the foreign-born population - Senegal (%)
Place of birth for the foreign-born population - Sierra Leone (%)
Place of birth for the foreign-born population - Other Western Africa (%)
Place of birth for the foreign-born population - Australia (%)
Place of birth for the foreign-born population - New Zealand (%)
Place of birth for the foreign-born population - Fiji (%)
Place of birth for the foreign-born population - Micronesia (%)
Place of birth for the foreign-born population - Bahamas (%)
Place of birth for the foreign-born population - Barbados (%)
Place of birth for the foreign-born population - Cuba (%)
Place of birth for the foreign-born population - Dominica (%)
Place of birth for the foreign-born population - Dominican Republic (%)
Place of birth for the foreign-born population - Grenada (%)
Place of birth for the foreign-born population - Haiti (%)
Place of birth for the foreign-born population - Jamaica (%)
Place of birth for the foreign-born population - St. Vincent and the Grenadines (%)
Place of birth for the foreign-born population - Trinidad and Tobago (%)
Place of birth for the foreign-born population - West Indies (%)
Place of birth for the foreign-born population - Other Caribbean (%)
Place of birth for the foreign-born population - Belize (%)
Place of birth for the foreign-born population - Costa Rica (%)
Place of birth for the foreign-born population - El Salvador (%)
Place of birth for the foreign-born population - Guatemala (%)
Place of birth for the foreign-born population - Honduras (%)
Place of birth for the foreign-born population - Mexico (%)
Place of birth for the foreign-born population - Nicaragua (%)
Place of birth for the foreign-born population - Panama (%)
Place of birth for the foreign-born population - Other Central America (%)
Place of birth for the foreign-born population - Argentina (%)
Place of birth for the foreign-born population - Bolivia (%)
Place of birth for the foreign-born population - Brazil (%)
Place of birth for the foreign-born population - Chile (%)
Place of birth for the foreign-born population - Colombia (%)
Place of birth for the foreign-born population - Ecuador (%)
Place of birth for the foreign-born population - Guyana (%)
Place of birth for the foreign-born population - Peru (%)
Place of birth for the foreign-born population - Uruguay (%)
Place of birth for the foreign-born population - Venezuela (%)
Place of birth for the foreign-born population - Other South America (%)
Place of birth for the foreign-born population - Canada (%)
Place of birth for the foreign-born population - Other Northern America (%)
Place of birth for the foreign-born population - Other (%)
Latest news about races in Hanover, PA collected exclusively by city-data.com from local newspapers, TV, and radio stations
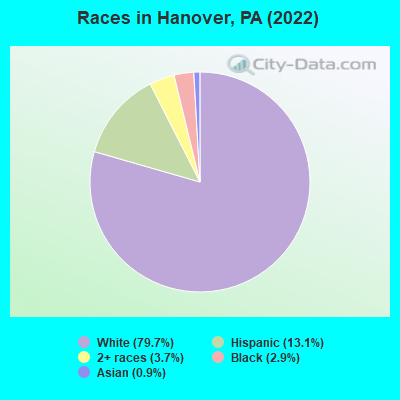
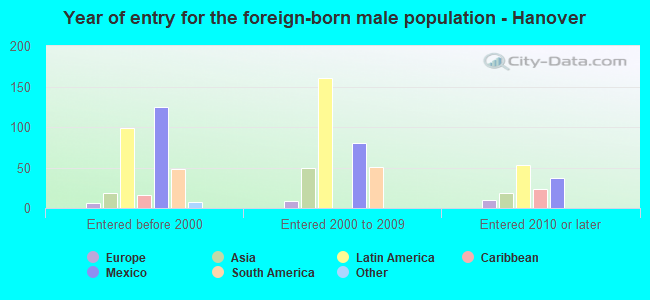
According to 2022 data, the most numerous races in Hanover, PA are White alone (13,195 residents), Black alone (484 residents), and Hispanic (2,166 residents). 87.2% of Hanover residents speak English at home. 5.9% of Hanover, PA residents are foreign-born (4.3% born in Latin America, 0.7% born in Asia, 0.7% born in Europe), which is 18.1% less than the foreign-born rate of 7.0% across the entire state of Pennsylvania.
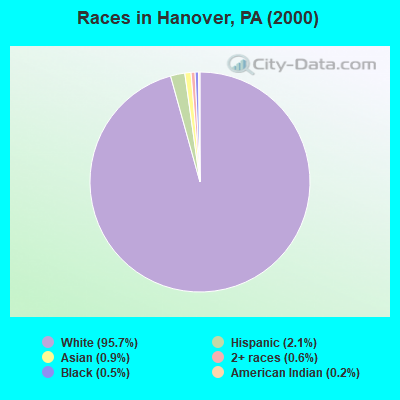
Race distribution in Hanover
2000 2022
10,322,455 84.1% White alone 1,202,437 9.8% Black alone 394,088 3.2% Hispanic 218,296 1.8% Asian alone 113,097 0.9% Two or more races 13,086 0.1% Other race alone 14,904 0.1% American Indian alone 2,691 0.02% Native Hawaiian and Other
9,487,228 73.1% White alone 1,311,581 10.1% Black alone 1,115,997 8.6% Hispanic 493,942 3.8% Two or more races 487,124 3.8% Asian alone 63,582 0.5% Other race alone 10,130 0.08% American Indian alone 2,424 0.02% Native Hawaiian and Other
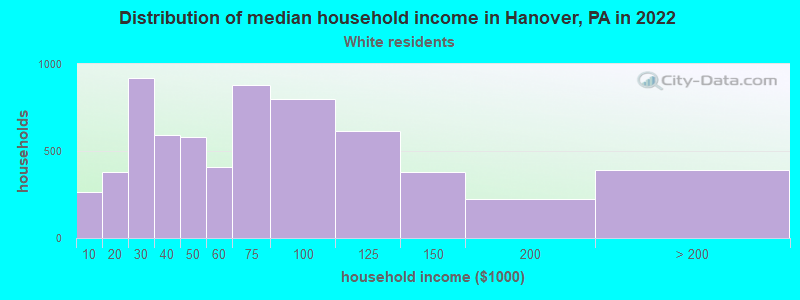
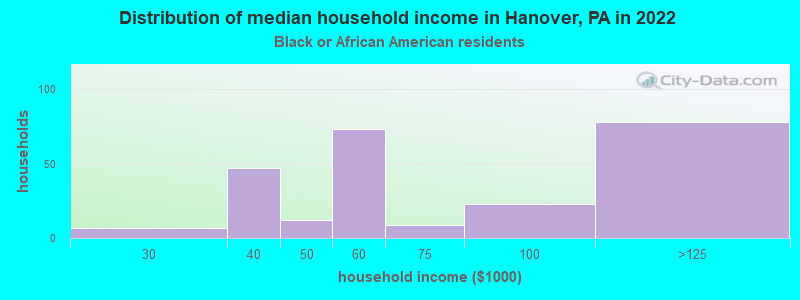
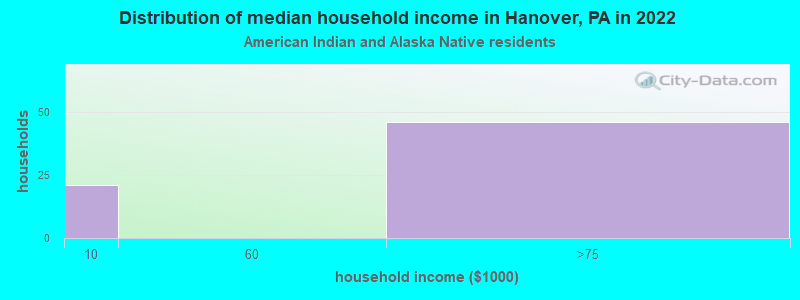
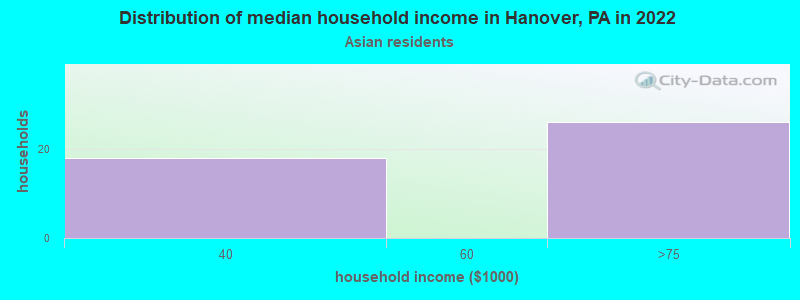
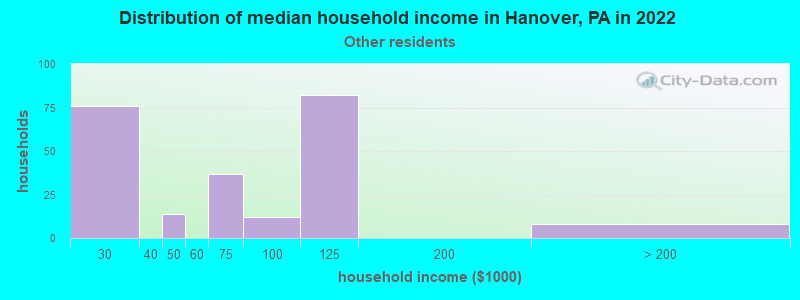
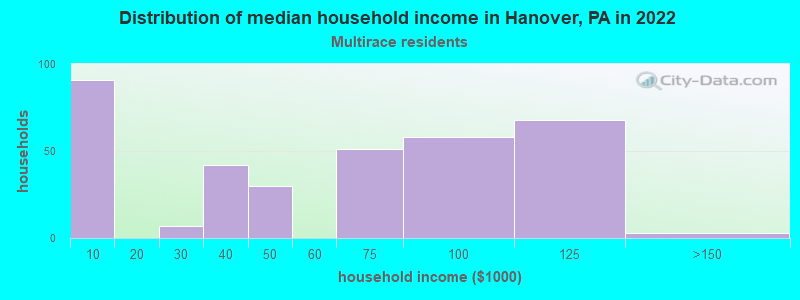
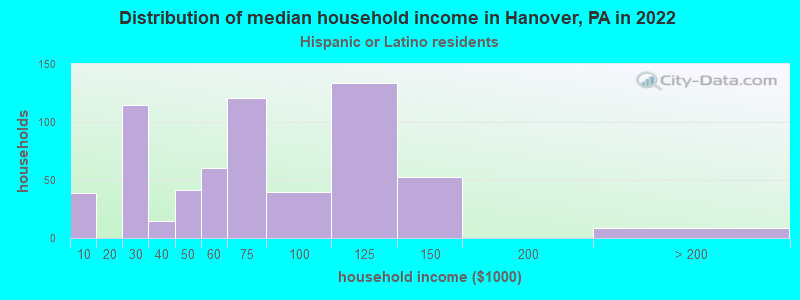
Income and house value in Hanover Median household income in 2022 $59,695 White non-Hispanic householders$45,834 Black householders$78,029 Asian householders$58,249 Two or more races householders$78,609 Hispanic or Latino race householdersMedian 2022 house value $193,192 White Non-Hispanic householders$89,349 American Indian or Alaska Native householders $273,011 Asian householders$188,625 Two or more races householders$302,794 Hispanic or Latino householders
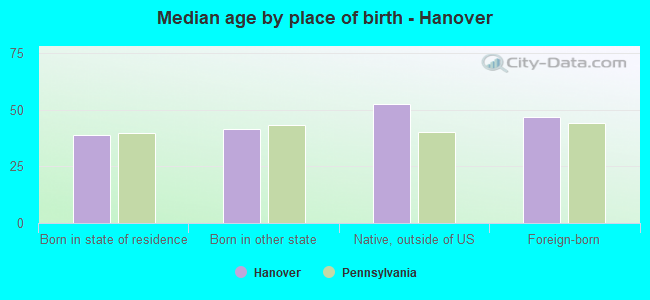
Median age by race in Hanover
44.7 Median age for White residents39.1 52.2 28.9 Median age for Black or African American residents48.9 28.5 44.2 Median age for American Indian / Alaska Native residents-714,900,946.7 -795,833,332.5 32.4 Median age for Asian residents20.1 31.5 -680,432,644.4 Median age for Native Hawaiian / Pacific Islander residents-649,523,808.9 -747,474,746.7 24.0 Median age for Other race residents20.2 25.3 18.4 Median age for Two or more races residents14.7 22.4 45.6 Median age for White alone residents40.8 53.6 22.1 Median age for Hispanic or Latino residents19.9 23.4
Owner/renter occupied households by race in Hanover
House owners and renters - White residents 3,865 59.8% Owner occupied2,599 40.2% Renter occupiedHouse owners and renters - Black or African American residents 65 30.8% Owner occupied145 69.2% Renter occupiedHouse owners and renters - American Indian / Alaska Native residents 78 100.0% Renter occupiedHouse owners and renters - Asian residents 23 69.1% Owner occupied10 30.9% Renter occupiedHouse owners and renters - Other race residents 174 62.6% Owner occupied104 37.4% Renter occupiedHouse owners and renters - Two or more races residents 184 52.2% Owner occupied169 47.8% Renter occupiedHouse owners and renters - White alone residents 3,805 59.2% Owner occupied2,625 40.8% Renter occupiedHouse owners and renters - Hispanic or Latino residents 308 51.2% Owner occupied294 48.8% Renter occupied
Language usage in Hanover
English speakers - Total 87.2% of residents of Hanover speak English at home.
11.8% of residents speak Spanish at home 1,198 64.4% Speak English very well663 35.6% Speak English less than very well1.4% of residents speak other language at home 148 68.2% Speak English very well69 31.8% Speak English less than very well
English speakers - Born in the United States 90.7% of residents of Hanover speak English at home.
9.7% of residents speak Spanish at home 474 96.9% Speak English very well15 3.1% Speak English less than very well
English speakers - Native, born elsewhere 49.0% of residents of Hanover speak English at home.
50.0% of residents speak Spanish at home 30 30.0% Speak English very well70 70.0% Speak English less than very well
English speakers - Foreign-born 10.4% of residents of Hanover speak English at home.
74.3% of residents speak Spanish at home 290 35.5% Speak English very well527 64.5% Speak English less than very well16.9% of residents speak other language at home 125 67.2% Speak English very well61 32.8% Speak English less than very well
White (Caucasian) - Speak only English Native:
97.7% (12,475)Foreign-born:
14.2% (41)
White (Caucasian) - Speak another language Native:
2.3% (294)Foreign-born:
86.0% (251)
Black or African American - Speak only English Native:
81.5% (358)Foreign-born:
34.8% (21)
Black or African American - Speak another language Native:
27.0% (118)Foreign-born:
26.0% (16)
Asian - Speak only English Native:
93.5% (14)Foreign-born:
38.4% (46)
Other race - Speak another language Native:
83.9% (476)Foreign-born:
100.0% (394)
Two or more races - Speak another language Native:
38.2% (348)Foreign-born:
100.0% (195)
White alone - Speak only English Native:
98.2% (12,312)Foreign-born:
21.7% (46)
White alone - Speak another language Native:
1.8% (227)Foreign-born:
78.8% (168)
Hispanic or Latino - Speak another language Native:
62.2% (817)Foreign-born:
100.0% (666)
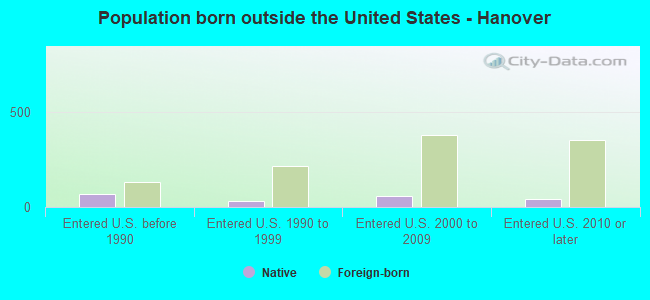
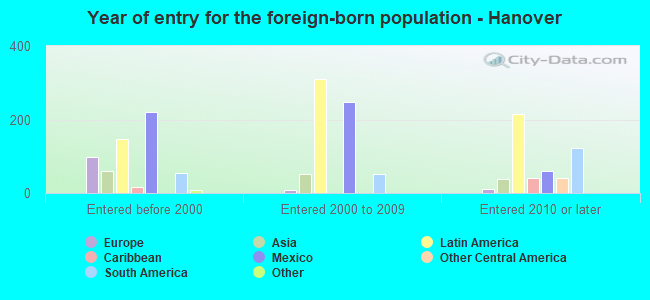
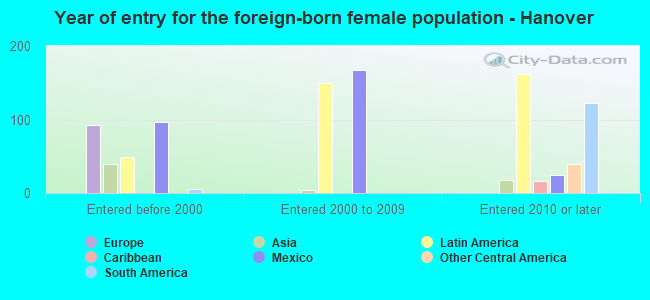
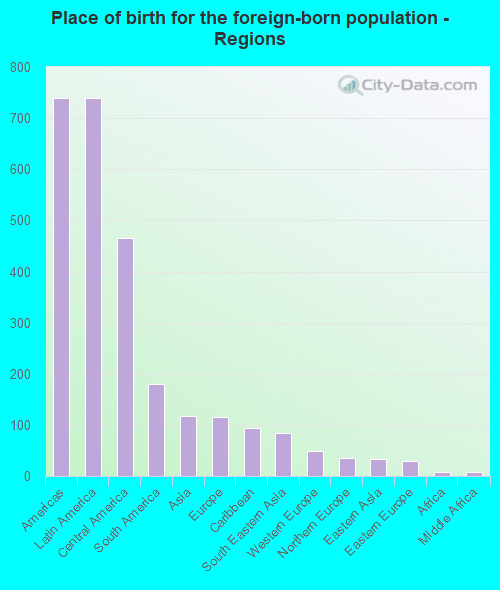
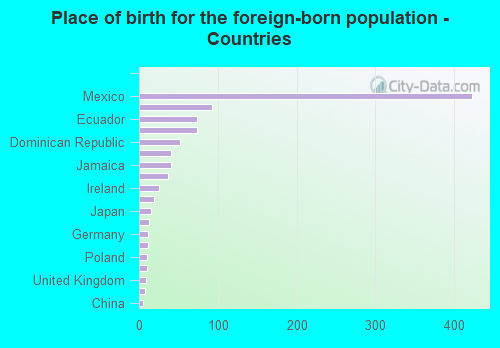
Foreign-born residents in Hanover 981 residents are foreign born (4.3% Latin America , 0.7% Asia , 0.7% Europe ).
This city:
5.9%Pennsylvania:
7.3%
Marital status for residents in Hanover Marital status - White (Caucasian) population 15 years and over
Males 35.9% Never married44.7% Now married2.6% Separated3.9% Widowed12.8% DivorcedFemales 22.3% Never married39.6% Now married3.8% Separated16.8% Widowed17.5% DivorcedWomen who gave birth in the past 12 months Now married:
100.0% (58)Unmarried:
0.0% (0)
Women who did not give birth in the past 12 months Now married:
40.2% (945)Unmarried:
59.8% (1,405)
Marital status - Black or African American population 15 years and over
Males 27.3% Never married51.5% Now married6.7% Separated0.0% Widowed14.5% DivorcedFemales 100.0% Never married0.0% Now married0.0% Separated0.0% Widowed0.0% DivorcedWomen who gave birth in the past 12 months Now married:
0.0% (0)Unmarried:
100.0% (11)
Women who did not give birth in the past 12 months Now married:
0.0% (0)Unmarried:
100.0% (198)
Marital status - American Indian / Alaska Native population 15 years and over
Males 30.0% Never married70.0% Now married0.0% Separated0.0% Widowed0.0% DivorcedFemales 0.0% Never married100.0% Now married0.0% Separated0.0% Widowed0.0% DivorcedWomen who did not give birth in the past 12 months Now married:
100.0% (58)Unmarried:
0.0% (0)
Marital status - Asian population 15 years and over
Males 24.1% Never married59.3% Now married16.7% Separated0.0% Widowed0.0% DivorcedFemales 0.0% Never married65.7% Now married0.0% Separated34.3% Widowed0.0% DivorcedWomen who gave birth in the past 12 months Now married:
100.0% (11)Unmarried:
0.0% (0)
Women who did not give birth in the past 12 months Now married:
100.0% (4)Unmarried:
0.0% (0)
Marital status - Other race population 15 years and over
Males 53.2% Never married46.8% Now married0.0% Separated0.0% Widowed0.0% DivorcedFemales 47.7% Never married38.8% Now married0.0% Separated0.0% Widowed13.6% DivorcedWomen who gave birth in the past 12 months Now married:
100.0% (15)Unmarried:
0.0% (0)
Women who did not give birth in the past 12 months Now married:
20.2% (60)Unmarried:
79.8% (236)
Marital status - Two or more races population 15 years and over
Males 44.6% Never married48.4% Now married0.0% Separated0.0% Widowed7.0% DivorcedFemales 61.8% Never married20.5% Now married2.0% Separated3.3% Widowed12.3% DivorcedWomen who gave birth in the past 12 months Now married:
100.0% (49)Unmarried:
0.0% (0)
Women who did not give birth in the past 12 months Now married:
14.8% (79)Unmarried:
85.2% (452)
Marital status - White alone, not Hispanic / Latino population 15 years and over
Males 35.4% Never married45.6% Now married2.5% Separated4.1% Widowed12.4% DivorcedFemales 22.1% Never married39.5% Now married3.9% Separated16.9% Widowed17.6% DivorcedWomen who gave birth in the past 12 months Now married:
100.0% (59)Unmarried:
0.0% (0)
Women who did not give birth in the past 12 months Now married:
39.7% (917)Unmarried:
60.3% (1,394)
Marital status - Hispanic or Latino population 15 years and over
Males 43.7% Never married44.0% Now married1.9% Separated0.0% Widowed10.3% DivorcedFemales 52.0% Never married31.2% Now married1.3% Separated2.2% Widowed13.3% DivorcedWomen who gave birth in the past 12 months Now married:
100.0% (47)Unmarried:
0.0% (0)
Women who did not give birth in the past 12 months Now married:
23.4% (141)Unmarried:
76.6% (460)
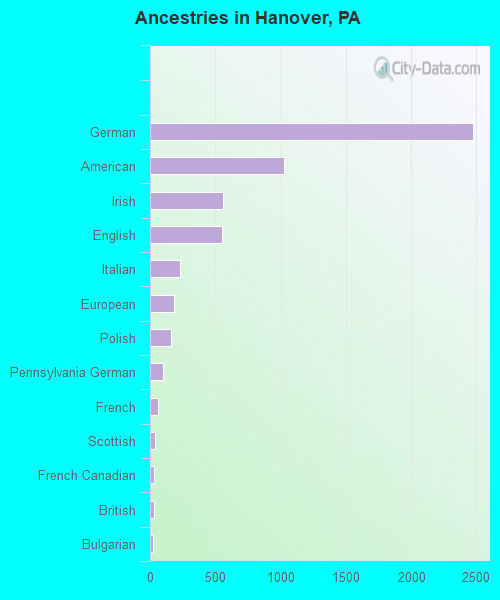
Ancestries in Hanover
2,473 33.3% German1,024 13.8% American559 7.5% Irish550 7.4% English233 3.1% Italian183 2.5% European160 2.2% Polish97 1.3% Pennsylvania German62 0.8% French36 0.5% Scottish30 0.4% French Canadian28 0.4% British26 0.4% Bulgarian21 0.3% Lithuanian21 0.3% Luxembourger15 0.2% Australian11 0.1% Yugoslavian9 0.1% Greek8 0.1% Austrian8 0.1% Welsh
Children Nativity (place of birth) in Hanover
Children under 6 years - Living with two parents Both parents native 287 100.0% NativeBoth parents foreign-born 256 100.0% NativeOne native, one foreign-born parent 85 100.0% NativeChildren under 6 years - Living with one parent Native parent 311 100.0% NativeForeign-born parent 11 68.9% Native5 31.1% Foreign-bornChildren 6 to 17 years - Living with two parents Both parents native 820 100.0% NativeBoth parents foreign-born 122 67.4% Native59 32.6% Foreign-bornOne native, one foreign-born parent 52 100.0% NativeChildren 6 to 17 years - Living with one parent Native parent 1,027 97.0% Native31 3.0% Foreign-bornForeign-born parent 9 100.0% Native
Grandparents responsible for own grandchildren in Hanover
Grandparents (30 to 59 years) White / Caucasian 116 67.4% Responsible for grandchildren56 32.6% Not responsible for grandchildrenOther race 16 100.0% Not responsible for grandchildrenTwo or more races 35 100.0% Responsible for grandchildrenWhite alone, not Hispanic / Latino 127 69.0% Responsible for grandchildren57 31.0% Not responsible for grandchildrenHispanic or Latino 17 58.7% Responsible for grandchildren12 41.3% Not responsible for grandchildrenGrandparents (60 years and over) White / Caucasian 8 24.9% Responsible for grandchildren25 75.1% Not responsible for grandchildrenWhite alone, not Hispanic / Latino 9 24.3% Responsible for grandchildren26 75.7% Not responsible for grandchildren