Races in Hamtramck, Michigan (MI) Detailed Stats
Data:
Races - White alone (%)
Races - White alone (% change since 2000)
Races - Black alone (%)
Races - Black alone (% change since 2000)
Races - American Indian alone (%)
Races - American Indian alone (% change since 2000)
Races - Asian alone (%)
Races - Asian alone (% change since 2000)
Races - Hispanic (%)
Races - Hispanic (% change since 2000)
Races - Native Hawaiian and Other Pacific Islander alone (%)
Races - Native Hawaiian and Other Pacific Islander alone (% change since 2000)
Races - Two or more races(%)
Races - Two or more races(% change since 2000)
Races - Other race alone (%)
Races - Other race alone (% change since 2000)
Racial diversity
Place of birth - Born in state of residence (%)
Place of birth - Born in state of residence (%) - White
Place of birth - Born in state of residence (%) - Black or African American
Place of birth - Born in state of residence (%) - Asian
Place of birth - Born in state of residence (%) - Hispanic or Latino
Place of birth - Born in state of residence (%) - American Indian and Alaska Native
Place of birth - Born in state of residence (%) - Multirace
Place of birth - Born in state of residence (%) - Other Race
Place of birth - Born in other state (%)
Place of birth - Born in other state (%) - White
Place of birth - Born in other state (%) - Black or African American
Place of birth - Born in other state (%) - Asian
Place of birth - Born in other state (%) - Hispanic or Latino
Place of birth - Born in other state (%) - American Indian and Alaska Native
Place of birth - Born in other state (%) - Multirace
Place of birth - Born in other state (%) - Other Race
Place of birth - Native, outside of US (%)
Place of birth - Native, outside of US (%) - White
Place of birth - Native, outside of US (%) - Black or African American
Place of birth - Native, outside of US (%) - Asian
Place of birth - Native, outside of US (%) - Hispanic or Latino
Place of birth - Native, outside of US (%) - American Indian and Alaska Native
Place of birth - Native, outside of US (%) - Multirace
Place of birth - Native, outside of US (%) - Other Race
Place of birth - Foreign born (%)
Place of birth - Foreign born (%) - White
Place of birth - Foreign born (%) - Black or African American
Place of birth - Foreign born (%) - Asian
Place of birth - Foreign born (%) - Hispanic or Latino
Place of birth - Foreign born (%) - American Indian and Alaska Native
Place of birth - Foreign born (%) - Multirace
Place of birth - Foreign born (%) - Other Race
Residents speaking English at home (%)
Residents speaking English at home - Born in the United States (%)
Residents speaking English at home - Native, born elsewhere (%)
Residents speaking English at home - Foreign born (%)
Residents speaking Spanish at home (%)
Residents speaking Spanish at home - Born in the United States (%)
Residents speaking Spanish at home - Native, born elsewhere (%)
Residents speaking Spanish at home - Foreign born (%)
Residents speaking other language at home (%)
Residents speaking other language at home - Born in the United States (%)
Residents speaking other language at home - Native, born elsewhere (%)
Residents speaking other language at home - Foreign born (%)
Marital status - Never married (%)
Marital status - Now married (%)
Marital status - Separated (%)
Marital status - Widowed (%)
Marital status - Divorced (%)
Ancestries Reported - Arab (%)
Ancestries Reported - Czech (%)
Ancestries Reported - Danish (%)
Ancestries Reported - Dutch (%)
Ancestries Reported - English (%)
Ancestries Reported - French (%)
Ancestries Reported - French Canadian (%)
Ancestries Reported - German (%)
Ancestries Reported - Greek (%)
Ancestries Reported - Hungarian (%)
Ancestries Reported - Irish (%)
Ancestries Reported - Italian (%)
Ancestries Reported - Lithuanian (%)
Ancestries Reported - Norwegian (%)
Ancestries Reported - Polish (%)
Ancestries Reported - Portuguese (%)
Ancestries Reported - Russian (%)
Ancestries Reported - Scotch-Irish (%)
Ancestries Reported - Scottish (%)
Ancestries Reported - Slovak (%)
Ancestries Reported - Subsaharan African (%)
Ancestries Reported - Swedish (%)
Ancestries Reported - Swiss (%)
Ancestries Reported - Ukrainian (%)
Ancestries Reported - United States (%)
Ancestries Reported - Welsh (%)
Ancestries Reported - West Indian (%)
Ancestries Reported - Other (%)
Geographical mobility - Same house 1 year ago (%)
Geographical mobility - Same house 1 year ago (%) - White
Geographical mobility - Same house 1 year ago (%) - Black or African American
Geographical mobility - Same house 1 year ago (%) - Asian
Geographical mobility - Same house 1 year ago (%) - Hispanic or Latino
Geographical mobility - Same house 1 year ago (%) - American Indian and Alaska Native
Geographical mobility - Same house 1 year ago (%) - Multirace
Geographical mobility - Same house 1 year ago (%) - Other Race
Geographical mobility - Moved within same county (%)
Geographical mobility - Moved within same county (%) - White
Geographical mobility - Moved within same county (%) - Black or African American
Geographical mobility - Moved within same county (%) - Asian
Geographical mobility - Moved within same county (%) - Hispanic or Latino
Geographical mobility - Moved within same county (%) - American Indian and Alaska Native
Geographical mobility - Moved within same county (%) - Multirace
Geographical mobility - Moved within same county (%) - Other Race
Geographical mobility - Moved from different county within same state (%)
Geographical mobility - Moved from different county within same state (%) - White
Geographical mobility - Moved from different county within same state (%) - Black or African American
Geographical mobility - Moved from different county within same state (%) - Asian
Geographical mobility - Moved from different county within same state (%) - Hispanic or Latino
Geographical mobility - Moved from different county within same state (%) - American Indian and Alaska Native
Geographical mobility - Moved from different county within same state (%) - Multirace
Geographical mobility - Moved from different county within same state (%) - Other Race
Geographical mobility - Moved from different state (%)
Geographical mobility - Moved from different state (%) - White
Geographical mobility - Moved from different state (%) - Black or African American
Geographical mobility - Moved from different state (%) - Asian
Geographical mobility - Moved from different state (%) - Hispanic or Latino
Geographical mobility - Moved from different state (%) - American Indian and Alaska Native
Geographical mobility - Moved from different state (%) - Multirace
Geographical mobility - Moved from different state (%) - Other Race
Geographical mobility - Moved from abroad (%)
Geographical mobility - Moved from abroad (%) - White
Geographical mobility - Moved from abroad (%) - Black or African American
Geographical mobility - Moved from abroad (%) - Asian
Geographical mobility - Moved from abroad (%) - Hispanic or Latino
Geographical mobility - Moved from abroad (%) - American Indian and Alaska Native
Geographical mobility - Moved from abroad (%) - Multirace
Geographical mobility - Moved from abroad (%) - Other Race
Place of birth for the foreign-born population - Ireland (%)
Place of birth for the foreign-born population - Denmark (%)
Place of birth for the foreign-born population - Norway (%)
Place of birth for the foreign-born population - Sweden (%)
Place of birth for the foreign-born population - United Kingdom (%)
Place of birth for the foreign-born population - England (%)
Place of birth for the foreign-born population - Scotland (%)
Place of birth for the foreign-born population - Other Northern Europe (%)
Place of birth for the foreign-born population - Austria (%)
Place of birth for the foreign-born population - Belgium (%)
Place of birth for the foreign-born population - France (%)
Place of birth for the foreign-born population - Germany (%)
Place of birth for the foreign-born population - Netherlands (%)
Place of birth for the foreign-born population - Switzerland (%)
Place of birth for the foreign-born population - Other Western Europe (%)
Place of birth for the foreign-born population - Greece (%)
Place of birth for the foreign-born population - Italy (%)
Place of birth for the foreign-born population - Portugal (%)
Place of birth for the foreign-born population - Spain (%)
Place of birth for the foreign-born population - Other Southern Europe (%)
Place of birth for the foreign-born population - Albania (%)
Place of birth for the foreign-born population - Belarus (%)
Place of birth for the foreign-born population - Bosnia and Herzegovina (%)
Place of birth for the foreign-born population - Bulgaria (%)
Place of birth for the foreign-born population - Croatia (%)
Place of birth for the foreign-born population - Czechoslovakia (%)
Place of birth for the foreign-born population - Hungary (%)
Place of birth for the foreign-born population - Latvia (%)
Place of birth for the foreign-born population - Lithuania (%)
Place of birth for the foreign-born population - North Macedonia (Macedonia) (%)
Place of birth for the foreign-born population - Moldova (%)
Place of birth for the foreign-born population - Poland (%)
Place of birth for the foreign-born population - Romania (%)
Place of birth for the foreign-born population - Russia (%)
Place of birth for the foreign-born population - Serbia (%)
Place of birth for the foreign-born population - Ukraine (%)
Place of birth for the foreign-born population - Other Eastern Europe (%)
Place of birth for the foreign-born population - China (%)
Place of birth for the foreign-born population - Hong Kong (%)
Place of birth for the foreign-born population - Taiwan (%)
Place of birth for the foreign-born population - Japan (%)
Place of birth for the foreign-born population - Korea (%)
Place of birth for the foreign-born population - Other Eastern Asia (%)
Place of birth for the foreign-born population - Afghanistan (%)
Place of birth for the foreign-born population - Bangladesh (%)
Place of birth for the foreign-born population - India (%)
Place of birth for the foreign-born population - Iran (%)
Place of birth for the foreign-born population - Kazakhstan (%)
Place of birth for the foreign-born population - Nepal (%)
Place of birth for the foreign-born population - Pakistan (%)
Place of birth for the foreign-born population - Sri Lanka (%)
Place of birth for the foreign-born population - Uzbekistan (%)
Place of birth for the foreign-born population - Other South Central Asia (%)
Place of birth for the foreign-born population - Burma (%)
Place of birth for the foreign-born population - Cambodia (%)
Place of birth for the foreign-born population - Indonesia (%)
Place of birth for the foreign-born population - Laos (%)
Place of birth for the foreign-born population - Malaysia (%)
Place of birth for the foreign-born population - Philippines (%)
Place of birth for the foreign-born population - Singapore (%)
Place of birth for the foreign-born population - Thailand (%)
Place of birth for the foreign-born population - Vietnam (%)
Place of birth for the foreign-born population - Other South Eastern Asia (%)
Place of birth for the foreign-born population - Armenia (%)
Place of birth for the foreign-born population - Iraq (%)
Place of birth for the foreign-born population - Israel (%)
Place of birth for the foreign-born population - Jordan (%)
Place of birth for the foreign-born population - Kuwait (%)
Place of birth for the foreign-born population - Lebanon (%)
Place of birth for the foreign-born population - Saudi Arabia (%)
Place of birth for the foreign-born population - Syria (%)
Place of birth for the foreign-born population - Turkey (%)
Place of birth for the foreign-born population - Yemen (%)
Place of birth for the foreign-born population - Other Western Asia (%)
Place of birth for the foreign-born population - Eritrea (%)
Place of birth for the foreign-born population - Ethiopia (%)
Place of birth for the foreign-born population - Kenya (%)
Place of birth for the foreign-born population - Somalia (%)
Place of birth for the foreign-born population - Uganda (%)
Place of birth for the foreign-born population - Zimbabwe (%)
Place of birth for the foreign-born population - Other Eastern Africa (%)
Place of birth for the foreign-born population - Cameroon (%)
Place of birth for the foreign-born population - Congo (%)
Place of birth for the foreign-born population - Democratic Republic of Congo (Zaire) (%)
Place of birth for the foreign-born population - Other Middle Africa (%)
Place of birth for the foreign-born population - Egypt (%)
Place of birth for the foreign-born population - Morocco (%)
Place of birth for the foreign-born population - Sudan (%)
Place of birth for the foreign-born population - Other Northern Africa (%)
Place of birth for the foreign-born population - South Africa (%)
Place of birth for the foreign-born population - Other Southern Africa (%)
Place of birth for the foreign-born population - Cabo Verde (%)
Place of birth for the foreign-born population - Ghana (%)
Place of birth for the foreign-born population - Liberia (%)
Place of birth for the foreign-born population - Nigeria (%)
Place of birth for the foreign-born population - Senegal (%)
Place of birth for the foreign-born population - Sierra Leone (%)
Place of birth for the foreign-born population - Other Western Africa (%)
Place of birth for the foreign-born population - Australia (%)
Place of birth for the foreign-born population - New Zealand (%)
Place of birth for the foreign-born population - Fiji (%)
Place of birth for the foreign-born population - Micronesia (%)
Place of birth for the foreign-born population - Bahamas (%)
Place of birth for the foreign-born population - Barbados (%)
Place of birth for the foreign-born population - Cuba (%)
Place of birth for the foreign-born population - Dominica (%)
Place of birth for the foreign-born population - Dominican Republic (%)
Place of birth for the foreign-born population - Grenada (%)
Place of birth for the foreign-born population - Haiti (%)
Place of birth for the foreign-born population - Jamaica (%)
Place of birth for the foreign-born population - St. Vincent and the Grenadines (%)
Place of birth for the foreign-born population - Trinidad and Tobago (%)
Place of birth for the foreign-born population - West Indies (%)
Place of birth for the foreign-born population - Other Caribbean (%)
Place of birth for the foreign-born population - Belize (%)
Place of birth for the foreign-born population - Costa Rica (%)
Place of birth for the foreign-born population - El Salvador (%)
Place of birth for the foreign-born population - Guatemala (%)
Place of birth for the foreign-born population - Honduras (%)
Place of birth for the foreign-born population - Mexico (%)
Place of birth for the foreign-born population - Nicaragua (%)
Place of birth for the foreign-born population - Panama (%)
Place of birth for the foreign-born population - Other Central America (%)
Place of birth for the foreign-born population - Argentina (%)
Place of birth for the foreign-born population - Bolivia (%)
Place of birth for the foreign-born population - Brazil (%)
Place of birth for the foreign-born population - Chile (%)
Place of birth for the foreign-born population - Colombia (%)
Place of birth for the foreign-born population - Ecuador (%)
Place of birth for the foreign-born population - Guyana (%)
Place of birth for the foreign-born population - Peru (%)
Place of birth for the foreign-born population - Uruguay (%)
Place of birth for the foreign-born population - Venezuela (%)
Place of birth for the foreign-born population - Other South America (%)
Place of birth for the foreign-born population - Canada (%)
Place of birth for the foreign-born population - Other Northern America (%)
Place of birth for the foreign-born population - Other (%)
Latest news about races in Hamtramck, MI collected exclusively by city-data.com from local newspapers, TV, and radio stations
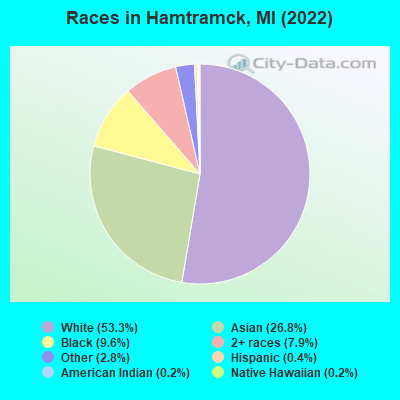
According to 2022 data, the most numerous races in Hamtramck, MI are White alone (14,640 residents), Black alone (2,634 residents), and Hispanic (97 residents). 29.9% of Hamtramck residents speak English at home. 43.0% of Hamtramck, MI residents are foreign-born (35.9% born in Asia, 6.0% born in Europe), which is 86.0% greater than the foreign-born rate of 6.0% across the entire state of Michigan.
Race distribution in Hamtramck
2000 2022
7,806,691 78.6% White alone 1,402,047 14.1% Black alone 323,877 3.3% Hispanic 175,311 1.8% Asian alone 163,487 1.6% Two or more races 53,421 0.5% American Indian alone 11,465 0.1% Other race alone 2,145 0.02% Native Hawaiian and Other
7,289,051 72.6% White alone 1,310,464 13.1% Black alone 572,405 5.7% Hispanic 450,031 4.5% Two or more races 335,732 3.3% Asian alone 45,217 0.5% Other race alone 29,011 0.3% American Indian alone 2,207 0.02% Native Hawaiian and Other
Income and house value in Hamtramck Median household income in 2022 $40,625 White non-Hispanic householders$27,776 Black householders$106,147 American Indian and Alaska Native householders$35,406 Asian householders$36,111 Two or more races householders$33,823 Hispanic or Latino race householdersMedian 2022 house value $108,341 White Non-Hispanic householders$92,711 Black or African American householders$104,664 American Indian or Alaska Native householders $103,897 Asian householders$125,658 Some other race householders$125,198 Two or more races householders$233,387 Hispanic or Latino householders
Median age by race in Hamtramck
27.9 Median age for White residents25.8 30.1 29.5 Median age for Black or African American residents22.3 34.8 32.8 Median age for American Indian / Alaska Native residents37.6 21.5 29.9 Median age for Asian residents33.0 27.7 39.2 Median age for Native Hawaiian / Pacific Islander residents-674,772,035.8 5.1 28.0 Median age for Other race residents24.9 36.8 19.7 Median age for Two or more races residents18.8 20.0 27.7 Median age for White alone residents25.5 29.9 27.0 Median age for Hispanic or Latino residents26.9 32.5
Owner/renter occupied households by race in Hamtramck
House owners and renters - White residents 2,605 62.5% Owner occupied1,566 37.5% Renter occupiedHouse owners and renters - Black or African American residents 186 21.1% Owner occupied695 78.9% Renter occupiedHouse owners and renters - American Indian / Alaska Native residents 20 63.3% Owner occupied12 36.7% Renter occupiedHouse owners and renters - Asian residents 1,171 69.0% Owner occupied526 31.0% Renter occupiedHouse owners and renters - Native Hawaiian / Pacific Islander residents 22 100.0% Renter occupiedHouse owners and renters - Other race residents 124 64.8% Owner occupied67 35.2% Renter occupiedHouse owners and renters - Two or more races residents 343 73.7% Owner occupied122 26.3% Renter occupiedHouse owners and renters - White alone residents 2,627 62.5% Owner occupied1,578 37.5% Renter occupiedHouse owners and renters - Hispanic or Latino residents 61 100.0% Renter occupied
Language usage in Hamtramck
English speakers - Total 29.9% of residents of Hamtramck speak English at home.
0.1% of residents speak Spanish at home 13 100.0% Speak English very well76.9% of residents speak other language at home 4,688 24.4% Speak English very well14,546 75.6% Speak English less than very well
English speakers - Born in the United States 78.3% of residents of Hamtramck speak English at home.
0.1% of residents speak Spanish at home 1 100.0% Speak English very well21.8% of residents speak other language at home 176 61.3% Speak English very well111 38.7% Speak English less than very well
English speakers - Native, born elsewhere 11.6% of residents of Hamtramck speak English at home.
65.1% of residents speak other language at home 566 31.7% Speak English very well1,219 68.3% Speak English less than very well
English speakers - Foreign-born 4.8% of residents of Hamtramck speak English at home.
104.9% of residents speak other language at home 1,957 15.6% Speak English very well10,594 84.4% Speak English less than very well
White (Caucasian) - Speak only English Native:
49.7% (3,740)Foreign-born:
5.2% (311)
White (Caucasian) - Speak another language Native:
44.1% (3,321)Foreign-born:
94.6% (5,621)
Black or African American - Speak only English Native:
99.8% (2,338)Foreign-born:
9.4% (11)
Black or African American - Speak another language Native:
0.5% (11)Foreign-born:
88.2% (106)
American Indian / Alaska Native - Speak another language Native:
100.0% (41)Foreign-born:
100.0% (119)
Asian - Speak only English Native:
16.3% (351)Foreign-born:
4.4% (205)
Asian - Speak another language Native:
86.9% (1,870)Foreign-born:
94.1% (4,350)
Native Hawaiian / Pacific Islander - Speak another language Native:
100.0% (25)Foreign-born:
100.0% (38)
Other race - Speak only English Native:
14.8% (68)Foreign-born:
5.3% (20)
Other race - Speak another language Native:
90.1% (413)Foreign-born:
94.3% (347)
Two or more races - Speak only English Native:
36.1% (410)Foreign-born:
6.0% (41)
Two or more races - Speak another language Native:
70.9% (803)Foreign-born:
95.5% (662)
White alone - Speak only English Native:
49.2% (3,743)Foreign-born:
5.0% (317)
White alone - Speak another language Native:
46.9% (3,566)Foreign-born:
95.3% (6,047)
Foreign-born residents in Hamtramck 11,801 residents are foreign born (35.9% Asia , 6.0% Europe ).
This city:
43.0%Michigan:
6.9%
Marital status for residents in Hamtramck Marital status - White (Caucasian) population 15 years and over
Males 47.1% Never married48.2% Now married0.7% Separated0.2% Widowed3.9% DivorcedFemales 33.6% Never married52.2% Now married1.9% Separated6.9% Widowed5.5% DivorcedWomen who gave birth in the past 12 months Now married:
100.0% (279)Unmarried:
0.0% (0)
Women who did not give birth in the past 12 months Now married:
45.9% (1,466)Unmarried:
54.1% (1,727)
Marital status - Black or African American population 15 years and over
Males 72.4% Never married15.5% Now married0.0% Separated2.5% Widowed9.6% DivorcedFemales 74.4% Never married10.7% Now married0.0% Separated4.8% Widowed10.0% DivorcedWomen who gave birth in the past 12 months Now married:
0.0% (0)Unmarried:
95.0% (1)
Women who did not give birth in the past 12 months Now married:
15.6% (112)Unmarried:
84.4% (605)
Marital status - American Indian / Alaska Native population 15 years and over
Males 34.6% Never married65.4% Now married0.0% Separated0.0% Widowed0.0% DivorcedFemales 49.2% Never married50.8% Now married0.0% Separated0.0% Widowed0.0% DivorcedWomen who did not give birth in the past 12 months Now married:
36.2% (18)Unmarried:
63.8% (31)
Marital status - Asian population 15 years and over
Males 33.0% Never married64.7% Now married0.3% Separated0.4% Widowed1.6% DivorcedFemales 35.0% Never married61.7% Now married0.3% Separated1.8% Widowed1.2% DivorcedWomen who gave birth in the past 12 months Now married:
100.0% (89)Unmarried:
0.0% (0)
Women who did not give birth in the past 12 months Now married:
58.0% (1,227)Unmarried:
42.0% (887)
Marital status - Native Hawaiian / Pacific Islander population 15 years and over
Males 0.0% Never married100.0% Now married0.0% Separated0.0% Widowed0.0% DivorcedFemales 0.0% Never married100.0% Now married0.0% Separated0.0% Widowed0.0% DivorcedWomen who gave birth in the past 12 months Now married:
100.0% (14)Unmarried:
0.0% (0)
Marital status - Other race population 15 years and over
Males 36.7% Never married63.3% Now married0.0% Separated0.0% Widowed0.0% DivorcedFemales 29.9% Never married70.1% Now married0.0% Separated0.0% Widowed0.0% DivorcedWomen who did not give birth in the past 12 months Now married:
66.8% (159)Unmarried:
33.2% (79)
Marital status - Two or more races population 15 years and over
Males 32.7% Never married67.3% Now married0.0% Separated0.0% Widowed0.0% DivorcedFemales 27.7% Never married62.5% Now married0.0% Separated3.3% Widowed6.4% DivorcedWomen who gave birth in the past 12 months Now married:
100.0% (84)Unmarried:
0.0% (0)
Women who did not give birth in the past 12 months Now married:
49.2% (162)Unmarried:
50.8% (168)
Marital status - White alone, not Hispanic / Latino population 15 years and over
Males 47.0% Never married48.2% Now married0.7% Separated0.2% Widowed3.9% DivorcedFemales 33.3% Never married52.3% Now married1.9% Separated6.9% Widowed5.5% DivorcedWomen who gave birth in the past 12 months Now married:
100.0% (285)Unmarried:
0.0% (0)
Women who did not give birth in the past 12 months Now married:
46.1% (1,498)Unmarried:
53.9% (1,748)
Marital status - Hispanic or Latino population 15 years and over
Males 100.0% Never married0.0% Now married0.0% Separated0.0% Widowed0.0% DivorcedFemales 77.8% Never married19.4% Now married0.0% Separated0.0% Widowed2.8% DivorcedWomen who did not give birth in the past 12 months Now married:
20.0% (7)Unmarried:
80.0% (29)
Ancestries in Hamtramck
3,038 14.5% Arab782 3.7% Polish390 1.9% Ukrainian217 1.0% Yugoslavian208 1.0% American87 0.4% Liberian84 0.4% Albanian76 0.4% German71 0.3% European70 0.3% Italian66 0.3% English58 0.3% Irish32 0.2% Jamaican28 0.1% Slavic23 0.1% African18 0.09% Belgian17 0.08% French15 0.07% Dutch11 0.05% Lebanese8 0.04% Scottish7 0.03% Slovak4 0.02% British
Geographical mobility in Hamtramck Same house 1 year ago 13,414 94.3% White (Caucasian)2,392 90.4% Black or African American117 100.0% American Indian / Alaska Native6,979 96.0% Asian75 91.9% Native Hawaiian / Pacific Islander881 94.7% Other race1,799 82.2% Two or more races13,610 94.1% White alone, not Hispanic / Latino70 71.6% Hispanic or LatinoMoved within same county 500 3.5% White / Caucasian213 8.0% Black or African American278 3.8% Asian23 2.4% Other race329 15.0% Two or more races521 3.6% White alone, not Hispanic / Latino27 27.4% Hispanic or LatinoMoved within same state 208 1.5% White / Caucasian34 1.3% Black or African American27 0.4% Asian212 1.5% White alone, not Hispanic / LatinoMoved from different state 17 0.1% White / Caucasian24 1.1% Two or more races17 0.1% White alone, not Hispanic / LatinoMoved from abroad 86 0.6% White165 2.3% Asian5 6.4% Native Hawaiian / Pacific Islander89 0.6% White alone, not Hispanic / Latino
Children Nativity (place of birth) in Hamtramck
Children under 6 years - Living with two parents Both parents native 349 99.8% Native1 0.2% Foreign-bornBoth parents foreign-born 1,273 86.0% Native206 14.0% Foreign-bornOne native, one foreign-born parent 811 98.0% Native17 2.0% Foreign-bornChildren under 6 years - Living with one parent Native parent 311 100.0% NativeForeign-born parent 27 46.6% Native31 53.4% Foreign-bornChildren 6 to 17 years - Living with two parents Both parents native 1,314 100.0% NativeBoth parents foreign-born 1,629 55.4% Native1,313 44.6% Foreign-bornOne native, one foreign-born parent 700 72.4% Native267 27.6% Foreign-bornChildren 6 to 17 years - Living with one parent Native parent 203 45.6% Native242 54.4% Foreign-bornForeign-born parent 369 76.0% Native117 24.0% Foreign-born
Grandparents responsible for own grandchildren in Hamtramck
Grandparents (30 to 59 years) White / Caucasian 29 46.6% Responsible for grandchildren33 53.4% Not responsible for grandchildrenBlack or African American 16 100.0% Not responsible for grandchildrenAsian 50 25.7% Responsible for grandchildren145 74.3% Not responsible for grandchildrenWhite alone, not Hispanic / Latino 29 45.2% Responsible for grandchildren35 54.8% Not responsible for grandchildren
Grandparents (60 years and over) White / Caucasian 164 100.0% Not responsible for grandchildrenAsian 50 100.0% Not responsible for grandchildrenWhite alone, not Hispanic / Latino 170 100.0% Not responsible for grandchildren