Races in Hallandale Beach, Florida (FL) Detailed Stats
Data:
Races - White alone (%)
Races - White alone (% change since 2000)
Races - Black alone (%)
Races - Black alone (% change since 2000)
Races - American Indian alone (%)
Races - American Indian alone (% change since 2000)
Races - Asian alone (%)
Races - Asian alone (% change since 2000)
Races - Hispanic (%)
Races - Hispanic (% change since 2000)
Races - Native Hawaiian and Other Pacific Islander alone (%)
Races - Native Hawaiian and Other Pacific Islander alone (% change since 2000)
Races - Two or more races(%)
Races - Two or more races(% change since 2000)
Races - Other race alone (%)
Races - Other race alone (% change since 2000)
Racial diversity
Place of birth - Born in state of residence (%)
Place of birth - Born in state of residence (%) - White
Place of birth - Born in state of residence (%) - Black or African American
Place of birth - Born in state of residence (%) - Asian
Place of birth - Born in state of residence (%) - Hispanic or Latino
Place of birth - Born in state of residence (%) - American Indian and Alaska Native
Place of birth - Born in state of residence (%) - Multirace
Place of birth - Born in state of residence (%) - Other Race
Place of birth - Born in other state (%)
Place of birth - Born in other state (%) - White
Place of birth - Born in other state (%) - Black or African American
Place of birth - Born in other state (%) - Asian
Place of birth - Born in other state (%) - Hispanic or Latino
Place of birth - Born in other state (%) - American Indian and Alaska Native
Place of birth - Born in other state (%) - Multirace
Place of birth - Born in other state (%) - Other Race
Place of birth - Native, outside of US (%)
Place of birth - Native, outside of US (%) - White
Place of birth - Native, outside of US (%) - Black or African American
Place of birth - Native, outside of US (%) - Asian
Place of birth - Native, outside of US (%) - Hispanic or Latino
Place of birth - Native, outside of US (%) - American Indian and Alaska Native
Place of birth - Native, outside of US (%) - Multirace
Place of birth - Native, outside of US (%) - Other Race
Place of birth - Foreign born (%)
Place of birth - Foreign born (%) - White
Place of birth - Foreign born (%) - Black or African American
Place of birth - Foreign born (%) - Asian
Place of birth - Foreign born (%) - Hispanic or Latino
Place of birth - Foreign born (%) - American Indian and Alaska Native
Place of birth - Foreign born (%) - Multirace
Place of birth - Foreign born (%) - Other Race
Residents speaking English at home (%)
Residents speaking English at home - Born in the United States (%)
Residents speaking English at home - Native, born elsewhere (%)
Residents speaking English at home - Foreign born (%)
Residents speaking Spanish at home (%)
Residents speaking Spanish at home - Born in the United States (%)
Residents speaking Spanish at home - Native, born elsewhere (%)
Residents speaking Spanish at home - Foreign born (%)
Residents speaking other language at home (%)
Residents speaking other language at home - Born in the United States (%)
Residents speaking other language at home - Native, born elsewhere (%)
Residents speaking other language at home - Foreign born (%)
Marital status - Never married (%)
Marital status - Now married (%)
Marital status - Separated (%)
Marital status - Widowed (%)
Marital status - Divorced (%)
Ancestries Reported - Arab (%)
Ancestries Reported - Czech (%)
Ancestries Reported - Danish (%)
Ancestries Reported - Dutch (%)
Ancestries Reported - English (%)
Ancestries Reported - French (%)
Ancestries Reported - French Canadian (%)
Ancestries Reported - German (%)
Ancestries Reported - Greek (%)
Ancestries Reported - Hungarian (%)
Ancestries Reported - Irish (%)
Ancestries Reported - Italian (%)
Ancestries Reported - Lithuanian (%)
Ancestries Reported - Norwegian (%)
Ancestries Reported - Polish (%)
Ancestries Reported - Portuguese (%)
Ancestries Reported - Russian (%)
Ancestries Reported - Scotch-Irish (%)
Ancestries Reported - Scottish (%)
Ancestries Reported - Slovak (%)
Ancestries Reported - Subsaharan African (%)
Ancestries Reported - Swedish (%)
Ancestries Reported - Swiss (%)
Ancestries Reported - Ukrainian (%)
Ancestries Reported - United States (%)
Ancestries Reported - Welsh (%)
Ancestries Reported - West Indian (%)
Ancestries Reported - Other (%)
Geographical mobility - Same house 1 year ago (%)
Geographical mobility - Same house 1 year ago (%) - White
Geographical mobility - Same house 1 year ago (%) - Black or African American
Geographical mobility - Same house 1 year ago (%) - Asian
Geographical mobility - Same house 1 year ago (%) - Hispanic or Latino
Geographical mobility - Same house 1 year ago (%) - American Indian and Alaska Native
Geographical mobility - Same house 1 year ago (%) - Multirace
Geographical mobility - Same house 1 year ago (%) - Other Race
Geographical mobility - Moved within same county (%)
Geographical mobility - Moved within same county (%) - White
Geographical mobility - Moved within same county (%) - Black or African American
Geographical mobility - Moved within same county (%) - Asian
Geographical mobility - Moved within same county (%) - Hispanic or Latino
Geographical mobility - Moved within same county (%) - American Indian and Alaska Native
Geographical mobility - Moved within same county (%) - Multirace
Geographical mobility - Moved within same county (%) - Other Race
Geographical mobility - Moved from different county within same state (%)
Geographical mobility - Moved from different county within same state (%) - White
Geographical mobility - Moved from different county within same state (%) - Black or African American
Geographical mobility - Moved from different county within same state (%) - Asian
Geographical mobility - Moved from different county within same state (%) - Hispanic or Latino
Geographical mobility - Moved from different county within same state (%) - American Indian and Alaska Native
Geographical mobility - Moved from different county within same state (%) - Multirace
Geographical mobility - Moved from different county within same state (%) - Other Race
Geographical mobility - Moved from different state (%)
Geographical mobility - Moved from different state (%) - White
Geographical mobility - Moved from different state (%) - Black or African American
Geographical mobility - Moved from different state (%) - Asian
Geographical mobility - Moved from different state (%) - Hispanic or Latino
Geographical mobility - Moved from different state (%) - American Indian and Alaska Native
Geographical mobility - Moved from different state (%) - Multirace
Geographical mobility - Moved from different state (%) - Other Race
Geographical mobility - Moved from abroad (%)
Geographical mobility - Moved from abroad (%) - White
Geographical mobility - Moved from abroad (%) - Black or African American
Geographical mobility - Moved from abroad (%) - Asian
Geographical mobility - Moved from abroad (%) - Hispanic or Latino
Geographical mobility - Moved from abroad (%) - American Indian and Alaska Native
Geographical mobility - Moved from abroad (%) - Multirace
Geographical mobility - Moved from abroad (%) - Other Race
Place of birth for the foreign-born population - Ireland (%)
Place of birth for the foreign-born population - Denmark (%)
Place of birth for the foreign-born population - Norway (%)
Place of birth for the foreign-born population - Sweden (%)
Place of birth for the foreign-born population - United Kingdom (%)
Place of birth for the foreign-born population - England (%)
Place of birth for the foreign-born population - Scotland (%)
Place of birth for the foreign-born population - Other Northern Europe (%)
Place of birth for the foreign-born population - Austria (%)
Place of birth for the foreign-born population - Belgium (%)
Place of birth for the foreign-born population - France (%)
Place of birth for the foreign-born population - Germany (%)
Place of birth for the foreign-born population - Netherlands (%)
Place of birth for the foreign-born population - Switzerland (%)
Place of birth for the foreign-born population - Other Western Europe (%)
Place of birth for the foreign-born population - Greece (%)
Place of birth for the foreign-born population - Italy (%)
Place of birth for the foreign-born population - Portugal (%)
Place of birth for the foreign-born population - Spain (%)
Place of birth for the foreign-born population - Other Southern Europe (%)
Place of birth for the foreign-born population - Albania (%)
Place of birth for the foreign-born population - Belarus (%)
Place of birth for the foreign-born population - Bosnia and Herzegovina (%)
Place of birth for the foreign-born population - Bulgaria (%)
Place of birth for the foreign-born population - Croatia (%)
Place of birth for the foreign-born population - Czechoslovakia (%)
Place of birth for the foreign-born population - Hungary (%)
Place of birth for the foreign-born population - Latvia (%)
Place of birth for the foreign-born population - Lithuania (%)
Place of birth for the foreign-born population - North Macedonia (Macedonia) (%)
Place of birth for the foreign-born population - Moldova (%)
Place of birth for the foreign-born population - Poland (%)
Place of birth for the foreign-born population - Romania (%)
Place of birth for the foreign-born population - Russia (%)
Place of birth for the foreign-born population - Serbia (%)
Place of birth for the foreign-born population - Ukraine (%)
Place of birth for the foreign-born population - Other Eastern Europe (%)
Place of birth for the foreign-born population - China (%)
Place of birth for the foreign-born population - Hong Kong (%)
Place of birth for the foreign-born population - Taiwan (%)
Place of birth for the foreign-born population - Japan (%)
Place of birth for the foreign-born population - Korea (%)
Place of birth for the foreign-born population - Other Eastern Asia (%)
Place of birth for the foreign-born population - Afghanistan (%)
Place of birth for the foreign-born population - Bangladesh (%)
Place of birth for the foreign-born population - India (%)
Place of birth for the foreign-born population - Iran (%)
Place of birth for the foreign-born population - Kazakhstan (%)
Place of birth for the foreign-born population - Nepal (%)
Place of birth for the foreign-born population - Pakistan (%)
Place of birth for the foreign-born population - Sri Lanka (%)
Place of birth for the foreign-born population - Uzbekistan (%)
Place of birth for the foreign-born population - Other South Central Asia (%)
Place of birth for the foreign-born population - Burma (%)
Place of birth for the foreign-born population - Cambodia (%)
Place of birth for the foreign-born population - Indonesia (%)
Place of birth for the foreign-born population - Laos (%)
Place of birth for the foreign-born population - Malaysia (%)
Place of birth for the foreign-born population - Philippines (%)
Place of birth for the foreign-born population - Singapore (%)
Place of birth for the foreign-born population - Thailand (%)
Place of birth for the foreign-born population - Vietnam (%)
Place of birth for the foreign-born population - Other South Eastern Asia (%)
Place of birth for the foreign-born population - Armenia (%)
Place of birth for the foreign-born population - Iraq (%)
Place of birth for the foreign-born population - Israel (%)
Place of birth for the foreign-born population - Jordan (%)
Place of birth for the foreign-born population - Kuwait (%)
Place of birth for the foreign-born population - Lebanon (%)
Place of birth for the foreign-born population - Saudi Arabia (%)
Place of birth for the foreign-born population - Syria (%)
Place of birth for the foreign-born population - Turkey (%)
Place of birth for the foreign-born population - Yemen (%)
Place of birth for the foreign-born population - Other Western Asia (%)
Place of birth for the foreign-born population - Eritrea (%)
Place of birth for the foreign-born population - Ethiopia (%)
Place of birth for the foreign-born population - Kenya (%)
Place of birth for the foreign-born population - Somalia (%)
Place of birth for the foreign-born population - Uganda (%)
Place of birth for the foreign-born population - Zimbabwe (%)
Place of birth for the foreign-born population - Other Eastern Africa (%)
Place of birth for the foreign-born population - Cameroon (%)
Place of birth for the foreign-born population - Congo (%)
Place of birth for the foreign-born population - Democratic Republic of Congo (Zaire) (%)
Place of birth for the foreign-born population - Other Middle Africa (%)
Place of birth for the foreign-born population - Egypt (%)
Place of birth for the foreign-born population - Morocco (%)
Place of birth for the foreign-born population - Sudan (%)
Place of birth for the foreign-born population - Other Northern Africa (%)
Place of birth for the foreign-born population - South Africa (%)
Place of birth for the foreign-born population - Other Southern Africa (%)
Place of birth for the foreign-born population - Cabo Verde (%)
Place of birth for the foreign-born population - Ghana (%)
Place of birth for the foreign-born population - Liberia (%)
Place of birth for the foreign-born population - Nigeria (%)
Place of birth for the foreign-born population - Senegal (%)
Place of birth for the foreign-born population - Sierra Leone (%)
Place of birth for the foreign-born population - Other Western Africa (%)
Place of birth for the foreign-born population - Australia (%)
Place of birth for the foreign-born population - New Zealand (%)
Place of birth for the foreign-born population - Fiji (%)
Place of birth for the foreign-born population - Micronesia (%)
Place of birth for the foreign-born population - Bahamas (%)
Place of birth for the foreign-born population - Barbados (%)
Place of birth for the foreign-born population - Cuba (%)
Place of birth for the foreign-born population - Dominica (%)
Place of birth for the foreign-born population - Dominican Republic (%)
Place of birth for the foreign-born population - Grenada (%)
Place of birth for the foreign-born population - Haiti (%)
Place of birth for the foreign-born population - Jamaica (%)
Place of birth for the foreign-born population - St. Vincent and the Grenadines (%)
Place of birth for the foreign-born population - Trinidad and Tobago (%)
Place of birth for the foreign-born population - West Indies (%)
Place of birth for the foreign-born population - Other Caribbean (%)
Place of birth for the foreign-born population - Belize (%)
Place of birth for the foreign-born population - Costa Rica (%)
Place of birth for the foreign-born population - El Salvador (%)
Place of birth for the foreign-born population - Guatemala (%)
Place of birth for the foreign-born population - Honduras (%)
Place of birth for the foreign-born population - Mexico (%)
Place of birth for the foreign-born population - Nicaragua (%)
Place of birth for the foreign-born population - Panama (%)
Place of birth for the foreign-born population - Other Central America (%)
Place of birth for the foreign-born population - Argentina (%)
Place of birth for the foreign-born population - Bolivia (%)
Place of birth for the foreign-born population - Brazil (%)
Place of birth for the foreign-born population - Chile (%)
Place of birth for the foreign-born population - Colombia (%)
Place of birth for the foreign-born population - Ecuador (%)
Place of birth for the foreign-born population - Guyana (%)
Place of birth for the foreign-born population - Peru (%)
Place of birth for the foreign-born population - Uruguay (%)
Place of birth for the foreign-born population - Venezuela (%)
Place of birth for the foreign-born population - Other South America (%)
Place of birth for the foreign-born population - Canada (%)
Place of birth for the foreign-born population - Other Northern America (%)
Place of birth for the foreign-born population - Other (%)
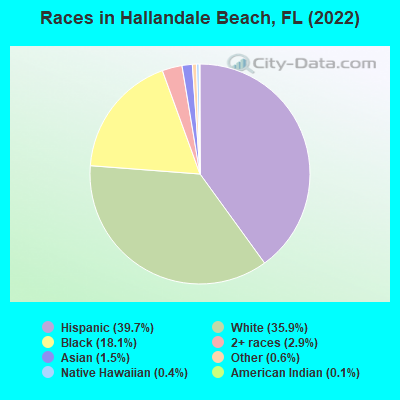
According to 2022 data, the most numerous races in Hallandale Beach, FL are White alone (14,815 residents), Hispanic (16,368 residents), and Black alone (7,483 residents). 37.6% of Hallandale Beach residents speak English at home.
Race distribution in Hallandale Beach 16,368 39.7% Hispanic 14,815 35.9% White alone 7,483 18.1% Black alone 1,202 2.9% Two or more races 624 1.5% Asian alone 262 0.6% Other race alone 157 0.4% Native Hawaiian and Other 52 0.1% American Indian alone
2000 2022
10,458,509 65.4% White alone 2,682,715 16.8% Hispanic 2,264,268 14.2% Black alone 261,693 1.6% Asian alone 236,954 1.5% Two or more races 42,358 0.3% American Indian alone 28,994 0.2% Other race alone 6,887 0.04% Native Hawaiian and Other
11,309,403 50.8% White alone 6,025,039 27.1% Hispanic 3,241,015 14.6% Black alone 861,630 3.9% Two or more races 623,692 2.8% Asian alone 152,054 0.7% Other race alone 22,504 0.1% American Indian alone 9,486 0.04% Native Hawaiian and Other
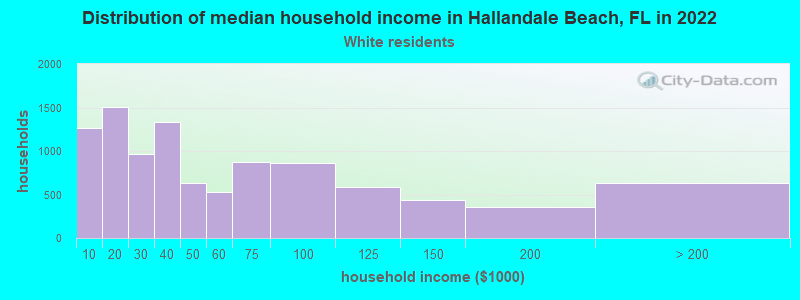
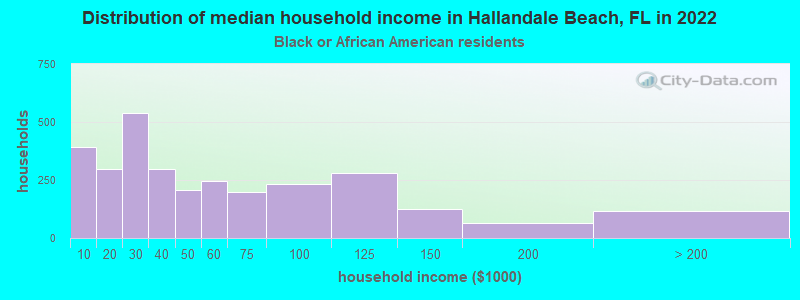
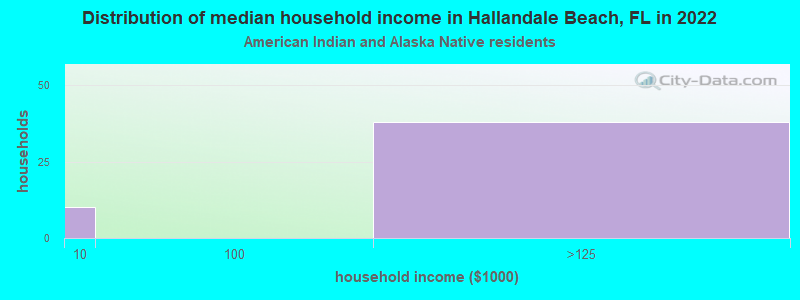
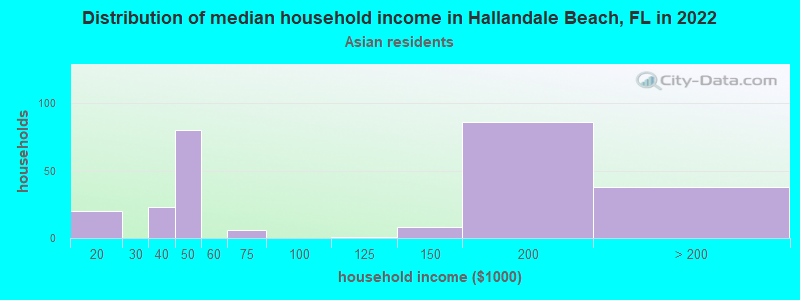
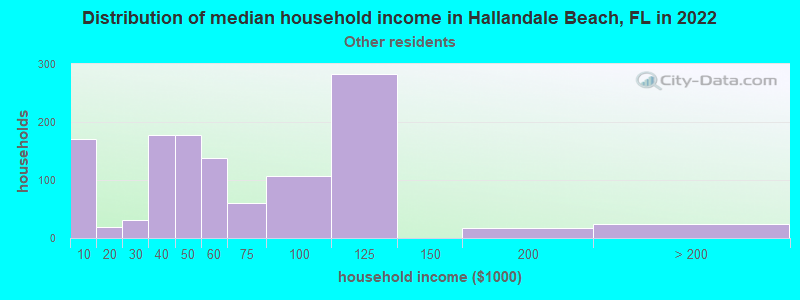
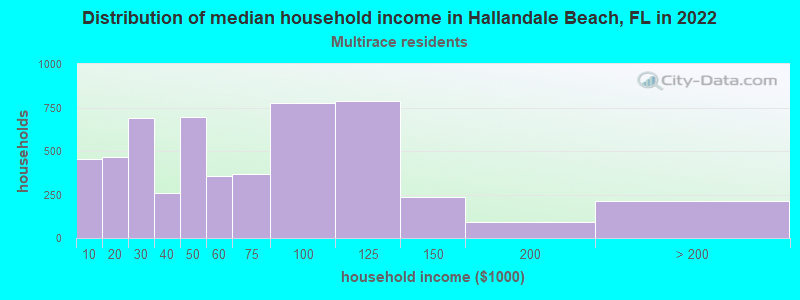
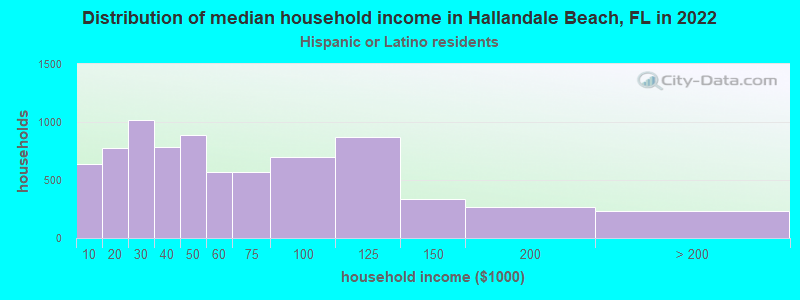
Income and house value in Hallandale Beach Median household income in 2022 $42,069 White non-Hispanic householders$44,036 Black householders$121,218 American Indian and Alaska Native householders$145,272 Native Hawaiian and other Pacific Islander householders$52,495 Some other race householders$58,528 Two or more races householders$47,151 Hispanic or Latino race householders
Median age by race in Hallandale Beach
54.9 Median age for White residents54.1 54.8 34.9 Median age for Black or African American residents30.6 37.0 61.9 Median age for American Indian / Alaska Native residents44.3 -735,362,996.9 42.9 Median age for Asian residents42.5 48.8 18.6 Median age for Native Hawaiian / Pacific Islander residents-454,756,380.1 58.0 46.7 Median age for Other race residents46.2 47.1 48.2 Median age for Two or more races residents40.0 54.1 56.8 Median age for White alone residents58.1 54.7 44.2 Median age for Hispanic or Latino residents39.5 46.6
Owner/renter occupied households by race in Hallandale Beach
House owners and renters - White residents 6,428 64.4% Owner occupied3,546 35.6% Renter occupiedHouse owners and renters - Black or African American residents 748 25.0% Owner occupied2,246 75.0% Renter occupiedHouse owners and renters - American Indian / Alaska Native residents 32 75.6% Owner occupied10 24.4% Renter occupiedHouse owners and renters - Asian residents 141 49.6% Owner occupied143 50.4% Renter occupiedHouse owners and renters - Native Hawaiian / Pacific Islander residents 106 100.0% Owner occupiedHouse owners and renters - Other race residents 468 38.6% Owner occupied744 61.4% Renter occupiedHouse owners and renters - Two or more races residents 2,616 48.8% Owner occupied2,740 51.2% Renter occupiedHouse owners and renters - White alone residents 5,758 71.3% Owner occupied2,322 28.7% Renter occupiedHouse owners and renters - Hispanic or Latino residents 3,266 42.2% Owner occupied4,466 57.8% Renter occupied
Language usage in Hallandale Beach
English speakers - Total 37.6% of residents of Hallandale Beach speak English at home.
37.6% of residents speak Spanish at home 7,065 48.6% Speak English very well7,465 51.4% Speak English less than very well26.3% of residents speak other language at home 6,011 59.2% Speak English very well4,137 40.8% Speak English less than very well
English speakers - Born in the United States 76.3% of residents of Hallandale Beach speak English at home.
14.1% of residents speak Spanish at home 1,062 93.9% Speak English very well69 6.1% Speak English less than very well11.1% of residents speak other language at home 867 97.0% Speak English very well27 3.0% Speak English less than very well
English speakers - Native, born elsewhere 27.0% of residents of Hallandale Beach speak English at home.
62.8% of residents speak Spanish at home 582 74.6% Speak English very well198 25.4% Speak English less than very well9.7% of residents speak other language at home 89 73.6% Speak English very well32 26.4% Speak English less than very well
English speakers - Foreign-born 11.8% of residents of Hallandale Beach speak English at home.
50.2% of residents speak Spanish at home 3,657 33.8% Speak English very well7,158 66.2% Speak English less than very well38.9% of residents speak other language at home 4,327 51.7% Speak English very well4,047 48.3% Speak English less than very well
White (Caucasian) - Speak only English Native:
70.2% (6,027)Foreign-born:
13.6% (985)
White (Caucasian) - Speak another language Native:
25.4% (2,179)Foreign-born:
84.4% (6,128)
Black or African American - Speak only English Native:
87.4% (4,439)Foreign-born:
44.4% (934)
Black or African American - Speak another language Native:
12.5% (637)Foreign-born:
56.0% (1,179)
Asian - Speak only English Native:
26.3% (17)Foreign-born:
20.8% (120)
Asian - Speak another language Native:
77.9% (49)Foreign-born:
79.3% (460)
Other race - Speak only English Native:
49.2% (388)Foreign-born:
10.8% (180)
Other race - Speak another language Native:
52.0% (410)Foreign-born:
89.0% (1,489)
Two or more races - Speak only English Native:
34.8% (1,044)Foreign-born:
2.9% (236)
Two or more races - Speak another language Native:
65.9% (1,975)Foreign-born:
97.8% (7,855)
White alone - Speak only English Native:
80.8% (5,834)Foreign-born:
15.2% (1,043)
White alone - Speak another language Native:
19.3% (1,395)Foreign-born:
83.5% (5,730)
Hispanic or Latino - Speak only English Native:
26.6% (1,236)Foreign-born:
1.9% (201)
Hispanic or Latino - Speak another language Native:
73.2% (3,399)Foreign-born:
97.9% (10,421)
Foreign-born residents in Hallandale Beach
Marital status for residents in Hallandale Beach Marital status - White (Caucasian) population 15 years and over
Males 28.4% Never married45.4% Now married3.3% Separated3.1% Widowed19.8% DivorcedFemales 22.4% Never married43.0% Now married3.0% Separated13.0% Widowed18.6% DivorcedWomen who gave birth in the past 12 months Now married:
57.1% (132)Unmarried:
42.9% (99)
Women who did not give birth in the past 12 months Now married:
44.3% (1,357)Unmarried:
55.7% (1,708)
Marital status - Black or African American population 15 years and over
Males 53.7% Never married31.7% Now married3.1% Separated3.1% Widowed8.5% DivorcedFemales 58.4% Never married20.1% Now married2.7% Separated2.2% Widowed16.6% DivorcedWomen who gave birth in the past 12 months Now married:
59.1% (62)Unmarried:
40.9% (43)
Women who did not give birth in the past 12 months Now married:
12.9% (277)Unmarried:
87.1% (1,862)
Marital status - American Indian / Alaska Native population 15 years and over
Males 31.5% Never married50.0% Now married0.0% Separated0.0% Widowed18.5% DivorcedFemales 0.0% Never married100.0% Now married0.0% Separated0.0% Widowed0.0% DivorcedMarital status - Asian population 15 years and over
Males 23.0% Never married66.3% Now married0.4% Separated0.0% Widowed10.3% DivorcedFemales 10.6% Never married57.3% Now married5.8% Separated2.4% Widowed23.9% DivorcedWomen who did not give birth in the past 12 months Now married:
66.7% (63)Unmarried:
33.3% (32)
Marital status - Native Hawaiian / Pacific Islander population 15 years and over
Males 22.6% Never married77.4% Now married0.0% Separated0.0% Widowed0.0% DivorcedFemales 0.0% Never married48.1% Now married0.0% Separated0.0% Widowed51.9% DivorcedMarital status - Other race population 15 years and over
Males 35.7% Never married45.8% Now married5.0% Separated0.0% Widowed13.6% DivorcedFemales 30.2% Never married33.9% Now married3.7% Separated6.4% Widowed25.7% DivorcedWomen who did not give birth in the past 12 months Now married:
16.3% (88)Unmarried:
83.7% (452)
Marital status - Two or more races population 15 years and over
Males 36.0% Never married49.7% Now married0.6% Separated3.6% Widowed10.0% DivorcedFemales 31.6% Never married36.1% Now married6.1% Separated6.9% Widowed19.3% DivorcedWomen who gave birth in the past 12 months Now married:
0.0% (0)Unmarried:
100.0% (213)
Women who did not give birth in the past 12 months Now married:
27.8% (644)Unmarried:
72.2% (1,675)
Marital status - White alone, not Hispanic / Latino population 15 years and over
Males 22.8% Never married45.8% Now married3.2% Separated3.8% Widowed24.3% DivorcedFemales 22.1% Never married46.0% Now married1.5% Separated14.1% Widowed16.3% DivorcedWomen who gave birth in the past 12 months Now married:
49.8% (119)Unmarried:
50.2% (120)
Women who did not give birth in the past 12 months Now married:
49.5% (1,077)Unmarried:
50.5% (1,097)
Marital status - Hispanic or Latino population 15 years and over
Males 36.6% Never married47.8% Now married2.2% Separated2.1% Widowed11.3% DivorcedFemales 29.5% Never married34.7% Now married6.2% Separated7.1% Widowed22.4% DivorcedWomen who gave birth in the past 12 months Now married:
25.7% (46)Unmarried:
74.3% (133)
Women who did not give birth in the past 12 months Now married:
30.5% (1,106)Unmarried:
69.5% (2,518)
Ancestries in Hallandale Beach
1,656 5.5% American1,568 5.3% Russian1,467 4.9% Haitian1,221 4.1% Romanian1,144 3.8% Italian1,082 3.6% Ukrainian824 2.8% Jamaican744 2.5% German460 1.5% Canadian451 1.5% Brazilian433 1.5% Polish249 0.8% European248 0.8% Irish244 0.8% French Canadian191 0.6% Hungarian186 0.6% English181 0.6% Israeli167 0.6% Eastern European160 0.5% French133 0.4% Lithuanian86 0.3% Turkish85 0.3% Arab81 0.3% British West Indian76 0.3% Iranian69 0.2% Bulgarian64 0.2% Syrian62 0.2% U.S. Virgin Islander57 0.2% British51 0.2% Portuguese48 0.2% Egyptian48 0.2% Trinidadian and Tobagonian46 0.2% Serbian40 0.1% Greek34 0.1% Armenian30 0.1% Finnish30 0.1% Bahamian29 0.10% Czech28 0.09% Northern European23 0.08% Scottish22 0.07% Dutch20 0.07% South African18 0.06% Nigerian18 0.06% African15 0.05% Lebanese14 0.05% Danish9 0.03% Austrian8 0.03% Czechoslovakian7 0.02% Swiss4 0.01% Scotch-Irish
Geographical mobility in Hallandale Beach Same house 1 year ago 14,906 83.6% White (Caucasian)6,992 91.3% Black or African American66 73.5% American Indian / Alaska Native545 82.4% Asian85 79.0% Native Hawaiian / Pacific Islander2,209 87.7% Other race9,749 82.8% Two or more races12,606 86.3% White alone, not Hispanic / Latino12,868 80.2% Hispanic or LatinoMoved within same county 965 5.4% White / Caucasian460 6.0% Black or African American20 22.3% American Indian / Alaska Native9 1.3% Asian70 2.8% Other race1,118 9.5% Two or more races527 3.6% White alone, not Hispanic / Latino1,494 9.3% Hispanic or LatinoMoved within same state 478 2.7% White / Caucasian185 2.4% Black or African American68 10.2% Asian31 28.9% Native Hawaiian / Pacific Islander169 6.7% Other race147 1.2% Two or more races68 0.5% White alone, not Hispanic / Latino814 5.1% Hispanic or LatinoMoved from different state 818 4.6% White / Caucasian62 9.3% Asian557 4.7% Two or more races861 5.9% White alone, not Hispanic / Latino417 2.6% Hispanic or LatinoMoved from abroad 811 4.6% White32 0.4% Black or African American102 4.1% Other race178 1.5% Two or more races967 6.6% White alone, not Hispanic / Latino388 2.4% Hispanic or Latino
Children Nativity (place of birth) in Hallandale Beach
Children under 6 years - Living with two parents Both parents native 236 97.1% Native7 2.9% Foreign-bornBoth parents foreign-born 770 91.5% Native72 8.5% Foreign-bornOne native, one foreign-born parent 95 100.0% NativeChildren under 6 years - Living with one parent Native parent 959 99.8% Native2 0.2% Foreign-bornForeign-born parent 646 91.2% Native63 8.8% Foreign-bornChildren 6 to 17 years - Living with two parents Both parents native 173 100.0% NativeBoth parents foreign-born 620 61.3% Native391 38.7% Foreign-bornOne native, one foreign-born parent 134 100.0% NativeChildren 6 to 17 years - Living with one parent Native parent 996 100.0% NativeForeign-born parent 608 56.0% Native477 44.0% Foreign-born
Place of birth for residents in Hallandale Beach 14,112 Americas13,326 Latin America6,626 South America5,666 Europe5,017 Caribbean4,703 Eastern Europe1,685 Asia1,681 Central America822 Western Asia786 Northern America597 South Central Asia500 Southern Europe288 Western Europe229 Africa211 South Eastern Asia138 Northern Europe115 Western Africa102 Northern Africa53 Eastern Asia35 China11 Southern Africa2,347 Cuba1,790 Venezuela1,595 Colombia1,269 Russia1,030 Jamaica1,002 Ukraine932 Haiti907 Peru878 Romania789 Argentina786 Canada778 Honduras725 Brazil438 Israel357 Moldova351 Dominican Republic304 Italy301 Nicaragua293 Uruguay248 Mexico243 Ecuador223 Chile211 Belarus178 El Salvador176 Kazakhstan174 Guatemala170 Hungary162 Spain158 Germany154 Poland152 Bulgaria118 Philippines115 Trinidad and Tobago115 Lithuania112 West Indies95 Azerbaijan93 Ghana87 France87 Saudi Arabia72 Uzbekistan66 Turkey59 Algeria58 Iran47 Thailand45 Iraq45 India44 Bolivia43 Lebanon42 Egypt38 United Kingdom37 Pakistan34 Greece32 Dominica29 England28 Netherlands27 Latvia25 Czechoslovakia23 Laos23 China22 Nigeria22 Vietnam18 Korea17 Bahamas14 Denmark13 Belgium12 United Arab Emirates12 Guyana11 South Africa11 Hong Kong
Grandparents responsible for own grandchildren in Hallandale Beach
Grandparents (30 to 59 years) White / Caucasian 8 9.0% Responsible for grandchildren82 91.0% Not responsible for grandchildrenBlack or African American 66 100.0% Not responsible for grandchildrenOther race 12 100.0% Not responsible for grandchildrenWhite alone, not Hispanic / Latino 54 100.0% Not responsible for grandchildrenHispanic or Latino 19 24.2% Responsible for grandchildren58 75.8% Not responsible for grandchildrenGrandparents (60 years and over) White / Caucasian 33 26.5% Responsible for grandchildren90 73.5% Not responsible for grandchildrenBlack or African American 114 100.0% Not responsible for grandchildrenOther race 17 100.0% Not responsible for grandchildrenWhite alone, not Hispanic / Latino 37 38.0% Responsible for grandchildren61 62.0% Not responsible for grandchildrenHispanic or Latino 79 100.0% Not responsible for grandchildren