Races in Grovetown, Georgia (GA) Detailed Stats
Data:
Races - White alone (%)
Races - White alone (% change since 2000)
Races - Black alone (%)
Races - Black alone (% change since 2000)
Races - American Indian alone (%)
Races - American Indian alone (% change since 2000)
Races - Asian alone (%)
Races - Asian alone (% change since 2000)
Races - Hispanic (%)
Races - Hispanic (% change since 2000)
Races - Native Hawaiian and Other Pacific Islander alone (%)
Races - Native Hawaiian and Other Pacific Islander alone (% change since 2000)
Races - Two or more races(%)
Races - Two or more races(% change since 2000)
Races - Other race alone (%)
Races - Other race alone (% change since 2000)
Racial diversity
Place of birth - Born in state of residence (%)
Place of birth - Born in state of residence (%) - White
Place of birth - Born in state of residence (%) - Black or African American
Place of birth - Born in state of residence (%) - Asian
Place of birth - Born in state of residence (%) - Hispanic or Latino
Place of birth - Born in state of residence (%) - American Indian and Alaska Native
Place of birth - Born in state of residence (%) - Multirace
Place of birth - Born in state of residence (%) - Other Race
Place of birth - Born in other state (%)
Place of birth - Born in other state (%) - White
Place of birth - Born in other state (%) - Black or African American
Place of birth - Born in other state (%) - Asian
Place of birth - Born in other state (%) - Hispanic or Latino
Place of birth - Born in other state (%) - American Indian and Alaska Native
Place of birth - Born in other state (%) - Multirace
Place of birth - Born in other state (%) - Other Race
Place of birth - Native, outside of US (%)
Place of birth - Native, outside of US (%) - White
Place of birth - Native, outside of US (%) - Black or African American
Place of birth - Native, outside of US (%) - Asian
Place of birth - Native, outside of US (%) - Hispanic or Latino
Place of birth - Native, outside of US (%) - American Indian and Alaska Native
Place of birth - Native, outside of US (%) - Multirace
Place of birth - Native, outside of US (%) - Other Race
Place of birth - Foreign born (%)
Place of birth - Foreign born (%) - White
Place of birth - Foreign born (%) - Black or African American
Place of birth - Foreign born (%) - Asian
Place of birth - Foreign born (%) - Hispanic or Latino
Place of birth - Foreign born (%) - American Indian and Alaska Native
Place of birth - Foreign born (%) - Multirace
Place of birth - Foreign born (%) - Other Race
Residents speaking English at home (%)
Residents speaking English at home - Born in the United States (%)
Residents speaking English at home - Native, born elsewhere (%)
Residents speaking English at home - Foreign born (%)
Residents speaking Spanish at home (%)
Residents speaking Spanish at home - Born in the United States (%)
Residents speaking Spanish at home - Native, born elsewhere (%)
Residents speaking Spanish at home - Foreign born (%)
Residents speaking other language at home (%)
Residents speaking other language at home - Born in the United States (%)
Residents speaking other language at home - Native, born elsewhere (%)
Residents speaking other language at home - Foreign born (%)
Marital status - Never married (%)
Marital status - Now married (%)
Marital status - Separated (%)
Marital status - Widowed (%)
Marital status - Divorced (%)
Ancestries Reported - Arab (%)
Ancestries Reported - Czech (%)
Ancestries Reported - Danish (%)
Ancestries Reported - Dutch (%)
Ancestries Reported - English (%)
Ancestries Reported - French (%)
Ancestries Reported - French Canadian (%)
Ancestries Reported - German (%)
Ancestries Reported - Greek (%)
Ancestries Reported - Hungarian (%)
Ancestries Reported - Irish (%)
Ancestries Reported - Italian (%)
Ancestries Reported - Lithuanian (%)
Ancestries Reported - Norwegian (%)
Ancestries Reported - Polish (%)
Ancestries Reported - Portuguese (%)
Ancestries Reported - Russian (%)
Ancestries Reported - Scotch-Irish (%)
Ancestries Reported - Scottish (%)
Ancestries Reported - Slovak (%)
Ancestries Reported - Subsaharan African (%)
Ancestries Reported - Swedish (%)
Ancestries Reported - Swiss (%)
Ancestries Reported - Ukrainian (%)
Ancestries Reported - United States (%)
Ancestries Reported - Welsh (%)
Ancestries Reported - West Indian (%)
Ancestries Reported - Other (%)
Geographical mobility - Same house 1 year ago (%)
Geographical mobility - Same house 1 year ago (%) - White
Geographical mobility - Same house 1 year ago (%) - Black or African American
Geographical mobility - Same house 1 year ago (%) - Asian
Geographical mobility - Same house 1 year ago (%) - Hispanic or Latino
Geographical mobility - Same house 1 year ago (%) - American Indian and Alaska Native
Geographical mobility - Same house 1 year ago (%) - Multirace
Geographical mobility - Same house 1 year ago (%) - Other Race
Geographical mobility - Moved within same county (%)
Geographical mobility - Moved within same county (%) - White
Geographical mobility - Moved within same county (%) - Black or African American
Geographical mobility - Moved within same county (%) - Asian
Geographical mobility - Moved within same county (%) - Hispanic or Latino
Geographical mobility - Moved within same county (%) - American Indian and Alaska Native
Geographical mobility - Moved within same county (%) - Multirace
Geographical mobility - Moved within same county (%) - Other Race
Geographical mobility - Moved from different county within same state (%)
Geographical mobility - Moved from different county within same state (%) - White
Geographical mobility - Moved from different county within same state (%) - Black or African American
Geographical mobility - Moved from different county within same state (%) - Asian
Geographical mobility - Moved from different county within same state (%) - Hispanic or Latino
Geographical mobility - Moved from different county within same state (%) - American Indian and Alaska Native
Geographical mobility - Moved from different county within same state (%) - Multirace
Geographical mobility - Moved from different county within same state (%) - Other Race
Geographical mobility - Moved from different state (%)
Geographical mobility - Moved from different state (%) - White
Geographical mobility - Moved from different state (%) - Black or African American
Geographical mobility - Moved from different state (%) - Asian
Geographical mobility - Moved from different state (%) - Hispanic or Latino
Geographical mobility - Moved from different state (%) - American Indian and Alaska Native
Geographical mobility - Moved from different state (%) - Multirace
Geographical mobility - Moved from different state (%) - Other Race
Geographical mobility - Moved from abroad (%)
Geographical mobility - Moved from abroad (%) - White
Geographical mobility - Moved from abroad (%) - Black or African American
Geographical mobility - Moved from abroad (%) - Asian
Geographical mobility - Moved from abroad (%) - Hispanic or Latino
Geographical mobility - Moved from abroad (%) - American Indian and Alaska Native
Geographical mobility - Moved from abroad (%) - Multirace
Geographical mobility - Moved from abroad (%) - Other Race
Place of birth for the foreign-born population - Ireland (%)
Place of birth for the foreign-born population - Denmark (%)
Place of birth for the foreign-born population - Norway (%)
Place of birth for the foreign-born population - Sweden (%)
Place of birth for the foreign-born population - United Kingdom (%)
Place of birth for the foreign-born population - England (%)
Place of birth for the foreign-born population - Scotland (%)
Place of birth for the foreign-born population - Other Northern Europe (%)
Place of birth for the foreign-born population - Austria (%)
Place of birth for the foreign-born population - Belgium (%)
Place of birth for the foreign-born population - France (%)
Place of birth for the foreign-born population - Germany (%)
Place of birth for the foreign-born population - Netherlands (%)
Place of birth for the foreign-born population - Switzerland (%)
Place of birth for the foreign-born population - Other Western Europe (%)
Place of birth for the foreign-born population - Greece (%)
Place of birth for the foreign-born population - Italy (%)
Place of birth for the foreign-born population - Portugal (%)
Place of birth for the foreign-born population - Spain (%)
Place of birth for the foreign-born population - Other Southern Europe (%)
Place of birth for the foreign-born population - Albania (%)
Place of birth for the foreign-born population - Belarus (%)
Place of birth for the foreign-born population - Bosnia and Herzegovina (%)
Place of birth for the foreign-born population - Bulgaria (%)
Place of birth for the foreign-born population - Croatia (%)
Place of birth for the foreign-born population - Czechoslovakia (%)
Place of birth for the foreign-born population - Hungary (%)
Place of birth for the foreign-born population - Latvia (%)
Place of birth for the foreign-born population - Lithuania (%)
Place of birth for the foreign-born population - North Macedonia (Macedonia) (%)
Place of birth for the foreign-born population - Moldova (%)
Place of birth for the foreign-born population - Poland (%)
Place of birth for the foreign-born population - Romania (%)
Place of birth for the foreign-born population - Russia (%)
Place of birth for the foreign-born population - Serbia (%)
Place of birth for the foreign-born population - Ukraine (%)
Place of birth for the foreign-born population - Other Eastern Europe (%)
Place of birth for the foreign-born population - China (%)
Place of birth for the foreign-born population - Hong Kong (%)
Place of birth for the foreign-born population - Taiwan (%)
Place of birth for the foreign-born population - Japan (%)
Place of birth for the foreign-born population - Korea (%)
Place of birth for the foreign-born population - Other Eastern Asia (%)
Place of birth for the foreign-born population - Afghanistan (%)
Place of birth for the foreign-born population - Bangladesh (%)
Place of birth for the foreign-born population - India (%)
Place of birth for the foreign-born population - Iran (%)
Place of birth for the foreign-born population - Kazakhstan (%)
Place of birth for the foreign-born population - Nepal (%)
Place of birth for the foreign-born population - Pakistan (%)
Place of birth for the foreign-born population - Sri Lanka (%)
Place of birth for the foreign-born population - Uzbekistan (%)
Place of birth for the foreign-born population - Other South Central Asia (%)
Place of birth for the foreign-born population - Burma (%)
Place of birth for the foreign-born population - Cambodia (%)
Place of birth for the foreign-born population - Indonesia (%)
Place of birth for the foreign-born population - Laos (%)
Place of birth for the foreign-born population - Malaysia (%)
Place of birth for the foreign-born population - Philippines (%)
Place of birth for the foreign-born population - Singapore (%)
Place of birth for the foreign-born population - Thailand (%)
Place of birth for the foreign-born population - Vietnam (%)
Place of birth for the foreign-born population - Other South Eastern Asia (%)
Place of birth for the foreign-born population - Armenia (%)
Place of birth for the foreign-born population - Iraq (%)
Place of birth for the foreign-born population - Israel (%)
Place of birth for the foreign-born population - Jordan (%)
Place of birth for the foreign-born population - Kuwait (%)
Place of birth for the foreign-born population - Lebanon (%)
Place of birth for the foreign-born population - Saudi Arabia (%)
Place of birth for the foreign-born population - Syria (%)
Place of birth for the foreign-born population - Turkey (%)
Place of birth for the foreign-born population - Yemen (%)
Place of birth for the foreign-born population - Other Western Asia (%)
Place of birth for the foreign-born population - Eritrea (%)
Place of birth for the foreign-born population - Ethiopia (%)
Place of birth for the foreign-born population - Kenya (%)
Place of birth for the foreign-born population - Somalia (%)
Place of birth for the foreign-born population - Uganda (%)
Place of birth for the foreign-born population - Zimbabwe (%)
Place of birth for the foreign-born population - Other Eastern Africa (%)
Place of birth for the foreign-born population - Cameroon (%)
Place of birth for the foreign-born population - Congo (%)
Place of birth for the foreign-born population - Democratic Republic of Congo (Zaire) (%)
Place of birth for the foreign-born population - Other Middle Africa (%)
Place of birth for the foreign-born population - Egypt (%)
Place of birth for the foreign-born population - Morocco (%)
Place of birth for the foreign-born population - Sudan (%)
Place of birth for the foreign-born population - Other Northern Africa (%)
Place of birth for the foreign-born population - South Africa (%)
Place of birth for the foreign-born population - Other Southern Africa (%)
Place of birth for the foreign-born population - Cabo Verde (%)
Place of birth for the foreign-born population - Ghana (%)
Place of birth for the foreign-born population - Liberia (%)
Place of birth for the foreign-born population - Nigeria (%)
Place of birth for the foreign-born population - Senegal (%)
Place of birth for the foreign-born population - Sierra Leone (%)
Place of birth for the foreign-born population - Other Western Africa (%)
Place of birth for the foreign-born population - Australia (%)
Place of birth for the foreign-born population - New Zealand (%)
Place of birth for the foreign-born population - Fiji (%)
Place of birth for the foreign-born population - Micronesia (%)
Place of birth for the foreign-born population - Bahamas (%)
Place of birth for the foreign-born population - Barbados (%)
Place of birth for the foreign-born population - Cuba (%)
Place of birth for the foreign-born population - Dominica (%)
Place of birth for the foreign-born population - Dominican Republic (%)
Place of birth for the foreign-born population - Grenada (%)
Place of birth for the foreign-born population - Haiti (%)
Place of birth for the foreign-born population - Jamaica (%)
Place of birth for the foreign-born population - St. Vincent and the Grenadines (%)
Place of birth for the foreign-born population - Trinidad and Tobago (%)
Place of birth for the foreign-born population - West Indies (%)
Place of birth for the foreign-born population - Other Caribbean (%)
Place of birth for the foreign-born population - Belize (%)
Place of birth for the foreign-born population - Costa Rica (%)
Place of birth for the foreign-born population - El Salvador (%)
Place of birth for the foreign-born population - Guatemala (%)
Place of birth for the foreign-born population - Honduras (%)
Place of birth for the foreign-born population - Mexico (%)
Place of birth for the foreign-born population - Nicaragua (%)
Place of birth for the foreign-born population - Panama (%)
Place of birth for the foreign-born population - Other Central America (%)
Place of birth for the foreign-born population - Argentina (%)
Place of birth for the foreign-born population - Bolivia (%)
Place of birth for the foreign-born population - Brazil (%)
Place of birth for the foreign-born population - Chile (%)
Place of birth for the foreign-born population - Colombia (%)
Place of birth for the foreign-born population - Ecuador (%)
Place of birth for the foreign-born population - Guyana (%)
Place of birth for the foreign-born population - Peru (%)
Place of birth for the foreign-born population - Uruguay (%)
Place of birth for the foreign-born population - Venezuela (%)
Place of birth for the foreign-born population - Other South America (%)
Place of birth for the foreign-born population - Canada (%)
Place of birth for the foreign-born population - Other Northern America (%)
Place of birth for the foreign-born population - Other (%)
Latest news about races in Grovetown, GA collected exclusively by city-data.com from local newspapers, TV, and radio stations
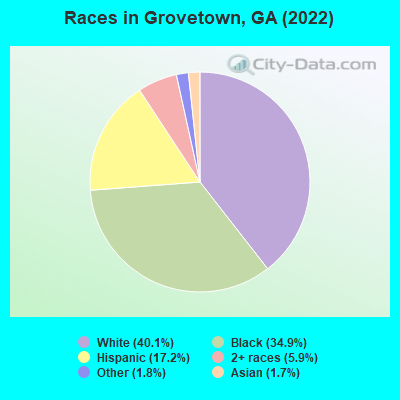
According to 2022 data, the most numerous races in Grovetown, GA are White alone (6,653 residents), Black alone (5,792 residents), and Hispanic (2,860 residents). 81.4% of Grovetown residents speak English at home. 10.0% of Grovetown, GA residents are foreign-born (5.8% born in Latin America, 1.7% born in Europe, 1.1% born in Asia), which is about the same as the foreign-born rate of 10.0% across the entire state of Georgia.
Race distribution in Grovetown
2000 2022
5,128,661 62.6% White alone 2,331,465 28.5% Black alone 435,227 5.3% Hispanic 171,513 2.1% Asian alone 87,364 1.1% Two or more races 17,670 0.2% American Indian alone 11,275 0.1% Other race alone 3,278 0.04% Native Hawaiian and Other
5,415,657 49.6% White alone 3,349,240 30.7% Black alone 1,132,604 10.4% Hispanic 479,156 4.4% Asian alone 462,923 4.2% Two or more races 54,416 0.5% Other race alone 11,923 0.1% American Indian alone 6,957 0.06% Native Hawaiian and Other
Income and house value in Grovetown Median household income in 2022 $60,797 White non-Hispanic householders$109,352 Black householders$88,081 Asian householders$63,013 Two or more races householders$48,972 Hispanic or Latino race householdersMedian 2022 house value $238,482 White Non-Hispanic householders$328,217 Black or African American householders$287,456 American Indian or Alaska Native householders $342,209 Asian householders$180,382 Two or more races householders$329,433 Hispanic or Latino householders
Median age by race in Grovetown
33.9 Median age for White residents31.3 36.9 37.9 Median age for Black or African American residents41.9 35.0 19.3 Median age for American Indian / Alaska Native residents-597,222,221.6 19.3 25.7 Median age for Asian residents19.5 38.9 -666,666,666.0 Median age for Native Hawaiian / Pacific Islander residents-666,666,666.0 -666,666,666.0 25.9 Median age for Other race residents25.1 28.4 24.9 Median age for Two or more races residents11.5 36.2 40.0 Median age for White alone residents31.3 43.9 25.0 Median age for Hispanic or Latino residents28.8 23.0
Owner/renter occupied households by race in Grovetown
House owners and renters - White residents 1,734 59.3% Owner occupied1,190 40.7% Renter occupiedHouse owners and renters - Black or African American residents 1,155 60.8% Owner occupied746 39.2% Renter occupiedHouse owners and renters - American Indian / Alaska Native residents 45 100.0% Renter occupiedHouse owners and renters - Asian residents 119 96.2% Owner occupied5 3.8% Renter occupiedHouse owners and renters - Other race residents 30 11.5% Owner occupied233 88.5% Renter occupiedHouse owners and renters - Two or more races residents 84 62.0% Owner occupied52 38.0% Renter occupiedHouse owners and renters - White alone residents 1,537 62.5% Owner occupied922 37.5% Renter occupiedHouse owners and renters - Hispanic or Latino residents 352 42.6% Owner occupied475 57.4% Renter occupied
Language usage in Grovetown
English speakers - Total 81.4% of residents of Grovetown speak English at home.
10.1% of residents speak Spanish at home 901 58.5% Speak English very well640 41.5% Speak English less than very well8.2% of residents speak other language at home 704 56.0% Speak English very well553 44.0% Speak English less than very well
English speakers - Born in the United States 88.6% of residents of Grovetown speak English at home.
6.5% of residents speak Spanish at home 500 91.2% Speak English very well48 8.8% Speak English less than very well5.7% of residents speak other language at home 431 88.9% Speak English very well54 11.1% Speak English less than very well
English speakers - Native, born elsewhere 21.7% of residents of Grovetown speak English at home.
77.6% of residents speak Spanish at home 87 24.6% Speak English very well267 75.4% Speak English less than very well10.3% of residents speak other language at home 47 100.0% Speak English very well
English speakers - Foreign-born 18.9% of residents of Grovetown speak English at home.
33.2% of residents speak Spanish at home 96 16.9% Speak English very well473 83.1% Speak English less than very well42.5% of residents speak other language at home 265 36.5% Speak English very well462 63.5% Speak English less than very well
White (Caucasian) - Speak only English Native:
90.5% (6,283)Foreign-born:
21.4% (162)
White (Caucasian) - Speak another language Native:
9.3% (642)Foreign-born:
80.2% (609)
Black or African American - Speak only English Native:
99.2% (4,534)Foreign-born:
6.8% (32)
Black or African American - Speak another language Native:
0.7% (31)Foreign-born:
94.9% (445)
Asian - Speak only English Native:
53.8% (48)Foreign-born:
38.1% (72)
Asian - Speak another language Native:
39.9% (35)Foreign-born:
69.0% (131)
Other race - Speak another language Native:
37.8% (213)Foreign-born:
100.0% (233)
Two or more races - Speak only English Native:
74.7% (823)Foreign-born:
100.0% (33)
White alone - Speak only English Native:
95.9% (5,786)Foreign-born:
47.6% (171)
White alone - Speak another language Native:
4.3% (259)Foreign-born:
42.7% (153)
Hispanic or Latino - Speak only English Native:
43.6% (771)Foreign-born:
9.4% (75)
Hispanic or Latino - Speak another language Native:
56.8% (1,005)Foreign-born:
100.0% (802)
Foreign-born residents in Grovetown 1,664 residents are foreign born (5.8% Latin America , 1.7% Europe , 1.1% Asia ).
This city:
10.0%Georgia:
10.4%
Marital status for residents in Grovetown Marital status - White (Caucasian) population 15 years and over
Males 31.6% Never married55.0% Now married1.4% Separated0.0% Widowed12.0% DivorcedFemales 22.4% Never married42.2% Now married0.0% Separated10.5% Widowed24.8% DivorcedWomen who did not give birth in the past 12 months Now married:
42.1% (949)Unmarried:
57.9% (1,307)
Marital status - Black or African American population 15 years and over
Males 43.6% Never married42.4% Now married0.5% Separated0.7% Widowed12.8% DivorcedFemales 36.0% Never married37.3% Now married16.4% Separated4.8% Widowed5.5% DivorcedWomen who gave birth in the past 12 months Now married:
51.9% (47)Unmarried:
48.1% (43)
Women who did not give birth in the past 12 months Now married:
53.9% (1,039)Unmarried:
46.1% (889)
Marital status - Asian population 15 years and over
Males 80.0% Never married20.0% Now married0.0% Separated0.0% Widowed0.0% DivorcedFemales 30.7% Never married69.3% Now married0.0% Separated0.0% Widowed0.0% DivorcedWomen who gave birth in the past 12 months Now married:
100.0% (35)Unmarried:
0.0% (0)
Women who did not give birth in the past 12 months Now married:
44.4% (49)Unmarried:
55.6% (61)
Marital status - Other race population 15 years and over
Males 27.0% Never married52.2% Now married0.0% Separated0.0% Widowed20.9% DivorcedFemales 14.8% Never married38.7% Now married0.0% Separated0.0% Widowed46.5% DivorcedWomen who gave birth in the past 12 months Now married:
100.0% (36)Unmarried:
0.0% (0)
Women who did not give birth in the past 12 months Now married:
55.6% (89)Unmarried:
44.4% (71)
Marital status - Two or more races population 15 years and over
Males 83.1% Never married16.9% Now married0.0% Separated0.0% Widowed0.0% DivorcedFemales 14.6% Never married76.8% Now married0.0% Separated0.0% Widowed8.6% DivorcedWomen who gave birth in the past 12 months Now married:
0.0% (0)Unmarried:
100.0% (30)
Women who did not give birth in the past 12 months Now married:
66.9% (149)Unmarried:
33.1% (74)
Marital status - White alone, not Hispanic / Latino population 15 years and over
Males 23.7% Never married59.0% Now married1.8% Separated0.0% Widowed15.5% DivorcedFemales 21.0% Never married41.8% Now married0.0% Separated11.7% Widowed25.5% DivorcedWomen who did not give birth in the past 12 months Now married:
41.4% (800)Unmarried:
58.6% (1,132)
Marital status - Hispanic or Latino population 15 years and over
Males 54.2% Never married44.6% Now married0.0% Separated0.0% Widowed1.2% DivorcedFemales 44.5% Never married38.1% Now married0.0% Separated4.1% Widowed13.4% DivorcedWomen who gave birth in the past 12 months Now married:
58.3% (31)Unmarried:
41.7% (22)
Women who did not give birth in the past 12 months Now married:
34.3% (294)Unmarried:
65.7% (563)
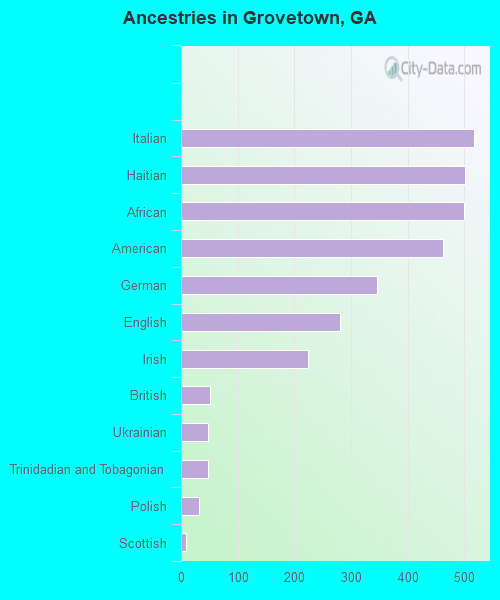
Ancestries in Grovetown
518 5.5% Italian502 5.3% Haitian500 5.3% African462 4.9% American346 3.6% German280 3.0% English224 2.4% Irish51 0.5% British48 0.5% Ukrainian47 0.5% Trinidadian and Tobagonian32 0.3% Polish9 0.09% Scottish
Geographical mobility in Grovetown Same house 1 year ago 7,003 86.4% White (Caucasian)4,805 83.2% Black or African American299 99.5% American Indian / Alaska Native240 95.0% Asian919 86.0% Other race1,404 92.9% Two or more races5,641 84.7% White alone, not Hispanic / Latino2,491 91.5% Hispanic or LatinoMoved within same county 254 3.1% White / Caucasian337 5.8% Black or African American17 1.5% Other race26 1.7% Two or more races259 3.9% White alone, not Hispanic / Latino32 1.2% Hispanic or LatinoMoved within same state 216 2.7% White / Caucasian136 2.4% Black or African American156 14.6% Other race213 3.2% White alone, not Hispanic / Latino134 4.9% Hispanic or LatinoMoved from different state 395 4.9% White / Caucasian279 4.8% Black or African American42 2.8% Two or more races305 4.6% White alone, not Hispanic / Latino73 2.7% Hispanic or LatinoMoved from abroad 137 1.7% White14 5.4% Asian166 2.5% White alone, not Hispanic / Latino
Children Nativity (place of birth) in Grovetown
Children under 6 years - Living with two parents Both parents native 772 100.0% NativeBoth parents foreign-born 83 100.0% Foreign-bornOne native, one foreign-born parent 108 100.0% NativeChildren under 6 years - Living with one parent Native parent 765 100.0% Native
Children 6 to 17 years - Living with two parents Both parents native 1,407 100.0% NativeBoth parents foreign-born 29 100.0% NativeOne native, one foreign-born parent 131 100.0% NativeChildren 6 to 17 years - Living with one parent Native parent 624 100.0% Native
Grandparents responsible for own grandchildren in Grovetown
Grandparents (30 to 59 years) White / Caucasian 65 10.8% Responsible for grandchildren537 89.2% Not responsible for grandchildrenBlack or African American 58 100.0% Not responsible for grandchildrenOther race 41 100.0% Not responsible for grandchildrenWhite alone, not Hispanic / Latino 71 11.6% Responsible for grandchildren537 88.4% Not responsible for grandchildrenHispanic or Latino 29 100.0% Not responsible for grandchildrenGrandparents (60 years and over) White / Caucasian 56 19.6% Responsible for grandchildren229 80.4% Not responsible for grandchildrenWhite alone, not Hispanic / Latino 59 20.6% Responsible for grandchildren229 79.4% Not responsible for grandchildren