Races in Groveton, Virginia (VA) Detailed Stats
Data:
Races - White alone (%)
Races - White alone (% change since 2000)
Races - Black alone (%)
Races - Black alone (% change since 2000)
Races - American Indian alone (%)
Races - American Indian alone (% change since 2000)
Races - Asian alone (%)
Races - Asian alone (% change since 2000)
Races - Hispanic (%)
Races - Hispanic (% change since 2000)
Races - Native Hawaiian and Other Pacific Islander alone (%)
Races - Native Hawaiian and Other Pacific Islander alone (% change since 2000)
Races - Two or more races(%)
Races - Two or more races(% change since 2000)
Races - Other race alone (%)
Races - Other race alone (% change since 2000)
Racial diversity
Place of birth - Born in state of residence (%)
Place of birth - Born in state of residence (%) - White
Place of birth - Born in state of residence (%) - Black or African American
Place of birth - Born in state of residence (%) - Asian
Place of birth - Born in state of residence (%) - Hispanic or Latino
Place of birth - Born in state of residence (%) - American Indian and Alaska Native
Place of birth - Born in state of residence (%) - Multirace
Place of birth - Born in state of residence (%) - Other Race
Place of birth - Born in other state (%)
Place of birth - Born in other state (%) - White
Place of birth - Born in other state (%) - Black or African American
Place of birth - Born in other state (%) - Asian
Place of birth - Born in other state (%) - Hispanic or Latino
Place of birth - Born in other state (%) - American Indian and Alaska Native
Place of birth - Born in other state (%) - Multirace
Place of birth - Born in other state (%) - Other Race
Place of birth - Native, outside of US (%)
Place of birth - Native, outside of US (%) - White
Place of birth - Native, outside of US (%) - Black or African American
Place of birth - Native, outside of US (%) - Asian
Place of birth - Native, outside of US (%) - Hispanic or Latino
Place of birth - Native, outside of US (%) - American Indian and Alaska Native
Place of birth - Native, outside of US (%) - Multirace
Place of birth - Native, outside of US (%) - Other Race
Place of birth - Foreign born (%)
Place of birth - Foreign born (%) - White
Place of birth - Foreign born (%) - Black or African American
Place of birth - Foreign born (%) - Asian
Place of birth - Foreign born (%) - Hispanic or Latino
Place of birth - Foreign born (%) - American Indian and Alaska Native
Place of birth - Foreign born (%) - Multirace
Place of birth - Foreign born (%) - Other Race
Residents speaking English at home (%)
Residents speaking English at home - Born in the United States (%)
Residents speaking English at home - Native, born elsewhere (%)
Residents speaking English at home - Foreign born (%)
Residents speaking Spanish at home (%)
Residents speaking Spanish at home - Born in the United States (%)
Residents speaking Spanish at home - Native, born elsewhere (%)
Residents speaking Spanish at home - Foreign born (%)
Residents speaking other language at home (%)
Residents speaking other language at home - Born in the United States (%)
Residents speaking other language at home - Native, born elsewhere (%)
Residents speaking other language at home - Foreign born (%)
Marital status - Never married (%)
Marital status - Now married (%)
Marital status - Separated (%)
Marital status - Widowed (%)
Marital status - Divorced (%)
Ancestries Reported - Arab (%)
Ancestries Reported - Czech (%)
Ancestries Reported - Danish (%)
Ancestries Reported - Dutch (%)
Ancestries Reported - English (%)
Ancestries Reported - French (%)
Ancestries Reported - French Canadian (%)
Ancestries Reported - German (%)
Ancestries Reported - Greek (%)
Ancestries Reported - Hungarian (%)
Ancestries Reported - Irish (%)
Ancestries Reported - Italian (%)
Ancestries Reported - Lithuanian (%)
Ancestries Reported - Norwegian (%)
Ancestries Reported - Polish (%)
Ancestries Reported - Portuguese (%)
Ancestries Reported - Russian (%)
Ancestries Reported - Scotch-Irish (%)
Ancestries Reported - Scottish (%)
Ancestries Reported - Slovak (%)
Ancestries Reported - Subsaharan African (%)
Ancestries Reported - Swedish (%)
Ancestries Reported - Swiss (%)
Ancestries Reported - Ukrainian (%)
Ancestries Reported - United States (%)
Ancestries Reported - Welsh (%)
Ancestries Reported - West Indian (%)
Ancestries Reported - Other (%)
Geographical mobility - Same house 1 year ago (%)
Geographical mobility - Same house 1 year ago (%) - White
Geographical mobility - Same house 1 year ago (%) - Black or African American
Geographical mobility - Same house 1 year ago (%) - Asian
Geographical mobility - Same house 1 year ago (%) - Hispanic or Latino
Geographical mobility - Same house 1 year ago (%) - American Indian and Alaska Native
Geographical mobility - Same house 1 year ago (%) - Multirace
Geographical mobility - Same house 1 year ago (%) - Other Race
Geographical mobility - Moved within same county (%)
Geographical mobility - Moved within same county (%) - White
Geographical mobility - Moved within same county (%) - Black or African American
Geographical mobility - Moved within same county (%) - Asian
Geographical mobility - Moved within same county (%) - Hispanic or Latino
Geographical mobility - Moved within same county (%) - American Indian and Alaska Native
Geographical mobility - Moved within same county (%) - Multirace
Geographical mobility - Moved within same county (%) - Other Race
Geographical mobility - Moved from different county within same state (%)
Geographical mobility - Moved from different county within same state (%) - White
Geographical mobility - Moved from different county within same state (%) - Black or African American
Geographical mobility - Moved from different county within same state (%) - Asian
Geographical mobility - Moved from different county within same state (%) - Hispanic or Latino
Geographical mobility - Moved from different county within same state (%) - American Indian and Alaska Native
Geographical mobility - Moved from different county within same state (%) - Multirace
Geographical mobility - Moved from different county within same state (%) - Other Race
Geographical mobility - Moved from different state (%)
Geographical mobility - Moved from different state (%) - White
Geographical mobility - Moved from different state (%) - Black or African American
Geographical mobility - Moved from different state (%) - Asian
Geographical mobility - Moved from different state (%) - Hispanic or Latino
Geographical mobility - Moved from different state (%) - American Indian and Alaska Native
Geographical mobility - Moved from different state (%) - Multirace
Geographical mobility - Moved from different state (%) - Other Race
Geographical mobility - Moved from abroad (%)
Geographical mobility - Moved from abroad (%) - White
Geographical mobility - Moved from abroad (%) - Black or African American
Geographical mobility - Moved from abroad (%) - Asian
Geographical mobility - Moved from abroad (%) - Hispanic or Latino
Geographical mobility - Moved from abroad (%) - American Indian and Alaska Native
Geographical mobility - Moved from abroad (%) - Multirace
Geographical mobility - Moved from abroad (%) - Other Race
Place of birth for the foreign-born population - Ireland (%)
Place of birth for the foreign-born population - Denmark (%)
Place of birth for the foreign-born population - Norway (%)
Place of birth for the foreign-born population - Sweden (%)
Place of birth for the foreign-born population - United Kingdom (%)
Place of birth for the foreign-born population - England (%)
Place of birth for the foreign-born population - Scotland (%)
Place of birth for the foreign-born population - Other Northern Europe (%)
Place of birth for the foreign-born population - Austria (%)
Place of birth for the foreign-born population - Belgium (%)
Place of birth for the foreign-born population - France (%)
Place of birth for the foreign-born population - Germany (%)
Place of birth for the foreign-born population - Netherlands (%)
Place of birth for the foreign-born population - Switzerland (%)
Place of birth for the foreign-born population - Other Western Europe (%)
Place of birth for the foreign-born population - Greece (%)
Place of birth for the foreign-born population - Italy (%)
Place of birth for the foreign-born population - Portugal (%)
Place of birth for the foreign-born population - Spain (%)
Place of birth for the foreign-born population - Other Southern Europe (%)
Place of birth for the foreign-born population - Albania (%)
Place of birth for the foreign-born population - Belarus (%)
Place of birth for the foreign-born population - Bosnia and Herzegovina (%)
Place of birth for the foreign-born population - Bulgaria (%)
Place of birth for the foreign-born population - Croatia (%)
Place of birth for the foreign-born population - Czechoslovakia (%)
Place of birth for the foreign-born population - Hungary (%)
Place of birth for the foreign-born population - Latvia (%)
Place of birth for the foreign-born population - Lithuania (%)
Place of birth for the foreign-born population - North Macedonia (Macedonia) (%)
Place of birth for the foreign-born population - Moldova (%)
Place of birth for the foreign-born population - Poland (%)
Place of birth for the foreign-born population - Romania (%)
Place of birth for the foreign-born population - Russia (%)
Place of birth for the foreign-born population - Serbia (%)
Place of birth for the foreign-born population - Ukraine (%)
Place of birth for the foreign-born population - Other Eastern Europe (%)
Place of birth for the foreign-born population - China (%)
Place of birth for the foreign-born population - Hong Kong (%)
Place of birth for the foreign-born population - Taiwan (%)
Place of birth for the foreign-born population - Japan (%)
Place of birth for the foreign-born population - Korea (%)
Place of birth for the foreign-born population - Other Eastern Asia (%)
Place of birth for the foreign-born population - Afghanistan (%)
Place of birth for the foreign-born population - Bangladesh (%)
Place of birth for the foreign-born population - India (%)
Place of birth for the foreign-born population - Iran (%)
Place of birth for the foreign-born population - Kazakhstan (%)
Place of birth for the foreign-born population - Nepal (%)
Place of birth for the foreign-born population - Pakistan (%)
Place of birth for the foreign-born population - Sri Lanka (%)
Place of birth for the foreign-born population - Uzbekistan (%)
Place of birth for the foreign-born population - Other South Central Asia (%)
Place of birth for the foreign-born population - Burma (%)
Place of birth for the foreign-born population - Cambodia (%)
Place of birth for the foreign-born population - Indonesia (%)
Place of birth for the foreign-born population - Laos (%)
Place of birth for the foreign-born population - Malaysia (%)
Place of birth for the foreign-born population - Philippines (%)
Place of birth for the foreign-born population - Singapore (%)
Place of birth for the foreign-born population - Thailand (%)
Place of birth for the foreign-born population - Vietnam (%)
Place of birth for the foreign-born population - Other South Eastern Asia (%)
Place of birth for the foreign-born population - Armenia (%)
Place of birth for the foreign-born population - Iraq (%)
Place of birth for the foreign-born population - Israel (%)
Place of birth for the foreign-born population - Jordan (%)
Place of birth for the foreign-born population - Kuwait (%)
Place of birth for the foreign-born population - Lebanon (%)
Place of birth for the foreign-born population - Saudi Arabia (%)
Place of birth for the foreign-born population - Syria (%)
Place of birth for the foreign-born population - Turkey (%)
Place of birth for the foreign-born population - Yemen (%)
Place of birth for the foreign-born population - Other Western Asia (%)
Place of birth for the foreign-born population - Eritrea (%)
Place of birth for the foreign-born population - Ethiopia (%)
Place of birth for the foreign-born population - Kenya (%)
Place of birth for the foreign-born population - Somalia (%)
Place of birth for the foreign-born population - Uganda (%)
Place of birth for the foreign-born population - Zimbabwe (%)
Place of birth for the foreign-born population - Other Eastern Africa (%)
Place of birth for the foreign-born population - Cameroon (%)
Place of birth for the foreign-born population - Congo (%)
Place of birth for the foreign-born population - Democratic Republic of Congo (Zaire) (%)
Place of birth for the foreign-born population - Other Middle Africa (%)
Place of birth for the foreign-born population - Egypt (%)
Place of birth for the foreign-born population - Morocco (%)
Place of birth for the foreign-born population - Sudan (%)
Place of birth for the foreign-born population - Other Northern Africa (%)
Place of birth for the foreign-born population - South Africa (%)
Place of birth for the foreign-born population - Other Southern Africa (%)
Place of birth for the foreign-born population - Cabo Verde (%)
Place of birth for the foreign-born population - Ghana (%)
Place of birth for the foreign-born population - Liberia (%)
Place of birth for the foreign-born population - Nigeria (%)
Place of birth for the foreign-born population - Senegal (%)
Place of birth for the foreign-born population - Sierra Leone (%)
Place of birth for the foreign-born population - Other Western Africa (%)
Place of birth for the foreign-born population - Australia (%)
Place of birth for the foreign-born population - New Zealand (%)
Place of birth for the foreign-born population - Fiji (%)
Place of birth for the foreign-born population - Micronesia (%)
Place of birth for the foreign-born population - Bahamas (%)
Place of birth for the foreign-born population - Barbados (%)
Place of birth for the foreign-born population - Cuba (%)
Place of birth for the foreign-born population - Dominica (%)
Place of birth for the foreign-born population - Dominican Republic (%)
Place of birth for the foreign-born population - Grenada (%)
Place of birth for the foreign-born population - Haiti (%)
Place of birth for the foreign-born population - Jamaica (%)
Place of birth for the foreign-born population - St. Vincent and the Grenadines (%)
Place of birth for the foreign-born population - Trinidad and Tobago (%)
Place of birth for the foreign-born population - West Indies (%)
Place of birth for the foreign-born population - Other Caribbean (%)
Place of birth for the foreign-born population - Belize (%)
Place of birth for the foreign-born population - Costa Rica (%)
Place of birth for the foreign-born population - El Salvador (%)
Place of birth for the foreign-born population - Guatemala (%)
Place of birth for the foreign-born population - Honduras (%)
Place of birth for the foreign-born population - Mexico (%)
Place of birth for the foreign-born population - Nicaragua (%)
Place of birth for the foreign-born population - Panama (%)
Place of birth for the foreign-born population - Other Central America (%)
Place of birth for the foreign-born population - Argentina (%)
Place of birth for the foreign-born population - Bolivia (%)
Place of birth for the foreign-born population - Brazil (%)
Place of birth for the foreign-born population - Chile (%)
Place of birth for the foreign-born population - Colombia (%)
Place of birth for the foreign-born population - Ecuador (%)
Place of birth for the foreign-born population - Guyana (%)
Place of birth for the foreign-born population - Peru (%)
Place of birth for the foreign-born population - Uruguay (%)
Place of birth for the foreign-born population - Venezuela (%)
Place of birth for the foreign-born population - Other South America (%)
Place of birth for the foreign-born population - Canada (%)
Place of birth for the foreign-born population - Other Northern America (%)
Place of birth for the foreign-born population - Other (%)
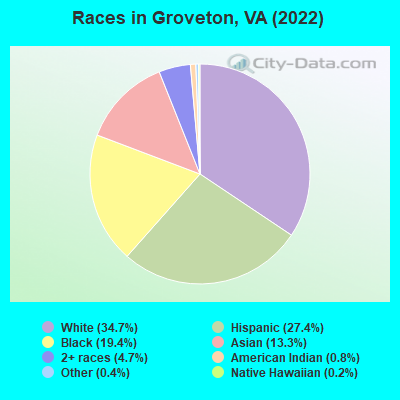
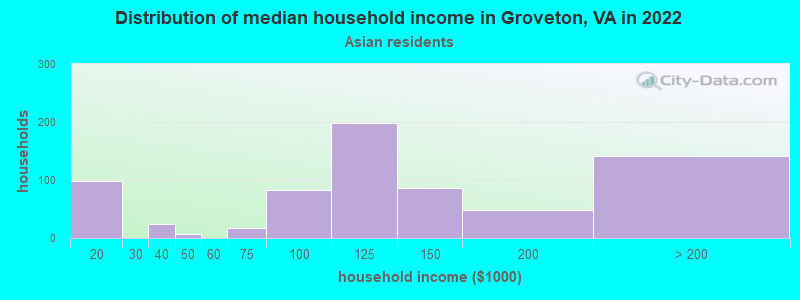
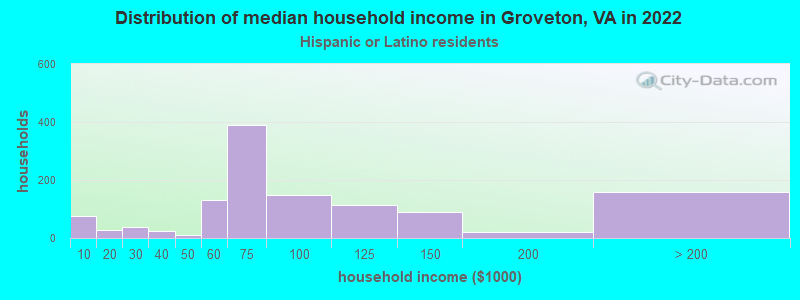
According to 2022 data, the most numerous races in Groveton, VA are White alone (5,040 residents), Black alone (2,822 residents), and Hispanic (3,983 residents). 56.7% of Groveton residents speak English at home. 32.8% of Groveton, VA residents are foreign-born (15.6% born in Latin America, 10.4% born in Asia, 5.8% born in Africa), which is 63.4% greater than the foreign-born rate of 12.0% across the entire state of Virginia.
Race distribution in Groveton
2000 2022
4,965,637 70.2% White alone 1,376,378 19.4% Black alone 329,540 4.7% Hispanic 259,277 3.7% Asian alone 114,022 1.6% Two or more races 18,596 0.3% American Indian alone 11,685 0.2% Other race alone 3,380 0.05% Native Hawaiian and Other
5,095,130 58.7% White alone 1,594,785 18.4% Black alone 905,750 10.4% Hispanic 602,881 6.9% Asian alone 406,047 4.7% Two or more races 60,419 0.7% Other race alone 11,738 0.1% American Indian alone 6,869 0.08% Native Hawaiian and Other
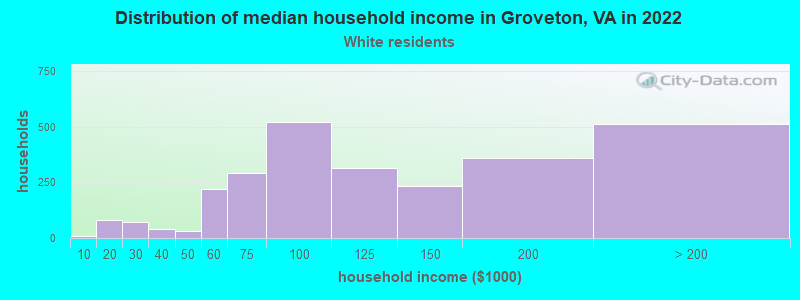
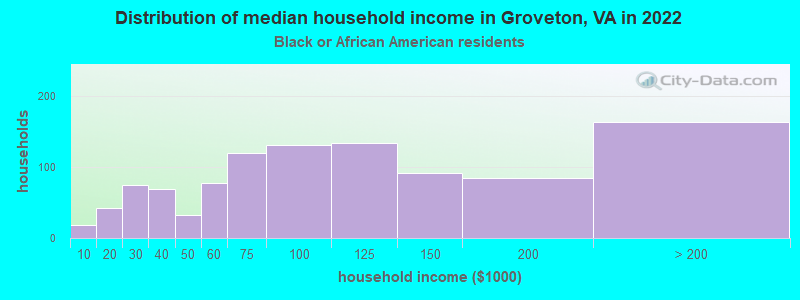
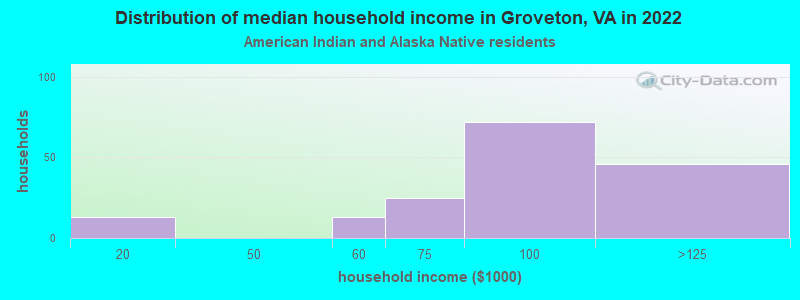
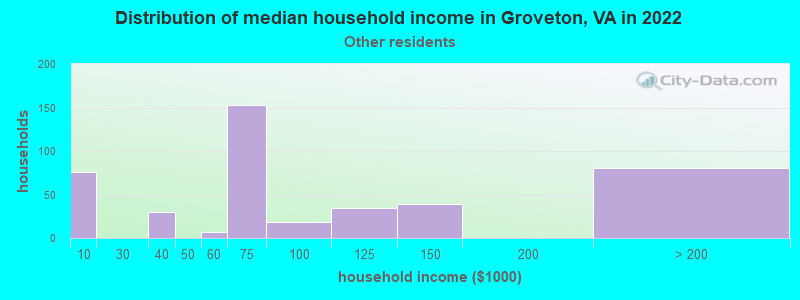
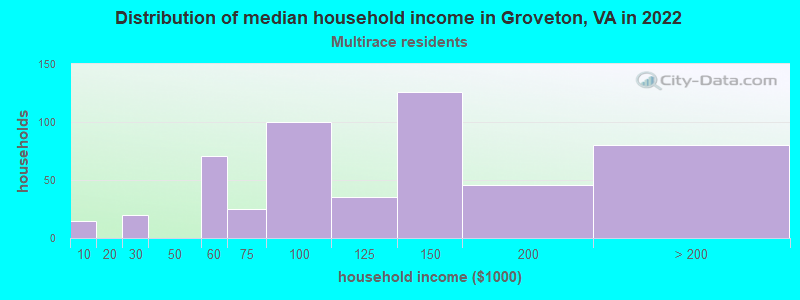
Income and house value in Groveton Median household income in 2022 $119,151 White non-Hispanic householders$85,466 Black householders$84,279 American Indian and Alaska Native householders$117,039 Asian householders$66,400 Some other race householders$126,397 Two or more races householders$72,824 Hispanic or Latino race householdersMedian 2022 house value $569,938 White Non-Hispanic householders$519,298 Black or African American householders$394,151 American Indian or Alaska Native householders $544,779 Asian householders$483,818 Some other race householders$530,265 Two or more races householders$481,560 Hispanic or Latino householders
Median age by race in Groveton
39.9 Median age for White residents39.3 41.1 44.5 Median age for Black or African American residents48.6 36.3 43.1 Median age for American Indian / Alaska Native residents56.1 28.7 39.0 Median age for Asian residents37.8 42.0 45.7 Median age for Native Hawaiian / Pacific Islander residents-558,791,801.0 -584,518,166.9 21.2 Median age for Other race residents19.2 26.6 29.2 Median age for Two or more races residents18.0 35.5 40.1 Median age for White alone residents39.7 40.3 30.3 Median age for Hispanic or Latino residents25.2 34.6
Owner/renter occupied households by race in Groveton
House owners and renters - White residents 1,713 64.3% Owner occupied953 35.7% Renter occupiedHouse owners and renters - Black or African American residents 504 46.4% Owner occupied582 53.6% Renter occupiedHouse owners and renters - American Indian / Alaska Native residents 156 92.4% Owner occupied13 7.6% Renter occupiedHouse owners and renters - Asian residents 364 51.4% Owner occupied345 48.6% Renter occupiedHouse owners and renters - Native Hawaiian / Pacific Islander residents 10 100.0% Owner occupiedHouse owners and renters - Other race residents 100 27.5% Owner occupied263 72.5% Renter occupiedHouse owners and renters - Two or more races residents 280 50.3% Owner occupied277 49.7% Renter occupiedHouse owners and renters - White alone residents 1,587 69.9% Owner occupied684 30.1% Renter occupiedHouse owners and renters - Hispanic or Latino residents 402 33.6% Owner occupied793 66.4% Renter occupied
Language usage in Groveton
English speakers - Total 56.7% of residents of Groveton speak English at home.
22.6% of residents speak Spanish at home 1,534 49.9% Speak English very well1,542 50.1% Speak English less than very well20.3% of residents speak other language at home 1,669 60.4% Speak English very well1,096 39.6% Speak English less than very well
English speakers - Born in the United States 91.1% of residents of Groveton speak English at home.
6.1% of residents speak Spanish at home 269 89.7% Speak English very well31 10.3% Speak English less than very well2.8% of residents speak other language at home 102 73.4% Speak English very well37 26.6% Speak English less than very well
English speakers - Native, born elsewhere 56.1% of residents of Groveton speak English at home.
3.6% of residents speak Spanish at home 12 100.0% Speak English less than very well42.4% of residents speak other language at home 114 81.4% Speak English very well26 18.6% Speak English less than very well
English speakers - Foreign-born 8.3% of residents of Groveton speak English at home.
44.2% of residents speak Spanish at home 706 33.7% Speak English very well1,392 66.3% Speak English less than very well46.8% of residents speak other language at home 1,188 53.4% Speak English very well1,037 46.6% Speak English less than very well
White (Caucasian) - Speak only English Native:
92.8% (4,133)Foreign-born:
4.7% (49)
White (Caucasian) - Speak another language Native:
7.0% (311)Foreign-born:
87.7% (913)
Black or African American - Speak only English Native:
93.3% (1,992)Foreign-born:
7.9% (44)
Black or African American - Speak another language Native:
5.7% (122)Foreign-born:
88.3% (492)
American Indian / Alaska Native - Speak only English Native:
100.0% (105)Foreign-born:
28.1% (10)
Asian - Speak only English Native:
29.3% (141)Foreign-born:
15.6% (220)
Asian - Speak another language Native:
72.4% (348)Foreign-born:
84.7% (1,197)
Other race - Speak only English Native:
21.8% (163)Foreign-born:
11.6% (73)
Other race - Speak another language Native:
71.7% (535)Foreign-born:
89.2% (565)
Two or more races - Speak only English Native:
71.6% (722)Foreign-born:
1.8% (20)
Two or more races - Speak another language Native:
28.6% (288)Foreign-born:
98.4% (1,101)
White alone - Speak only English Native:
96.1% (4,022)Foreign-born:
9.7% (53)
White alone - Speak another language Native:
4.1% (171)Foreign-born:
87.7% (484)
Hispanic or Latino - Speak only English Native:
34.9% (533)Foreign-born:
3.3% (71)
Hispanic or Latino - Speak another language Native:
62.9% (960)Foreign-born:
96.7% (2,093)
Foreign-born residents in Groveton 4,770 residents are foreign born (15.6% Latin America , 10.4% Asia , 5.8% Africa ).
This city:
32.8%Virginia:
12.6%
Marital status for residents in Groveton Marital status - White (Caucasian) population 15 years and over
Males 29.9% Never married61.5% Now married0.2% Separated2.4% Widowed6.0% DivorcedFemales 21.8% Never married55.0% Now married0.2% Separated10.1% Widowed12.9% DivorcedWomen who gave birth in the past 12 months Now married:
88.7% (111)Unmarried:
11.3% (14)
Women who did not give birth in the past 12 months Now married:
60.4% (717)Unmarried:
39.6% (469)
Marital status - Black or African American population 15 years and over
Males 38.9% Never married37.2% Now married3.9% Separated0.0% Widowed20.0% DivorcedFemales 50.8% Never married33.1% Now married3.0% Separated3.5% Widowed9.7% DivorcedWomen who gave birth in the past 12 months Now married:
9.5% (6)Unmarried:
90.5% (56)
Women who did not give birth in the past 12 months Now married:
35.9% (241)Unmarried:
64.1% (430)
Marital status - American Indian / Alaska Native population 15 years and over
Males 0.0% Never married38.5% Now married0.0% Separated0.0% Widowed61.5% DivorcedFemales 7.1% Never married73.8% Now married0.0% Separated0.0% Widowed19.0% DivorcedWomen who did not give birth in the past 12 months Now married:
73.8% (66)Unmarried:
26.2% (23)
Marital status - Asian population 15 years and over
Males 52.7% Never married44.3% Now married0.0% Separated1.8% Widowed1.3% DivorcedFemales 32.0% Never married50.9% Now married0.0% Separated13.6% Widowed3.5% DivorcedWomen who gave birth in the past 12 months Now married:
100.0% (41)Unmarried:
0.0% (0)
Women who did not give birth in the past 12 months Now married:
42.1% (228)Unmarried:
57.9% (313)
Marital status - Native Hawaiian / Pacific Islander population 15 years and over
Males 37.5% Never married62.5% Now married0.0% Separated0.0% Widowed0.0% DivorcedFemales 0.0% Never married100.0% Now married0.0% Separated0.0% Widowed0.0% DivorcedWomen who did not give birth in the past 12 months Now married:
100.0% (11)Unmarried:
0.0% (0)
Marital status - Other race population 15 years and over
Males 55.6% Never married44.4% Now married0.0% Separated0.0% Widowed0.0% DivorcedFemales 53.0% Never married34.3% Now married12.7% Separated0.0% Widowed0.0% DivorcedWomen who gave birth in the past 12 months Now married:
100.0% (48)Unmarried:
0.0% (0)
Women who did not give birth in the past 12 months Now married:
29.6% (136)Unmarried:
70.4% (324)
Marital status - Two or more races population 15 years and over
Males 42.9% Never married52.6% Now married0.0% Separated0.0% Widowed4.5% DivorcedFemales 42.4% Never married52.9% Now married0.0% Separated0.0% Widowed4.7% DivorcedWomen who did not give birth in the past 12 months Now married:
36.1% (221)Unmarried:
63.9% (390)
Marital status - White alone, not Hispanic / Latino population 15 years and over
Males 26.3% Never married63.6% Now married0.2% Separated3.1% Widowed6.8% DivorcedFemales 23.1% Never married52.6% Now married0.2% Separated12.5% Widowed11.6% DivorcedWomen who gave birth in the past 12 months Now married:
86.6% (100)Unmarried:
13.4% (16)
Women who did not give birth in the past 12 months Now married:
54.5% (521)Unmarried:
45.5% (436)
Marital status - Hispanic or Latino population 15 years and over
Males 45.3% Never married49.2% Now married0.0% Separated0.0% Widowed5.5% DivorcedFemales 38.1% Never married49.8% Now married3.9% Separated0.4% Widowed7.7% DivorcedWomen who gave birth in the past 12 months Now married:
100.0% (61)Unmarried:
0.0% (0)
Women who did not give birth in the past 12 months Now married:
46.9% (520)Unmarried:
53.1% (588)
Ancestries in Groveton
336 4.5% English249 3.3% American190 2.5% Irish156 2.1% Italian137 1.8% European109 1.5% Ethiopian108 1.4% German89 1.2% Scottish85 1.1% Yugoslavian66 0.9% Cypriot41 0.5% Scotch-Irish37 0.5% Romanian34 0.5% Polish30 0.4% African30 0.4% Barbadian20 0.3% Eastern European18 0.2% Brazilian18 0.2% French Canadian15 0.2% Belgian14 0.2% Hungarian13 0.2% Dutch13 0.2% Iranian13 0.2% Northern European11 0.1% Arab9 0.1% Guyanese9 0.1% Ghanaian8 0.1% Egyptian7 0.09% Welsh6 0.08% Czech6 0.08% Norwegian3 0.04% Danish2 0.03% Moroccan
Geographical mobility in Groveton Same house 1 year ago 5,251 88.4% White (Caucasian)2,722 94.6% Black or African American109 73.5% American Indian / Alaska Native1,639 86.3% Asian31 95.3% Native Hawaiian / Pacific Islander1,221 88.5% Other race2,185 91.9% Two or more races4,400 88.8% White alone, not Hispanic / Latino3,418 87.3% Hispanic or LatinoMoved within same county 369 6.2% White / Caucasian93 3.2% Black or African American56 2.9% Asian86 6.2% Other race14 0.6% Two or more races299 6.0% White alone, not Hispanic / Latino269 6.9% Hispanic or LatinoMoved within same state 126 2.1% White / Caucasian16 0.6% Black or African American67 1.3% White alone, not Hispanic / Latino72 1.8% Hispanic or LatinoMoved from different state 154 2.6% White / Caucasian23 0.8% Black or African American32 21.2% American Indian / Alaska Native144 7.6% Asian27 1.1% Two or more races146 3.0% White alone, not Hispanic / Latino63 1.6% Hispanic or LatinoMoved from abroad 29 0.5% White17 0.6% Black or African American45 2.4% Asian59 4.3% Other race52 2.2% Two or more races32 0.7% White alone, not Hispanic / Latino60 1.5% Hispanic or Latino
Children Nativity (place of birth) in Groveton
Children under 6 years - Living with two parents Both parents native 503 100.0% NativeBoth parents foreign-born 139 100.0% NativeOne native, one foreign-born parent 124 100.0% NativeChildren under 6 years - Living with one parent Native parent 165 100.0% NativeForeign-born parent 96 81.5% Native22 18.5% Foreign-bornChildren 6 to 17 years - Living with two parents Both parents native 476 94.0% Native30 6.0% Foreign-bornBoth parents foreign-born 168 37.6% Native279 62.4% Foreign-bornOne native, one foreign-born parent 250 100.0% NativeChildren 6 to 17 years - Living with one parent Foreign-born parent 668 57.6% Native492 42.4% Foreign-born
Grandparents responsible for own grandchildren in Groveton
Grandparents (30 to 59 years) Black or African American 11 100.0% Responsible for grandchildrenGrandparents (60 years and over) Black or African American 34 34.2% Responsible for grandchildren66 65.8% Not responsible for grandchildren