Races in Grove, Oklahoma (OK) Detailed Stats
Ancestries, Foreign-born residents, place of birth
Settings
X


Recent posts about races in Grove, Oklahoma on our local forum with over 2,400,000 registered users:
 | Where do we live?? Moving from WA (16 replies) |
| Need information about mysterious building in Grove, OK (0 replies) |
| I like Oklahoma and think it's underrated (129 replies) |
| Lake house near Tulsa? (7 replies) |
| Possible relocation to Grove or Miami (2 replies) |
| Move to Guthrie ?? (43 replies) |
Latest news about races in Grove, OK collected exclusively by city-data.com from local newspapers, TV, and radio stations
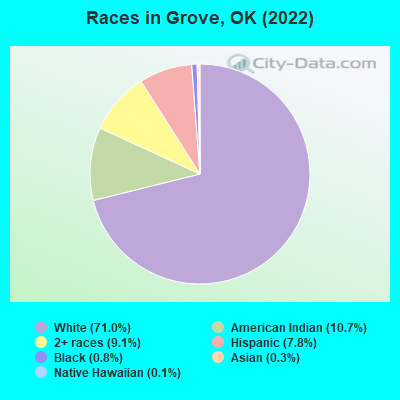
According to 2022 data, the most numerous races in Grove, OK are White alone (5,038 residents), Hispanic (552 residents), and Two or more races (648 residents). 95.5% of Grove residents speak English at home. 2.4% of Grove, OK residents are foreign-born (1.0% born in Latin America, 0.8% born in Asia, 0.3% born in North America), which is 152.0% less than the foreign-born rate of 6.0% across the entire state of Oklahoma.
Race distribution in Grove
2000
2022

- 4,19381.7%White alone
- 51810.1%American Indian alone
- 2995.8%Two or more races
- 881.7%Hispanic
- 270.5%Asian alone
- 40.08%Black alone
- 20.04%Native Hawaiian and Other
Pacific Islander alone

-
- 5,03871.0%White alone
- 75710.7%American Indian alone
- 6489.1%Two or more races
- 5527.8%Hispanic
- 580.8%Black alone
- 190.3%Asian alone
- 90.1%Native Hawaiian and Other
Pacific Islander alone
2000
2022
-
- 2,556,36874.1%White alone
- 266,1587.7%American Indian alone
- 257,9817.5%Black alone
- 179,3045.2%Hispanic
- 140,2494.1%Two or more races
- 46,1721.3%Asian alone
- 2,3220.07%Other race alone
- 2,1000.06%Native Hawaiian and Other
Pacific Islander alone

-
- 2,517,40362.6%White alone
- 486,69212.1%Hispanic
- 364,4539.1%Two or more races
- 273,6506.8%American Indian alone
- 268,5436.7%Black alone
- 92,6722.3%Asian alone
- 10,7860.3%Other race alone
- 5,6010.1%Native Hawaiian and Other
Pacific Islander alone

Income and house value in Grove
- Median household income in 2022
- $51,828White non-Hispanic householders
- $113,125American Indian and Alaska Native householders
- $69,249Two or more races householders
- Median 2022 house value
- $275,492White Non-Hispanic householders
- $263,327American Indian or Alaska Native householders
- $209,090Two or more races householders
- $285,123Hispanic or Latino householders
Household income for White non-Hispanic householders

Household income for Black householders

Household income for American Indian and Alaska Native householders

Household income for Two or more races householders

Household income for Hispanic or Latino race householders

Median age by race in Grove
- 54.4Median age for White residents
- 54.0Males
- 54.5Females
- 42.0Median age for Black or African American residents
- 42.3Males
- 40.6Females
- 38.3Median age for American Indian / Alaska Native residents
- 33.8Males
- 42.9Females
- -662,745,097.4Median age for Asian residents
- -662,601,625.4Males
- -666,666,666.0Females
- 35.2Median age for Native Hawaiian / Pacific Islander residents
- -675,324,674.6Males
- -767,251,461.2Females
- 30.6Median age for Other race residents
- 25.8Males
- 37.6Females
- 19.3Median age for Two or more races residents
- 28.7Males
- 16.5Females
- 53.7Median age for White alone residents
- 53.9Males
- 53.6Females
- 26.1Median age for Hispanic or Latino residents
- 30.3Males
- 17.1Females
Owner/renter occupied households by race in Grove
- House owners and renters - White residents
- 1,51965.8%Owner occupied
- 78934.2%Renter occupied
- House owners and renters - Black or African American residents
- 49.9%Owner occupied
- 3490.1%Renter occupied
- House owners and renters - American Indian / Alaska Native residents
- 21364.0%Owner occupied
- 12036.0%Renter occupied
- House owners and renters - Native Hawaiian / Pacific Islander residents
- 4100.0%Renter occupied
- House owners and renters - Other race residents
- 20100.0%Owner occupied
- House owners and renters - Two or more races residents
- 14048.1%Owner occupied
- 15251.9%Renter occupied
- House owners and renters - White alone residents
- 1,52866.4%Owner occupied
- 77333.6%Renter occupied
- House owners and renters - Hispanic or Latino residents
- 3226.8%Owner occupied
- 8873.2%Renter occupied
Language usage in Grove
- English speakers - Total
- 95.5% of residents of Grove speak English at home.
- 3.2% of residents speak Spanish at home
- 14365.3%Speak English very well
- 7634.7%Speak English less than very well
- 1.2% of residents speak other language at home
- 3136.9%Speak English very well
- 5363.1%Speak English less than very well
- English speakers - Born in the United States
- 95.3% of residents of Grove speak English at home.
- 4.8% of residents speak Spanish at home
- 12975.0%Speak English very well
- 4325.0%Speak English less than very well
- English speakers - Native, born elsewhere
- 95.3% of residents of Grove speak English at home.
- English speakers - Foreign-born
- 35.7% of residents of Grove speak English at home.
- 30.4% of residents speak Spanish at home
- 1427.5%Speak English very well
- 3772.5%Speak English less than very well
- 32.1% of residents speak other language at home
- 54100.0%Speak English less than very well
White (Caucasian) - Speak only English
| Native: | 99.8% (4,884) |
| Foreign-born: | 44.4% (24) |
White (Caucasian) - Speak another language
| Native: | 0.9% (45) |
| Foreign-born: | 61.1% (32) |
American Indian / Alaska Native - Speak only English
| Native: | 97.1% (740) |
| Foreign-born: | 93.4% (18) |
Other race - Speak another language
| Native: | 78.6% (83) |
| Foreign-born: | 100.0% (20) |
Two or more races - Speak only English
| Native: | 92.3% (786) |
| Foreign-born: | 71.9% (29) |
White alone - Speak only English
| Native: | 99.2% (4,839) |
| Foreign-born: | 43.5% (26) |
White alone - Speak another language
| Native: | 0.8% (39) |
| Foreign-born: | 56.2% (33) |
Hispanic or Latino - Speak only English
| Native: | 69.9% (279) |
| Foreign-born: | 32.7% (25) |
Hispanic or Latino - Speak another language
| Native: | 30.6% (122) |
| Foreign-born: | 69.9% (54) |
Foreign-born residents in Grove
169 residents are foreign born (1.0% Latin America, 0.8% Asia, 0.3% North America).
| This city: | 2.4% |
| Oklahoma: | 6.1% |


Marital status for residents in Grove
Marital status - White (Caucasian) population 15 years and over
- Males
- 23.0%Never married
- 61.6%Now married
- 3.8%Separated
- 7.0%Widowed
- 4.6%Divorced
- Females
- 16.3%Never married
- 50.8%Now married
- 0.0%Separated
- 11.5%Widowed
- 21.3%Divorced
Women who gave birth in the past 12 months
| Now married: | 72.2% (13) |
| Unmarried: | 27.8% (5) |
Women who did not give birth in the past 12 months
| Now married: | 46.8% (407) |
| Unmarried: | 53.2% (463) |
Marital status - Black or African American population 15 years and over
- Males
- 2.6%Never married
- 97.4%Now married
- 0.0%Separated
- 0.0%Widowed
- 0.0%Divorced
- Females
- 0.0%Never married
- 100.0%Now married
- 0.0%Separated
- 0.0%Widowed
- 0.0%Divorced
Women who did not give birth in the past 12 months
| Now married: | 100.0% (5) |
| Unmarried: | 0.0% (0) |
Marital status - American Indian / Alaska Native population 15 years and over
- Males
- 37.3%Never married
- 36.1%Now married
- 0.0%Separated
- 4.0%Widowed
- 22.6%Divorced
- Females
- 22.0%Never married
- 46.8%Now married
- 0.8%Separated
- 13.8%Widowed
- 16.7%Divorced
Women who did not give birth in the past 12 months
| Now married: | 43.8% (71) |
| Unmarried: | 56.2% (92) |
Marital status - Native Hawaiian / Pacific Islander population 15 years and over
- Males
- 0.0%Never married
- 100.0%Now married
- 0.0%Separated
- 0.0%Widowed
- 0.0%Divorced
- Females
- 0.0%Never married
- 100.0%Now married
- 0.0%Separated
- 0.0%Widowed
- 0.0%Divorced
Women who did not give birth in the past 12 months
| Now married: | 100.0% (4) |
| Unmarried: | 0.0% (0) |
Marital status - Other race population 15 years and over
- Males
- 39.1%Never married
- 37.0%Now married
- 0.0%Separated
- 0.0%Widowed
- 23.9%Divorced
- Females
- 0.0%Never married
- 100.0%Now married
- 0.0%Separated
- 0.0%Widowed
- 0.0%Divorced
Women who did not give birth in the past 12 months
| Now married: | 100.0% (45) |
| Unmarried: | 0.0% (0) |
Marital status - Two or more races population 15 years and over
- Males
- 25.1%Never married
- 48.6%Now married
- 15.8%Separated
- 0.0%Widowed
- 10.4%Divorced
- Females
- 30.5%Never married
- 42.4%Now married
- 3.4%Separated
- 11.8%Widowed
- 11.8%Divorced
Women who gave birth in the past 12 months
| Now married: | 100.0% (27) |
| Unmarried: | 0.0% (0) |
Women who did not give birth in the past 12 months
| Now married: | 27.5% (33) |
| Unmarried: | 72.5% (88) |
Marital status - White alone, not Hispanic / Latino population 15 years and over
- Males
- 22.3%Never married
- 62.0%Now married
- 3.8%Separated
- 7.1%Widowed
- 4.7%Divorced
- Females
- 16.0%Never married
- 51.9%Now married
- 0.0%Separated
- 11.8%Widowed
- 20.3%Divorced
Women who gave birth in the past 12 months
| Now married: | 72.2% (13) |
| Unmarried: | 27.8% (5) |
Women who did not give birth in the past 12 months
| Now married: | 47.6% (421) |
| Unmarried: | 52.4% (464) |
Marital status - Hispanic or Latino population 15 years and over
- Males
- 32.7%Never married
- 32.2%Now married
- 18.7%Separated
- 0.0%Widowed
- 16.4%Divorced
- Females
- 49.4%Never married
- 25.0%Now married
- 4.5%Separated
- 0.0%Widowed
- 21.2%Divorced
Women who did not give birth in the past 12 months
| Now married: | 37.4% (50) |
| Unmarried: | 62.6% (84) |
Ancestries in Grove

- 50014.7%American
- 45613.4%English
- 40912.0%German
- 2507.4%Irish
- 822.4%Scotch-Irish
- 521.5%Italian
- 511.5%Polish
- 411.2%Swedish
- 391.1%Iranian
- 351.0%British
- 260.8%Norwegian
- 250.7%Belgian
- 120.4%European
- 100.3%Northern European
- 80.2%Dutch
- 80.2%Welsh

Geographical mobility in Grove

- Same house 1 year ago
- 4,57991.4%White (Caucasian)
- 4068.6%Black or African American
- 70889.8%American Indian / Alaska Native
- 20100.0%Asian
- 15699.2%Other race
- 95594.0%Two or more races
- 4,65792.4%White alone, not Hispanic / Latino
- 44380.3%Hispanic or Latino

-
- Moved within same county
- 1963.9%White / Caucasian
- 1525.7%Black or African American
- 384.8%American Indian / Alaska Native
- 868.2%Native Hawaiian / Pacific Islander
- 151.5%Two or more races
- 1422.8%White alone, not Hispanic / Latino
- 7112.9%Hispanic or Latino

-
- Moved within same state
- 1272.5%White / Caucasian
- 435.5%American Indian / Alaska Native
- 151.4%Two or more races
- 1302.6%White alone, not Hispanic / Latino

-
- Moved from different state
- 1392.8%White / Caucasian
- 414.0%Two or more races
- 1452.9%White alone, not Hispanic / Latino
- 346.2%Hispanic or Latino

Children Nativity (place of birth) in Grove
Place of birth for residents in Grove
![Place of birth for the foreign-born population - Regions]()
- 92Americas
- 73Latin America
- 73Central America
- 54Asia
- 35South Central Asia
- 18Northern America
- 14Africa
- 14Eastern Africa
- 12South Eastern Asia
- 6Europe
- 5Eastern Asia
- 5China
- 3Northern Europe

![Place of birth for the foreign-born population - Countries]()
- 73Mexico
- 35Iran
- 18Canada
- 14Zimbabwe
- 12Philippines
- 5China
- 3England

Grandparents responsible for own grandchildren in Grove
Zip codes: 74344.