Races in Greer, South Carolina (SC) Detailed Stats
Data:
Races - White alone (%)
Races - White alone (% change since 2000)
Races - Black alone (%)
Races - Black alone (% change since 2000)
Races - American Indian alone (%)
Races - American Indian alone (% change since 2000)
Races - Asian alone (%)
Races - Asian alone (% change since 2000)
Races - Hispanic (%)
Races - Hispanic (% change since 2000)
Races - Native Hawaiian and Other Pacific Islander alone (%)
Races - Native Hawaiian and Other Pacific Islander alone (% change since 2000)
Races - Two or more races(%)
Races - Two or more races(% change since 2000)
Races - Other race alone (%)
Races - Other race alone (% change since 2000)
Racial diversity
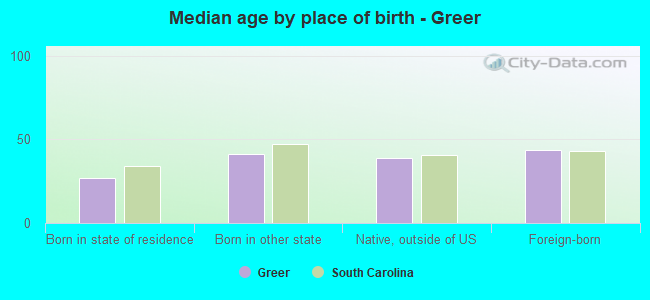
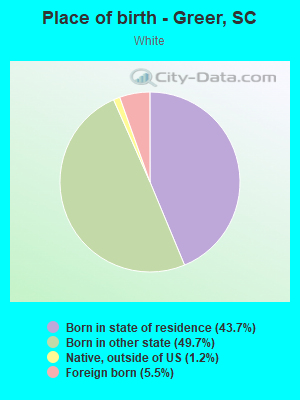
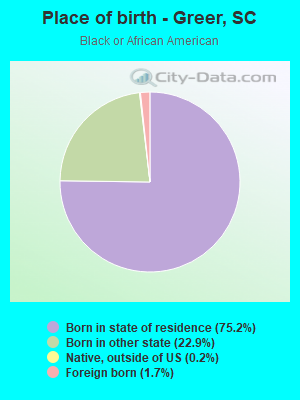
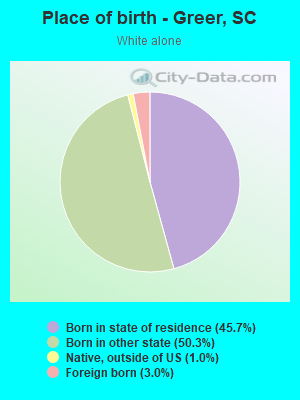
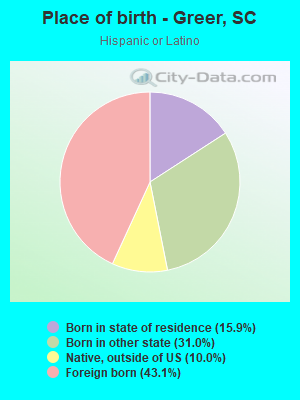
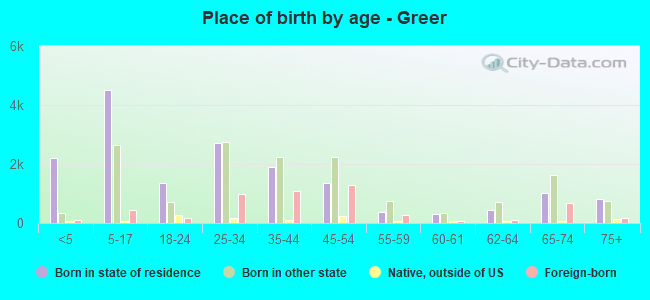
Place of birth - Born in state of residence (%)
Place of birth - Born in state of residence (%) - White
Place of birth - Born in state of residence (%) - Black or African American
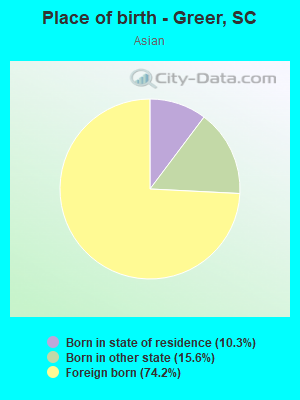
Place of birth - Born in state of residence (%) - Asian
Place of birth - Born in state of residence (%) - Hispanic or Latino
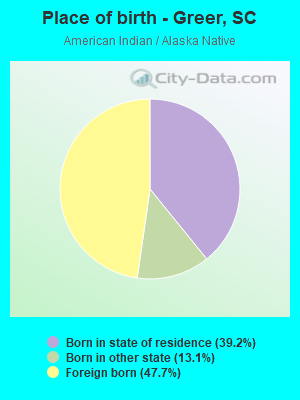
Place of birth - Born in state of residence (%) - American Indian and Alaska Native
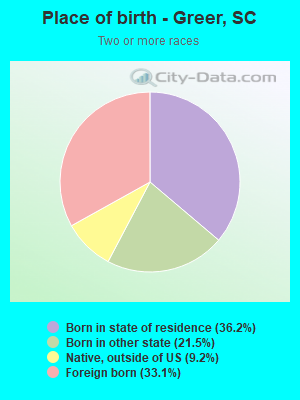
Place of birth - Born in state of residence (%) - Multirace
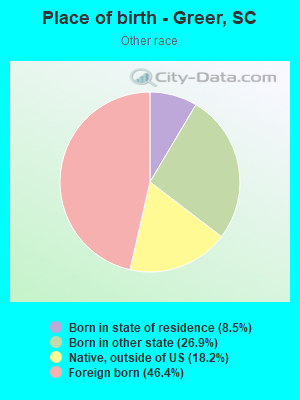
Place of birth - Born in state of residence (%) - Other Race
Place of birth - Born in other state (%)
Place of birth - Born in other state (%) - White
Place of birth - Born in other state (%) - Black or African American
Place of birth - Born in other state (%) - Asian
Place of birth - Born in other state (%) - Hispanic or Latino
Place of birth - Born in other state (%) - American Indian and Alaska Native
Place of birth - Born in other state (%) - Multirace
Place of birth - Born in other state (%) - Other Race
Place of birth - Native, outside of US (%)
Place of birth - Native, outside of US (%) - White
Place of birth - Native, outside of US (%) - Black or African American
Place of birth - Native, outside of US (%) - Asian
Place of birth - Native, outside of US (%) - Hispanic or Latino
Place of birth - Native, outside of US (%) - American Indian and Alaska Native
Place of birth - Native, outside of US (%) - Multirace
Place of birth - Native, outside of US (%) - Other Race
Place of birth - Foreign born (%)
Place of birth - Foreign born (%) - White
Place of birth - Foreign born (%) - Black or African American
Place of birth - Foreign born (%) - Asian
Place of birth - Foreign born (%) - Hispanic or Latino
Place of birth - Foreign born (%) - American Indian and Alaska Native
Place of birth - Foreign born (%) - Multirace
Place of birth - Foreign born (%) - Other Race
Residents speaking English at home (%)
Residents speaking English at home - Born in the United States (%)
Residents speaking English at home - Native, born elsewhere (%)
Residents speaking English at home - Foreign born (%)
Residents speaking Spanish at home (%)
Residents speaking Spanish at home - Born in the United States (%)
Residents speaking Spanish at home - Native, born elsewhere (%)
Residents speaking Spanish at home - Foreign born (%)
Residents speaking other language at home (%)
Residents speaking other language at home - Born in the United States (%)
Residents speaking other language at home - Native, born elsewhere (%)
Residents speaking other language at home - Foreign born (%)
Marital status - Never married (%)
Marital status - Now married (%)
Marital status - Separated (%)
Marital status - Widowed (%)
Marital status - Divorced (%)
Ancestries Reported - Arab (%)
Ancestries Reported - Czech (%)
Ancestries Reported - Danish (%)
Ancestries Reported - Dutch (%)
Ancestries Reported - English (%)
Ancestries Reported - French (%)
Ancestries Reported - French Canadian (%)
Ancestries Reported - German (%)
Ancestries Reported - Greek (%)
Ancestries Reported - Hungarian (%)
Ancestries Reported - Irish (%)
Ancestries Reported - Italian (%)
Ancestries Reported - Lithuanian (%)
Ancestries Reported - Norwegian (%)
Ancestries Reported - Polish (%)
Ancestries Reported - Portuguese (%)
Ancestries Reported - Russian (%)
Ancestries Reported - Scotch-Irish (%)
Ancestries Reported - Scottish (%)
Ancestries Reported - Slovak (%)
Ancestries Reported - Subsaharan African (%)
Ancestries Reported - Swedish (%)
Ancestries Reported - Swiss (%)
Ancestries Reported - Ukrainian (%)
Ancestries Reported - United States (%)
Ancestries Reported - Welsh (%)
Ancestries Reported - West Indian (%)
Ancestries Reported - Other (%)
Geographical mobility - Same house 1 year ago (%)
Geographical mobility - Same house 1 year ago (%) - White
Geographical mobility - Same house 1 year ago (%) - Black or African American
Geographical mobility - Same house 1 year ago (%) - Asian
Geographical mobility - Same house 1 year ago (%) - Hispanic or Latino
Geographical mobility - Same house 1 year ago (%) - American Indian and Alaska Native
Geographical mobility - Same house 1 year ago (%) - Multirace
Geographical mobility - Same house 1 year ago (%) - Other Race
Geographical mobility - Moved within same county (%)
Geographical mobility - Moved within same county (%) - White
Geographical mobility - Moved within same county (%) - Black or African American
Geographical mobility - Moved within same county (%) - Asian
Geographical mobility - Moved within same county (%) - Hispanic or Latino
Geographical mobility - Moved within same county (%) - American Indian and Alaska Native
Geographical mobility - Moved within same county (%) - Multirace
Geographical mobility - Moved within same county (%) - Other Race
Geographical mobility - Moved from different county within same state (%)
Geographical mobility - Moved from different county within same state (%) - White
Geographical mobility - Moved from different county within same state (%) - Black or African American
Geographical mobility - Moved from different county within same state (%) - Asian
Geographical mobility - Moved from different county within same state (%) - Hispanic or Latino
Geographical mobility - Moved from different county within same state (%) - American Indian and Alaska Native
Geographical mobility - Moved from different county within same state (%) - Multirace
Geographical mobility - Moved from different county within same state (%) - Other Race
Geographical mobility - Moved from different state (%)
Geographical mobility - Moved from different state (%) - White
Geographical mobility - Moved from different state (%) - Black or African American
Geographical mobility - Moved from different state (%) - Asian
Geographical mobility - Moved from different state (%) - Hispanic or Latino
Geographical mobility - Moved from different state (%) - American Indian and Alaska Native
Geographical mobility - Moved from different state (%) - Multirace
Geographical mobility - Moved from different state (%) - Other Race
Geographical mobility - Moved from abroad (%)
Geographical mobility - Moved from abroad (%) - White
Geographical mobility - Moved from abroad (%) - Black or African American
Geographical mobility - Moved from abroad (%) - Asian
Geographical mobility - Moved from abroad (%) - Hispanic or Latino
Geographical mobility - Moved from abroad (%) - American Indian and Alaska Native
Geographical mobility - Moved from abroad (%) - Multirace
Geographical mobility - Moved from abroad (%) - Other Race
Place of birth for the foreign-born population - Ireland (%)
Place of birth for the foreign-born population - Denmark (%)
Place of birth for the foreign-born population - Norway (%)
Place of birth for the foreign-born population - Sweden (%)
Place of birth for the foreign-born population - United Kingdom (%)
Place of birth for the foreign-born population - England (%)
Place of birth for the foreign-born population - Scotland (%)
Place of birth for the foreign-born population - Other Northern Europe (%)
Place of birth for the foreign-born population - Austria (%)
Place of birth for the foreign-born population - Belgium (%)
Place of birth for the foreign-born population - France (%)
Place of birth for the foreign-born population - Germany (%)
Place of birth for the foreign-born population - Netherlands (%)
Place of birth for the foreign-born population - Switzerland (%)
Place of birth for the foreign-born population - Other Western Europe (%)
Place of birth for the foreign-born population - Greece (%)
Place of birth for the foreign-born population - Italy (%)
Place of birth for the foreign-born population - Portugal (%)
Place of birth for the foreign-born population - Spain (%)
Place of birth for the foreign-born population - Other Southern Europe (%)
Place of birth for the foreign-born population - Albania (%)
Place of birth for the foreign-born population - Belarus (%)
Place of birth for the foreign-born population - Bosnia and Herzegovina (%)
Place of birth for the foreign-born population - Bulgaria (%)
Place of birth for the foreign-born population - Croatia (%)
Place of birth for the foreign-born population - Czechoslovakia (%)
Place of birth for the foreign-born population - Hungary (%)
Place of birth for the foreign-born population - Latvia (%)
Place of birth for the foreign-born population - Lithuania (%)
Place of birth for the foreign-born population - North Macedonia (Macedonia) (%)
Place of birth for the foreign-born population - Moldova (%)
Place of birth for the foreign-born population - Poland (%)
Place of birth for the foreign-born population - Romania (%)
Place of birth for the foreign-born population - Russia (%)
Place of birth for the foreign-born population - Serbia (%)
Place of birth for the foreign-born population - Ukraine (%)
Place of birth for the foreign-born population - Other Eastern Europe (%)
Place of birth for the foreign-born population - China (%)
Place of birth for the foreign-born population - Hong Kong (%)
Place of birth for the foreign-born population - Taiwan (%)
Place of birth for the foreign-born population - Japan (%)
Place of birth for the foreign-born population - Korea (%)
Place of birth for the foreign-born population - Other Eastern Asia (%)
Place of birth for the foreign-born population - Afghanistan (%)
Place of birth for the foreign-born population - Bangladesh (%)
Place of birth for the foreign-born population - India (%)
Place of birth for the foreign-born population - Iran (%)
Place of birth for the foreign-born population - Kazakhstan (%)
Place of birth for the foreign-born population - Nepal (%)
Place of birth for the foreign-born population - Pakistan (%)
Place of birth for the foreign-born population - Sri Lanka (%)
Place of birth for the foreign-born population - Uzbekistan (%)
Place of birth for the foreign-born population - Other South Central Asia (%)
Place of birth for the foreign-born population - Burma (%)
Place of birth for the foreign-born population - Cambodia (%)
Place of birth for the foreign-born population - Indonesia (%)
Place of birth for the foreign-born population - Laos (%)
Place of birth for the foreign-born population - Malaysia (%)
Place of birth for the foreign-born population - Philippines (%)
Place of birth for the foreign-born population - Singapore (%)
Place of birth for the foreign-born population - Thailand (%)
Place of birth for the foreign-born population - Vietnam (%)
Place of birth for the foreign-born population - Other South Eastern Asia (%)
Place of birth for the foreign-born population - Armenia (%)
Place of birth for the foreign-born population - Iraq (%)
Place of birth for the foreign-born population - Israel (%)
Place of birth for the foreign-born population - Jordan (%)
Place of birth for the foreign-born population - Kuwait (%)
Place of birth for the foreign-born population - Lebanon (%)
Place of birth for the foreign-born population - Saudi Arabia (%)
Place of birth for the foreign-born population - Syria (%)
Place of birth for the foreign-born population - Turkey (%)
Place of birth for the foreign-born population - Yemen (%)
Place of birth for the foreign-born population - Other Western Asia (%)
Place of birth for the foreign-born population - Eritrea (%)
Place of birth for the foreign-born population - Ethiopia (%)
Place of birth for the foreign-born population - Kenya (%)
Place of birth for the foreign-born population - Somalia (%)
Place of birth for the foreign-born population - Uganda (%)
Place of birth for the foreign-born population - Zimbabwe (%)
Place of birth for the foreign-born population - Other Eastern Africa (%)
Place of birth for the foreign-born population - Cameroon (%)
Place of birth for the foreign-born population - Congo (%)
Place of birth for the foreign-born population - Democratic Republic of Congo (Zaire) (%)
Place of birth for the foreign-born population - Other Middle Africa (%)
Place of birth for the foreign-born population - Egypt (%)
Place of birth for the foreign-born population - Morocco (%)
Place of birth for the foreign-born population - Sudan (%)
Place of birth for the foreign-born population - Other Northern Africa (%)
Place of birth for the foreign-born population - South Africa (%)
Place of birth for the foreign-born population - Other Southern Africa (%)
Place of birth for the foreign-born population - Cabo Verde (%)
Place of birth for the foreign-born population - Ghana (%)
Place of birth for the foreign-born population - Liberia (%)
Place of birth for the foreign-born population - Nigeria (%)
Place of birth for the foreign-born population - Senegal (%)
Place of birth for the foreign-born population - Sierra Leone (%)
Place of birth for the foreign-born population - Other Western Africa (%)
Place of birth for the foreign-born population - Australia (%)
Place of birth for the foreign-born population - New Zealand (%)
Place of birth for the foreign-born population - Fiji (%)
Place of birth for the foreign-born population - Micronesia (%)
Place of birth for the foreign-born population - Bahamas (%)
Place of birth for the foreign-born population - Barbados (%)
Place of birth for the foreign-born population - Cuba (%)
Place of birth for the foreign-born population - Dominica (%)
Place of birth for the foreign-born population - Dominican Republic (%)
Place of birth for the foreign-born population - Grenada (%)
Place of birth for the foreign-born population - Haiti (%)
Place of birth for the foreign-born population - Jamaica (%)
Place of birth for the foreign-born population - St. Vincent and the Grenadines (%)
Place of birth for the foreign-born population - Trinidad and Tobago (%)
Place of birth for the foreign-born population - West Indies (%)
Place of birth for the foreign-born population - Other Caribbean (%)
Place of birth for the foreign-born population - Belize (%)
Place of birth for the foreign-born population - Costa Rica (%)
Place of birth for the foreign-born population - El Salvador (%)
Place of birth for the foreign-born population - Guatemala (%)
Place of birth for the foreign-born population - Honduras (%)
Place of birth for the foreign-born population - Mexico (%)
Place of birth for the foreign-born population - Nicaragua (%)
Place of birth for the foreign-born population - Panama (%)
Place of birth for the foreign-born population - Other Central America (%)
Place of birth for the foreign-born population - Argentina (%)
Place of birth for the foreign-born population - Bolivia (%)
Place of birth for the foreign-born population - Brazil (%)
Place of birth for the foreign-born population - Chile (%)
Place of birth for the foreign-born population - Colombia (%)
Place of birth for the foreign-born population - Ecuador (%)
Place of birth for the foreign-born population - Guyana (%)
Place of birth for the foreign-born population - Peru (%)
Place of birth for the foreign-born population - Uruguay (%)
Place of birth for the foreign-born population - Venezuela (%)
Place of birth for the foreign-born population - Other South America (%)
Place of birth for the foreign-born population - Canada (%)
Place of birth for the foreign-born population - Other Northern America (%)
Place of birth for the foreign-born population - Other (%)
Latest news about races in Greer, SC collected exclusively by city-data.com from local newspapers, TV, and radio stations
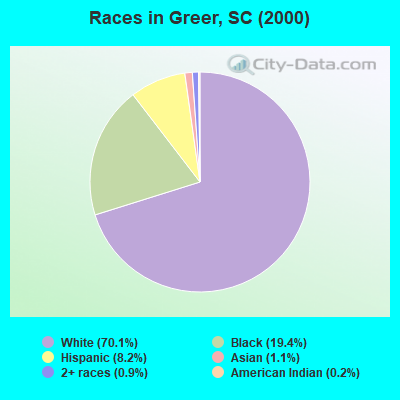
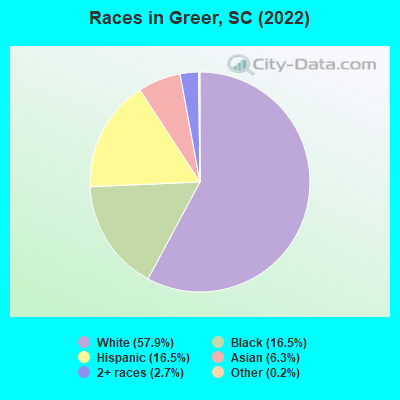
According to 2022 data, the most numerous races in Greer, SC are White alone (22,216 residents), Black alone (6,345 residents), and Hispanic (6,321 residents). 80.4% of Greer residents speak English at home. 14.8% of Greer, SC residents are foreign-born (8.3% born in Latin America, 5.3% born in Asia), which is 66.3% greater than the foreign-born rate of 5.0% across the entire state of South Carolina.
Race distribution in Greer
2000 2022
2,652,291 66.1% White alone 1,178,486 29.4% Black alone 95,076 2.4% Hispanic 35,568 0.9% Asian alone 33,290 0.8% Two or more races 12,765 0.3% American Indian alone 3,266 0.08% Other race alone 1,270 0.03% Native Hawaiian and Other
3,301,739 62.5% White alone 1,313,290 24.9% Black alone 343,783 6.5% Hispanic 190,508 3.6% Two or more races 89,888 1.7% Asian alone 29,390 0.6% Other race alone 12,112 0.2% American Indian alone 1,924 0.04% Native Hawaiian and Other
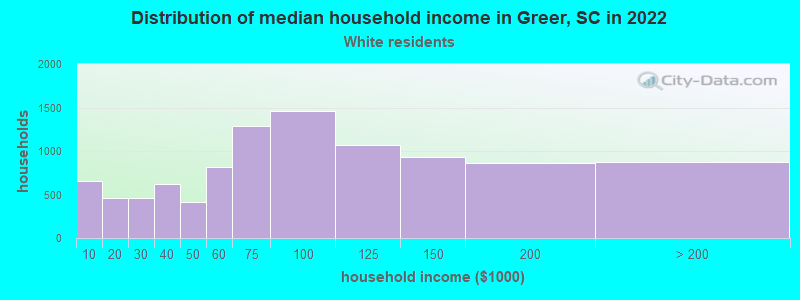
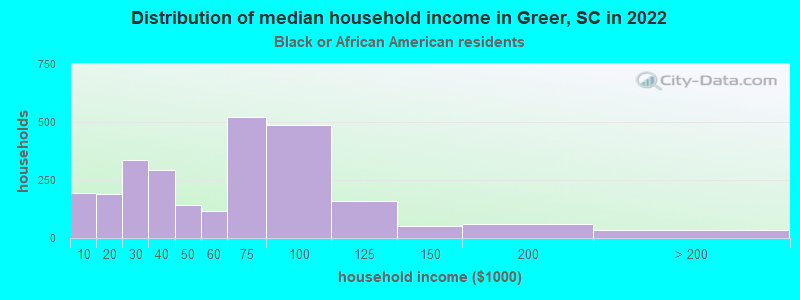
Income and house value in Greer Median household income in 2022 $79,940 White non-Hispanic householders$57,585 Black householders$73,049 American Indian and Alaska Native householders$93,986 Asian householders$84,571 Some other race householders$72,250 Two or more races householders$78,056 Hispanic or Latino race householdersMedian 2022 house value $301,879 White Non-Hispanic householders$188,149 Black or African American householders$337,589 American Indian or Alaska Native householders $322,284 Asian householders$141,937 Some other race householders$477,425 Two or more races householders$289,576 Hispanic or Latino householders
Median age by race in Greer
36.5 Median age for White residents34.2 39.4 32.1 Median age for Black or African American residents28.5 35.0 19.8 Median age for American Indian / Alaska Native residents38.7 10.7 49.2 Median age for Asian residents47.8 52.1 -698,412,697.7 Median age for Native Hawaiian / Pacific Islander residents-551,574,375.1 -1,016,109,044.8 30.6 Median age for Other race residents34.0 28.6 28.0 Median age for Two or more races residents23.1 39.2 38.1 Median age for White alone residents34.3 40.3 29.8 Median age for Hispanic or Latino residents31.0 28.8
Owner/renter occupied households by race in Greer
House owners and renters - White residents 7,707 78.1% Owner occupied2,166 21.9% Renter occupiedHouse owners and renters - Black or African American residents 1,333 51.3% Owner occupied1,267 48.7% Renter occupiedHouse owners and renters - American Indian / Alaska Native residents 30 31.0% Owner occupied68 69.0% Renter occupiedHouse owners and renters - Asian residents 920 94.7% Owner occupied51 5.3% Renter occupiedHouse owners and renters - Other race residents 201 34.0% Owner occupied390 66.0% Renter occupiedHouse owners and renters - Two or more races residents 867 75.4% Owner occupied282 24.6% Renter occupiedHouse owners and renters - White alone residents 7,434 79.8% Owner occupied1,882 20.2% Renter occupiedHouse owners and renters - Hispanic or Latino residents 1,092 52.9% Owner occupied970 47.1% Renter occupied
Language usage in Greer
English speakers - Total 80.4% of residents of Greer speak English at home.
13.1% of residents speak Spanish at home 2,870 61.5% Speak English very well1,799 38.5% Speak English less than very well6.1% of residents speak other language at home 1,635 75.2% Speak English very well540 24.8% Speak English less than very well
English speakers - Born in the United States 91.5% of residents of Greer speak English at home.
7.6% of residents speak Spanish at home 821 73.7% Speak English very well293 26.3% Speak English less than very well1.6% of residents speak other language at home 229 100.0% Speak English very well
English speakers - Native, born elsewhere 39.2% of residents of Greer speak English at home.
67.1% of residents speak Spanish at home 461 83.5% Speak English very well91 16.5% Speak English less than very well
English speakers - Foreign-born 12.8% of residents of Greer speak English at home.
48.4% of residents speak Spanish at home 1,241 49.2% Speak English very well1,280 50.8% Speak English less than very well39.6% of residents speak other language at home 1,515 73.3% Speak English very well551 26.7% Speak English less than very well
White (Caucasian) - Speak only English Native:
96.0% (20,041)Foreign-born:
25.9% (331)
White (Caucasian) - Speak another language Native:
3.6% (742)Foreign-born:
66.7% (852)
Black or African American - Speak only English Native:
96.3% (5,649)Foreign-born:
25.6% (28)
Black or African American - Speak another language Native:
3.7% (220)Foreign-born:
38.9% (42)
American Indian / Alaska Native - Speak another language Native:
56.1% (49)Foreign-born:
100.0% (307)
Asian - Speak only English Native:
80.8% (399)Foreign-born:
8.4% (142)
Asian - Speak another language Native:
26.9% (133)Foreign-born:
91.5% (1,551)
Other race - Speak only English Native:
52.8% (361)Foreign-born:
9.6% (70)
Other race - Speak another language Native:
48.8% (334)Foreign-born:
89.7% (653)
Two or more races - Speak only English Native:
71.4% (1,765)Foreign-born:
5.8% (71)
Two or more races - Speak another language Native:
28.8% (711)Foreign-born:
93.9% (1,153)
White alone - Speak only English Native:
97.8% (19,549)Foreign-born:
49.1% (322)
White alone - Speak another language Native:
2.2% (438)Foreign-born:
51.1% (336)
Hispanic or Latino - Speak only English Native:
55.0% (1,714)Foreign-born:
5.6% (145)
Hispanic or Latino - Speak another language Native:
46.1% (1,437)Foreign-born:
93.6% (2,450)
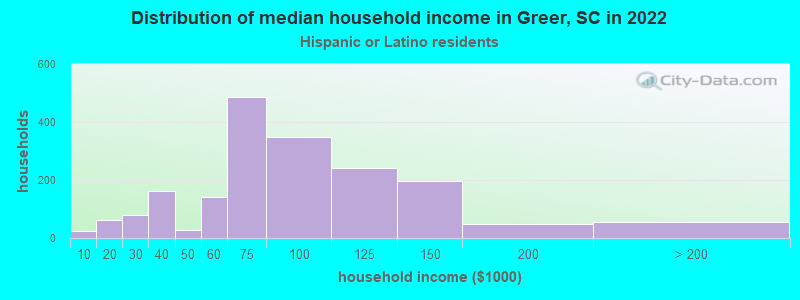
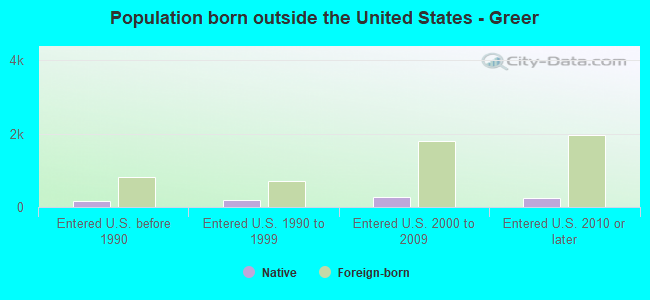
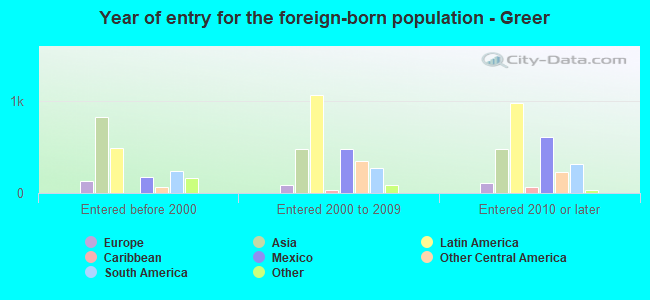
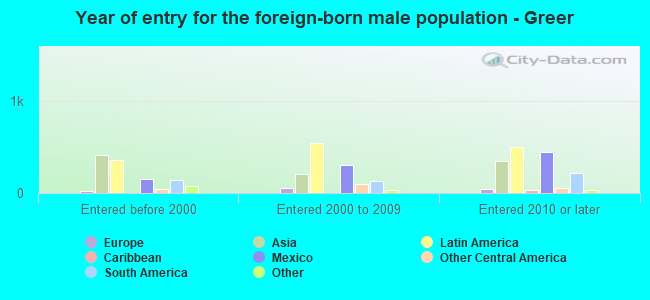
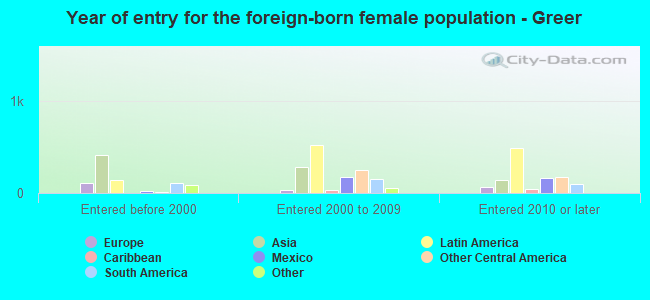
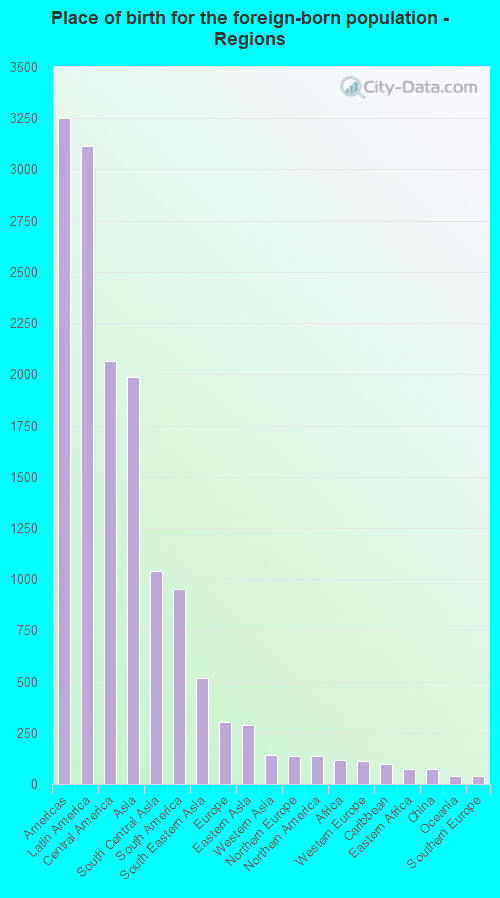
Foreign-born residents in Greer 5,699 residents are foreign born (8.3% Latin America , 5.3% Asia ).
This city:
14.8%South Carolina:
5.3%
Marital status for residents in Greer Marital status - White (Caucasian) population 15 years and over
Males 30.7% Never married54.1% Now married3.2% Separated1.4% Widowed10.6% DivorcedFemales 23.2% Never married50.1% Now married3.2% Separated8.8% Widowed14.8% DivorcedWomen who gave birth in the past 12 months Now married:
80.0% (252)Unmarried:
20.0% (63)
Women who did not give birth in the past 12 months Now married:
54.6% (2,825)Unmarried:
45.4% (2,350)
Marital status - Black or African American population 15 years and over
Males 42.1% Never married42.9% Now married2.2% Separated2.6% Widowed10.2% DivorcedFemales 42.5% Never married30.7% Now married3.8% Separated5.6% Widowed17.4% DivorcedWomen who gave birth in the past 12 months Now married:
98.6% (71)Unmarried:
1.4% (1)
Women who did not give birth in the past 12 months Now married:
34.7% (632)Unmarried:
65.3% (1,190)
Marital status - American Indian / Alaska Native population 15 years and over
Males 25.0% Never married68.9% Now married0.0% Separated0.0% Widowed6.1% DivorcedFemales 29.0% Never married71.0% Now married0.0% Separated0.0% Widowed0.0% DivorcedWomen who did not give birth in the past 12 months Now married:
66.7% (55)Unmarried:
33.3% (27)
Marital status - Asian population 15 years and over
Males 12.8% Never married82.2% Now married0.0% Separated0.0% Widowed5.0% DivorcedFemales 13.1% Never married79.6% Now married0.0% Separated4.0% Widowed3.3% DivorcedWomen who gave birth in the past 12 months Now married:
100.0% (22)Unmarried:
0.0% (0)
Women who did not give birth in the past 12 months Now married:
70.1% (367)Unmarried:
29.9% (156)
Marital status - Other race population 15 years and over
Males 33.1% Never married54.4% Now married1.9% Separated1.0% Widowed9.6% DivorcedFemales 33.7% Never married55.2% Now married0.0% Separated0.0% Widowed11.1% DivorcedWomen who gave birth in the past 12 months Now married:
10.7% (11)Unmarried:
89.3% (90)
Women who did not give birth in the past 12 months Now married:
51.8% (170)Unmarried:
48.2% (158)
Marital status - Two or more races population 15 years and over
Males 62.1% Never married33.4% Now married0.0% Separated0.0% Widowed4.5% DivorcedFemales 29.4% Never married42.5% Now married0.2% Separated3.1% Widowed24.8% DivorcedWomen who gave birth in the past 12 months Now married:
72.7% (53)Unmarried:
27.3% (20)
Women who did not give birth in the past 12 months Now married:
28.0% (171)Unmarried:
72.0% (439)
Marital status - White alone, not Hispanic / Latino population 15 years and over
Males 29.6% Never married54.6% Now married3.2% Separated1.5% Widowed11.0% DivorcedFemales 23.1% Never married49.1% Now married2.9% Separated9.0% Widowed15.9% DivorcedWomen who gave birth in the past 12 months Now married:
79.7% (188)Unmarried:
20.3% (48)
Women who did not give birth in the past 12 months Now married:
53.7% (2,571)Unmarried:
46.3% (2,215)
Marital status - Hispanic or Latino population 15 years and over
Males 45.3% Never married48.0% Now married1.3% Separated0.0% Widowed5.4% DivorcedFemales 27.5% Never married58.1% Now married2.7% Separated2.8% Widowed8.9% DivorcedWomen who gave birth in the past 12 months Now married:
49.2% (106)Unmarried:
50.8% (109)
Women who did not give birth in the past 12 months Now married:
52.8% (667)Unmarried:
47.2% (596)
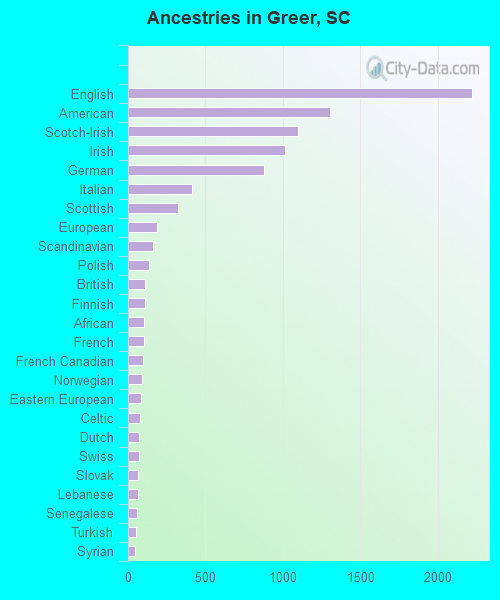
Ancestries in Greer
2,221 10.9% English1,303 6.4% American1,098 5.4% Scotch-Irish1,012 5.0% Irish880 4.3% German413 2.0% Italian322 1.6% Scottish187 0.9% European160 0.8% Scandinavian133 0.7% Polish112 0.5% British111 0.5% Finnish102 0.5% African101 0.5% French99 0.5% French Canadian90 0.4% Norwegian87 0.4% Eastern European76 0.4% Celtic73 0.4% Dutch68 0.3% Swiss63 0.3% Slovak62 0.3% Lebanese55 0.3% Senegalese50 0.2% Turkish47 0.2% Syrian45 0.2% Moroccan40 0.2% Canadian34 0.2% Northern European34 0.2% British West Indian31 0.2% Brazilian30 0.1% Welsh29 0.1% Trinidadian and Tobagonian27 0.1% Haitian26 0.1% Greek26 0.1% Russian22 0.1% Ethiopian17 0.08% Hungarian16 0.08% Belgian16 0.08% Slovene12 0.06% Pennsylvania German5 0.02% Barbadian
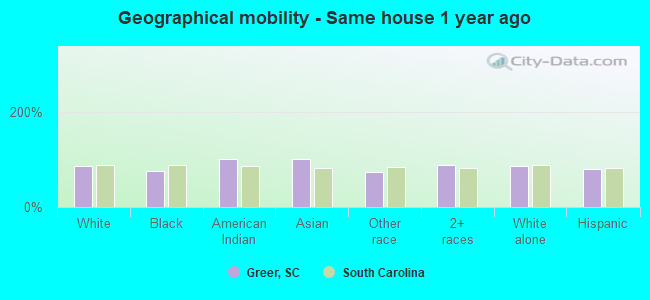
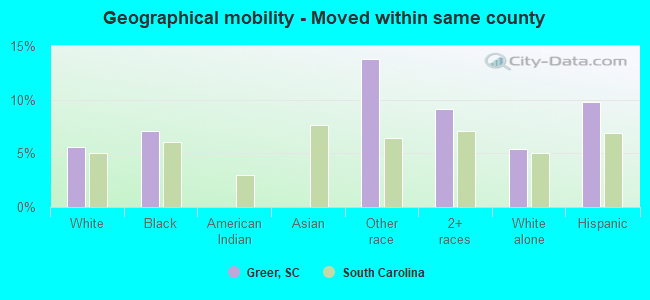
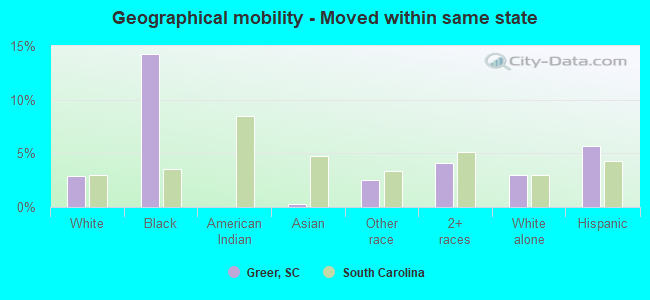
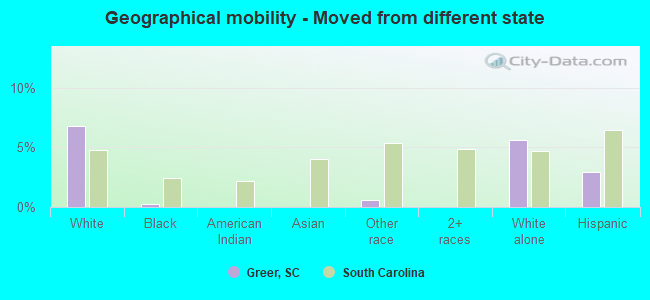
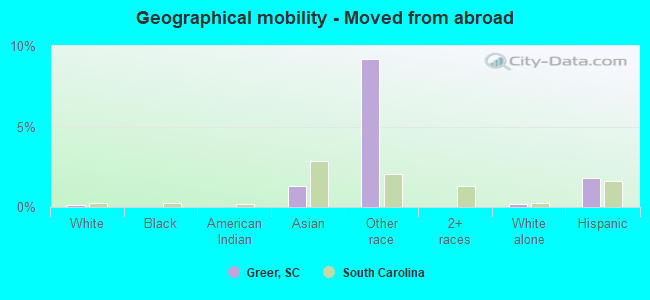
Geographical mobility in Greer Same house 1 year ago 20,167 84.9% White (Caucasian)4,707 75.1% Black or African American366 100.0% American Indian / Alaska Native2,392 100.0% Asian1,125 74.4% Other race3,397 88.4% Two or more races18,788 85.8% White alone, not Hispanic / Latino4,914 79.7% Hispanic or LatinoMoved within same county 1,325 5.6% White / Caucasian445 7.1% Black or African American208 13.8% Other race352 9.2% Two or more races1,190 5.4% White alone, not Hispanic / Latino605 9.8% Hispanic or LatinoMoved within same state 691 2.9% White / Caucasian892 14.2% Black or African American8 0.3% Asian37 2.5% Other race159 4.1% Two or more races650 3.0% White alone, not Hispanic / Latino348 5.6% Hispanic or LatinoMoved from different state 1,618 6.8% White / Caucasian18 0.3% Black or African American9 0.6% Other race1,237 5.6% White alone, not Hispanic / Latino182 3.0% Hispanic or LatinoMoved from abroad 35 0.1% White32 1.3% Asian139 9.2% Other race38 0.2% White alone, not Hispanic / Latino113 1.8% Hispanic or Latino
Children Nativity (place of birth) in Greer
Children under 6 years - Living with two parents Both parents native 1,640 100.0% NativeBoth parents foreign-born 297 83.3% Native59 16.7% Foreign-bornOne native, one foreign-born parent 544 100.0% NativeChildren under 6 years - Living with one parent Native parent 480 100.0% NativeForeign-born parent 113 75.6% Native37 24.4% Foreign-bornChildren 6 to 17 years - Living with two parents Both parents native 3,671 99.1% Native33 0.9% Foreign-bornBoth parents foreign-born 620 70.5% Native259 29.5% Foreign-bornOne native, one foreign-born parent 356 90.6% Native37 9.4% Foreign-bornChildren 6 to 17 years - Living with one parent Native parent 1,406 100.0% NativeForeign-born parent 212 58.7% Native149 41.3% Foreign-born
Grandparents responsible for own grandchildren in Greer
Grandparents (30 to 59 years) White / Caucasian 35 73.4% Responsible for grandchildren13 26.6% Not responsible for grandchildrenBlack or African American 11 100.0% Not responsible for grandchildrenOther race 4 100.0% Not responsible for grandchildrenTwo or more races 20 32.3% Responsible for grandchildren42 67.7% Not responsible for grandchildrenWhite alone, not Hispanic / Latino 35 71.2% Responsible for grandchildren14 28.8% Not responsible for grandchildrenHispanic or Latino 45 100.0% Not responsible for grandchildrenGrandparents (60 years and over) White / Caucasian 22 7.2% Responsible for grandchildren285 92.8% Not responsible for grandchildrenOther race 1 79.1% Not responsible for grandchildrenTwo or more races 27 100.0% Not responsible for grandchildrenWhite alone, not Hispanic / Latino 23 8.0% Responsible for grandchildren263 92.0% Not responsible for grandchildrenHispanic or Latino 26 100.0% Not responsible for grandchildren