Races in Greenfield, Massachusetts (MA) Detailed Stats
Latest news about races in Greenfield, MA collected exclusively by city-data.com from local newspapers, TV, and radio stations
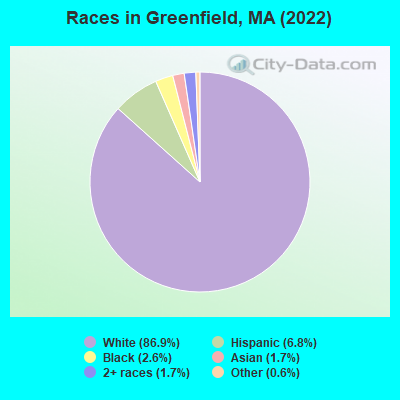
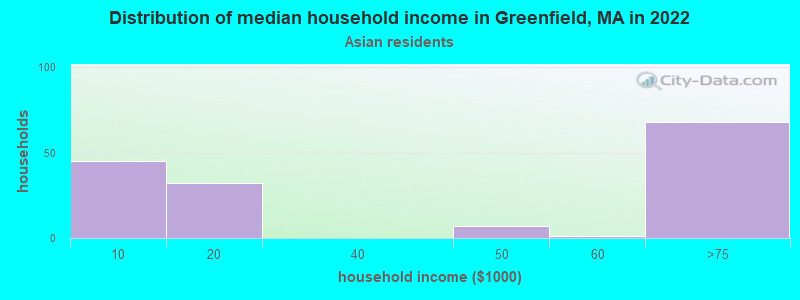
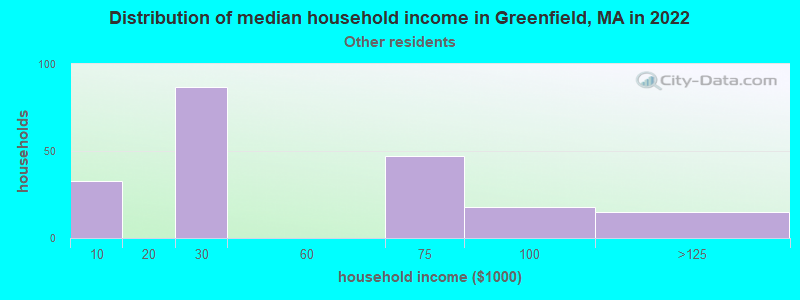
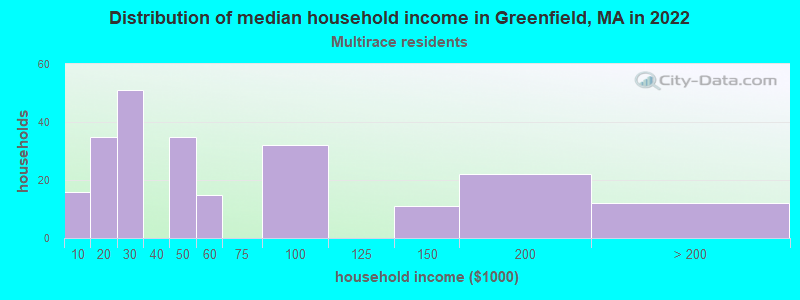
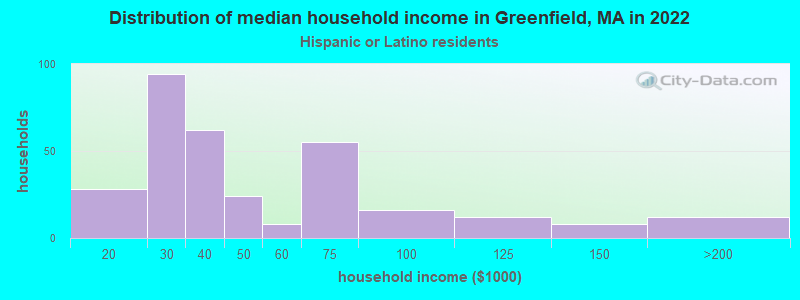
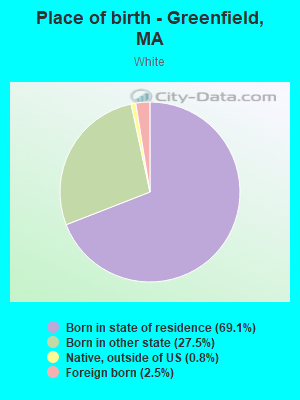
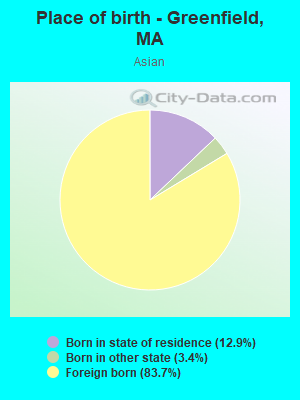
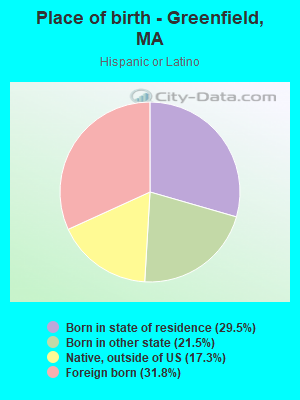
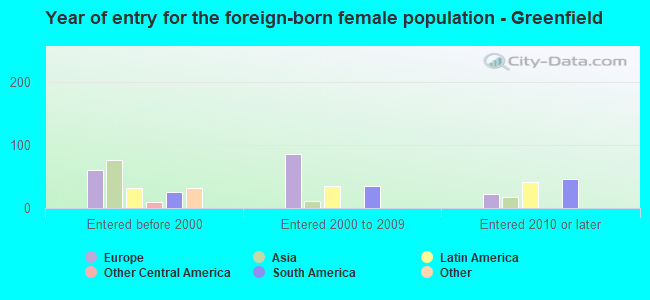
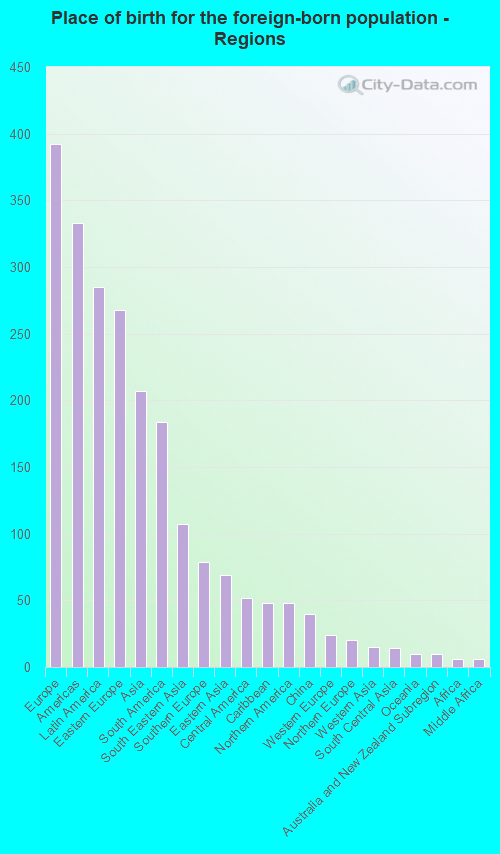
According to 2022 data, the most numerous races in Greenfield, MA are White alone (15,343 residents), Hispanic (1,192 residents), and Asian alone (308 residents). 90.5% of Greenfield residents speak English at home. 5.4% of Greenfield, MA residents are foreign-born (2.2% born in Europe, 1.6% born in Latin America, 1.1% born in Asia), which is 234.5% less than the foreign-born rate of 18.0% across the entire state of Massachusetts.
Race distribution in Greenfield
2000 2022
5,198,359 81.9% White alone 428,729 6.8% Hispanic 318,329 5.0% Black alone 236,786 3.7% Asian alone 110,338 1.7% Two or more races 43,586 0.7% Other race alone 11,264 0.2% American Indian alone 1,706 0.03% Native Hawaiian and Other
4,676,627 67.0% White alone 911,038 13.0% Hispanic 501,463 7.2% Asian alone 459,740 6.6% Black alone 341,889 4.9% Two or more races 84,403 1.2% Other race alone 5,838 0.08% American Indian alone 976 0.01% Native Hawaiian and Other
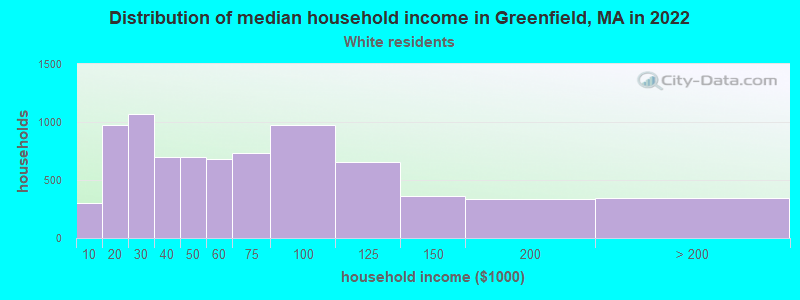
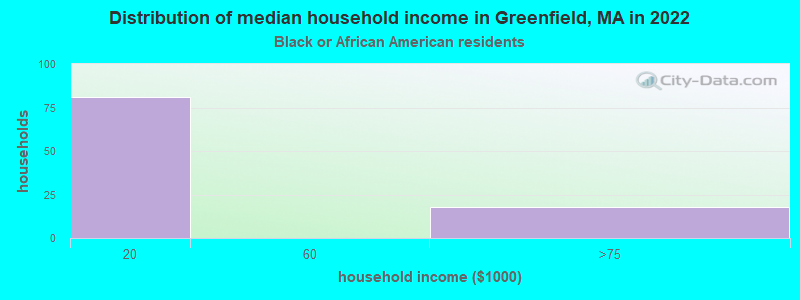
Income and house value in Greenfield Median household income in 2022 $56,100 White non-Hispanic householders$17,444 Black householders$36,223 Two or more races householders$33,015 Hispanic or Latino race householdersMedian 2022 house value $250,551 White Non-Hispanic householders$226,088 Black or African American householders $218,878 Asian householders$170,982 Two or more races householders$154,502 Hispanic or Latino householders
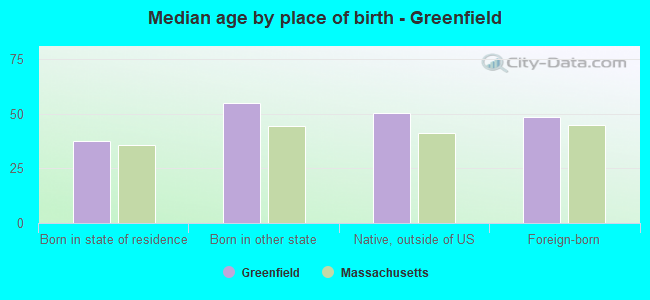
Median age by race in Greenfield
46.6 Median age for White residents43.0 50.1 28.4 Median age for Black or African American residents29.0 28.2 -655,238,094.6 Median age for American Indian / Alaska Native residents-649,474,688.9 -657,223,795.4 51.5 Median age for Asian residents57.2 50.2 -666,666,666.0 Median age for Native Hawaiian / Pacific Islander residents-666,666,666.0 -666,666,666.0 39.2 Median age for Other race residents26.4 65.2 32.2 Median age for Two or more races residents34.1 43.7 46.9 Median age for White alone residents43.3 51.5 37.4 Median age for Hispanic or Latino residents40.1 27.5
Owner/renter occupied households by race in Greenfield
House owners and renters - White residents 4,660 60.5% Owner occupied3,041 39.5% Renter occupiedHouse owners and renters - Black or African American residents 1 1.0% Owner occupied100 99.0% Renter occupiedHouse owners and renters - American Indian / Alaska Native residents 12 49.4% Owner occupied12 50.6% Renter occupiedHouse owners and renters - Asian residents 26 18.1% Owner occupied118 81.9% Renter occupiedHouse owners and renters - Other race residents 18 9.2% Owner occupied179 90.8% Renter occupiedHouse owners and renters - Two or more races residents 54 39.1% Owner occupied84 60.9% Renter occupiedHouse owners and renters - White alone residents 4,663 61.2% Owner occupied2,959 38.8% Renter occupiedHouse owners and renters - Hispanic or Latino residents 29 12.4% Owner occupied202 87.6% Renter occupied
Language usage in Greenfield
English speakers - Total 90.5% of residents of Greenfield speak English at home.
5.9% of residents speak Spanish at home 709 70.3% Speak English very well299 29.7% Speak English less than very well3.7% of residents speak other language at home 273 43.7% Speak English very well352 56.3% Speak English less than very well
English speakers - Born in the United States 96.0% of residents of Greenfield speak English at home.
2.7% of residents speak Spanish at home 122 95.3% Speak English very well6 4.7% Speak English less than very well1.4% of residents speak other language at home 14 20.6% Speak English very well54 79.4% Speak English less than very well
English speakers - Native, born elsewhere 29.1% of residents of Greenfield speak English at home.
48.4% of residents speak Spanish at home 69 45.1% Speak English very well84 54.9% Speak English less than very well
English speakers - Foreign-born 23.8% of residents of Greenfield speak English at home.
31.4% of residents speak Spanish at home 209 62.8% Speak English very well124 37.2% Speak English less than very well41.5% of residents speak other language at home 175 39.7% Speak English very well266 60.3% Speak English less than very well
White (Caucasian) - Speak only English Native:
97.8% (14,310)Foreign-born:
24.3% (95)
White (Caucasian) - Speak another language Native:
2.1% (313)Foreign-born:
72.8% (284)
Black or African American - Speak only English Native:
91.1% (353)Foreign-born:
100.0% (6)
Asian - Speak only English Native:
2.3% (1)Foreign-born:
25.2% (64)
Asian - Speak another language Native:
100.0% (35)Foreign-born:
74.3% (189)
Other race - Speak only English Native:
38.2% (200)Foreign-born:
11.8% (17)
Other race - Speak another language Native:
62.1% (325)Foreign-born:
88.7% (125)
Two or more races - Speak only English Native:
78.6% (335)Foreign-born:
6.9% (17)
Two or more races - Speak another language Native:
5.2% (22)Foreign-born:
97.0% (235)
White alone - Speak only English Native:
98.7% (14,179)Foreign-born:
24.5% (95)
White alone - Speak another language Native:
1.1% (163)Foreign-born:
72.2% (279)
Hispanic or Latino - Speak only English Native:
28.0% (221)Foreign-born:
12.7% (46)
Hispanic or Latino - Speak another language Native:
80.9% (639)Foreign-born:
88.1% (318)
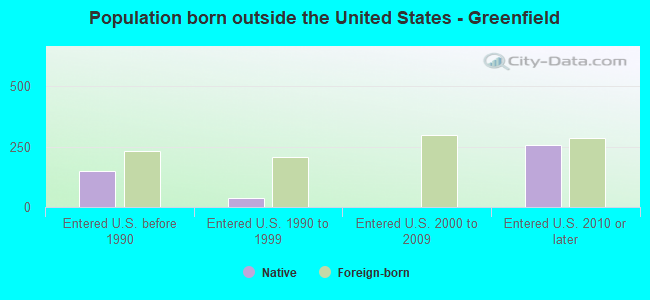
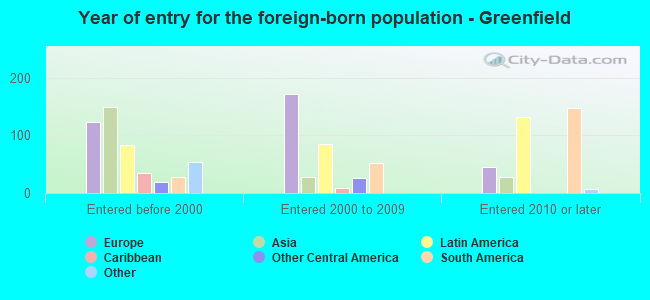
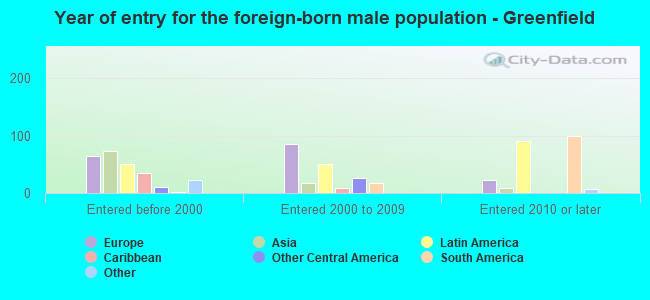
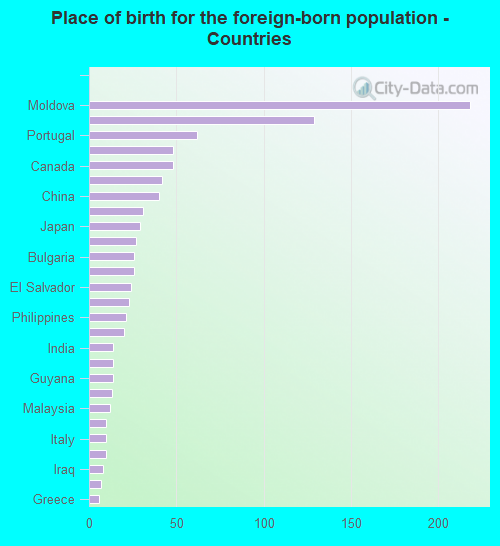
Foreign-born residents in Greenfield 950 residents are foreign born (2.2% Europe , 1.6% Latin America , 1.1% Asia ).
This city:
5.4%Massachusetts:
17.6%
Marital status for residents in Greenfield Marital status - White (Caucasian) population 15 years and over
Males 34.5% Never married42.2% Now married0.8% Separated4.8% Widowed17.7% DivorcedFemales 30.1% Never married38.0% Now married3.4% Separated11.1% Widowed17.4% DivorcedWomen who gave birth in the past 12 months Now married:
61.7% (170)Unmarried:
38.3% (106)
Women who did not give birth in the past 12 months Now married:
35.3% (985)Unmarried:
64.7% (1,806)
Marital status - Black or African American population 15 years and over
Males 54.0% Never married42.8% Now married0.5% Separated0.0% Widowed2.7% DivorcedFemales 21.6% Never married64.8% Now married0.0% Separated10.4% Widowed3.2% DivorcedWomen who did not give birth in the past 12 months Now married:
0.0% (0)Unmarried:
100.0% (27)
Marital status - American Indian / Alaska Native population 15 years and over
Males 0.0% Never married0.0% Now married0.0% Separated100.0% Widowed0.0% DivorcedFemales 0.0% Never married0.0% Now married0.0% Separated0.0% Widowed100.0% DivorcedMarital status - Asian population 15 years and over
Males 15.1% Never married53.8% Now married0.0% Separated0.0% Widowed31.2% DivorcedFemales 34.0% Never married39.6% Now married0.0% Separated26.4% Widowed0.0% DivorcedWomen who did not give birth in the past 12 months Now married:
50.0% (46)Unmarried:
50.0% (46)
Marital status - Other race population 15 years and over
Males 54.8% Never married38.3% Now married0.0% Separated0.0% Widowed6.9% DivorcedFemales 45.0% Never married24.8% Now married0.0% Separated0.0% Widowed30.2% DivorcedWomen who gave birth in the past 12 months Now married:
0.0% (0)Unmarried:
100.0% (1)
Women who did not give birth in the past 12 months Now married:
27.2% (45)Unmarried:
72.8% (120)
Marital status - Two or more races population 15 years and over
Males 50.9% Never married40.3% Now married0.5% Separated0.0% Widowed8.3% DivorcedFemales 47.7% Never married32.6% Now married0.0% Separated0.0% Widowed19.8% DivorcedWomen who gave birth in the past 12 months Now married:
100.0% (7)Unmarried:
0.0% (0)
Women who did not give birth in the past 12 months Now married:
39.1% (59)Unmarried:
60.9% (92)
Marital status - White alone, not Hispanic / Latino population 15 years and over
Males 33.9% Never married42.8% Now married0.8% Separated4.9% Widowed17.6% DivorcedFemales 29.8% Never married38.4% Now married3.5% Separated11.2% Widowed17.2% DivorcedWomen who gave birth in the past 12 months Now married:
61.7% (171)Unmarried:
38.3% (106)
Women who did not give birth in the past 12 months Now married:
36.4% (987)Unmarried:
63.6% (1,723)
Marital status - Hispanic or Latino population 15 years and over
Males 52.9% Never married37.5% Now married0.0% Separated0.0% Widowed9.7% DivorcedFemales 44.3% Never married37.5% Now married0.0% Separated1.1% Widowed17.0% DivorcedWomen who gave birth in the past 12 months Now married:
83.3% (5)Unmarried:
16.7% (1)
Women who did not give birth in the past 12 months Now married:
29.2% (80)Unmarried:
70.8% (194)
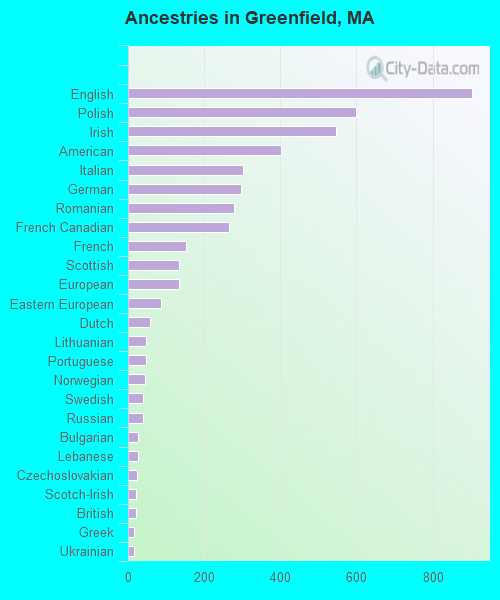
Ancestries in Greenfield
903 14.8% English598 9.8% Polish547 9.0% Irish402 6.6% American302 4.9% Italian298 4.9% German278 4.6% Romanian266 4.4% French Canadian152 2.5% French135 2.2% Scottish134 2.2% European87 1.4% Eastern European57 0.9% Dutch47 0.8% Lithuanian47 0.8% Portuguese44 0.7% Norwegian40 0.7% Swedish39 0.6% Russian26 0.4% Bulgarian25 0.4% Lebanese23 0.4% Czechoslovakian22 0.4% Scotch-Irish20 0.3% British17 0.3% Greek15 0.2% Ukrainian12 0.2% Iraqi12 0.2% Danish10 0.2% Swiss9 0.1% Australian6 0.10% Scandinavian3 0.05% Celtic3 0.05% Czech
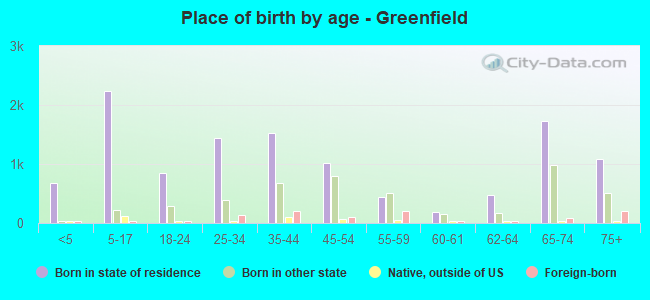
Children Nativity (place of birth) in Greenfield
Children under 6 years - Living with two parents Both parents native 481 100.0% NativeBoth parents foreign-born 16 100.0% NativeOne native, one foreign-born parent 84 100.0% NativeChildren under 6 years - Living with one parent Native parent 301 100.0% NativeForeign-born parent 3 100.0% NativeChildren 6 to 17 years - Living with two parents Both parents native 853 99.9% Native0 0.1% Foreign-bornBoth parents foreign-born 31 91.8% Native3 8.2% Foreign-bornOne native, one foreign-born parent 88 96.7% Native3 3.3% Foreign-bornChildren 6 to 17 years - Living with one parent Native parent 1,026 100.0% NativeForeign-born parent 1 50.5% Native1 49.5% Foreign-born
Grandparents responsible for own grandchildren in Greenfield
Grandparents (30 to 59 years) White / Caucasian 19 76.7% Responsible for grandchildren6 23.3% Not responsible for grandchildrenWhite alone, not Hispanic / Latino 21 78.8% Responsible for grandchildren6 21.2% Not responsible for grandchildren
Grandparents (60 years and over) White / Caucasian 4 2.9% Responsible for grandchildren147 97.1% Not responsible for grandchildrenWhite alone, not Hispanic / Latino 4 2.9% Responsible for grandchildren147 97.1% Not responsible for grandchildren