Races in Greenbriar, Virginia (VA) Detailed Stats
Data:
Races - White alone (%)
Races - White alone (% change since 2000)
Races - Black alone (%)
Races - Black alone (% change since 2000)
Races - American Indian alone (%)
Races - American Indian alone (% change since 2000)
Races - Asian alone (%)
Races - Asian alone (% change since 2000)
Races - Hispanic (%)
Races - Hispanic (% change since 2000)
Races - Native Hawaiian and Other Pacific Islander alone (%)
Races - Native Hawaiian and Other Pacific Islander alone (% change since 2000)
Races - Two or more races(%)
Races - Two or more races(% change since 2000)
Races - Other race alone (%)
Races - Other race alone (% change since 2000)
Racial diversity
Place of birth - Born in state of residence (%)
Place of birth - Born in state of residence (%) - White
Place of birth - Born in state of residence (%) - Black or African American
Place of birth - Born in state of residence (%) - Asian
Place of birth - Born in state of residence (%) - Hispanic or Latino
Place of birth - Born in state of residence (%) - American Indian and Alaska Native
Place of birth - Born in state of residence (%) - Multirace
Place of birth - Born in state of residence (%) - Other Race
Place of birth - Born in other state (%)
Place of birth - Born in other state (%) - White
Place of birth - Born in other state (%) - Black or African American
Place of birth - Born in other state (%) - Asian
Place of birth - Born in other state (%) - Hispanic or Latino
Place of birth - Born in other state (%) - American Indian and Alaska Native
Place of birth - Born in other state (%) - Multirace
Place of birth - Born in other state (%) - Other Race
Place of birth - Native, outside of US (%)
Place of birth - Native, outside of US (%) - White
Place of birth - Native, outside of US (%) - Black or African American
Place of birth - Native, outside of US (%) - Asian
Place of birth - Native, outside of US (%) - Hispanic or Latino
Place of birth - Native, outside of US (%) - American Indian and Alaska Native
Place of birth - Native, outside of US (%) - Multirace
Place of birth - Native, outside of US (%) - Other Race
Place of birth - Foreign born (%)
Place of birth - Foreign born (%) - White
Place of birth - Foreign born (%) - Black or African American
Place of birth - Foreign born (%) - Asian
Place of birth - Foreign born (%) - Hispanic or Latino
Place of birth - Foreign born (%) - American Indian and Alaska Native
Place of birth - Foreign born (%) - Multirace
Place of birth - Foreign born (%) - Other Race
Residents speaking English at home (%)
Residents speaking English at home - Born in the United States (%)
Residents speaking English at home - Native, born elsewhere (%)
Residents speaking English at home - Foreign born (%)
Residents speaking Spanish at home (%)
Residents speaking Spanish at home - Born in the United States (%)
Residents speaking Spanish at home - Native, born elsewhere (%)
Residents speaking Spanish at home - Foreign born (%)
Residents speaking other language at home (%)
Residents speaking other language at home - Born in the United States (%)
Residents speaking other language at home - Native, born elsewhere (%)
Residents speaking other language at home - Foreign born (%)
Marital status - Never married (%)
Marital status - Now married (%)
Marital status - Separated (%)
Marital status - Widowed (%)
Marital status - Divorced (%)
Ancestries Reported - Arab (%)
Ancestries Reported - Czech (%)
Ancestries Reported - Danish (%)
Ancestries Reported - Dutch (%)
Ancestries Reported - English (%)
Ancestries Reported - French (%)
Ancestries Reported - French Canadian (%)
Ancestries Reported - German (%)
Ancestries Reported - Greek (%)
Ancestries Reported - Hungarian (%)
Ancestries Reported - Irish (%)
Ancestries Reported - Italian (%)
Ancestries Reported - Lithuanian (%)
Ancestries Reported - Norwegian (%)
Ancestries Reported - Polish (%)
Ancestries Reported - Portuguese (%)
Ancestries Reported - Russian (%)
Ancestries Reported - Scotch-Irish (%)
Ancestries Reported - Scottish (%)
Ancestries Reported - Slovak (%)
Ancestries Reported - Subsaharan African (%)
Ancestries Reported - Swedish (%)
Ancestries Reported - Swiss (%)
Ancestries Reported - Ukrainian (%)
Ancestries Reported - United States (%)
Ancestries Reported - Welsh (%)
Ancestries Reported - West Indian (%)
Ancestries Reported - Other (%)
Geographical mobility - Same house 1 year ago (%)
Geographical mobility - Same house 1 year ago (%) - White
Geographical mobility - Same house 1 year ago (%) - Black or African American
Geographical mobility - Same house 1 year ago (%) - Asian
Geographical mobility - Same house 1 year ago (%) - Hispanic or Latino
Geographical mobility - Same house 1 year ago (%) - American Indian and Alaska Native
Geographical mobility - Same house 1 year ago (%) - Multirace
Geographical mobility - Same house 1 year ago (%) - Other Race
Geographical mobility - Moved within same county (%)
Geographical mobility - Moved within same county (%) - White
Geographical mobility - Moved within same county (%) - Black or African American
Geographical mobility - Moved within same county (%) - Asian
Geographical mobility - Moved within same county (%) - Hispanic or Latino
Geographical mobility - Moved within same county (%) - American Indian and Alaska Native
Geographical mobility - Moved within same county (%) - Multirace
Geographical mobility - Moved within same county (%) - Other Race
Geographical mobility - Moved from different county within same state (%)
Geographical mobility - Moved from different county within same state (%) - White
Geographical mobility - Moved from different county within same state (%) - Black or African American
Geographical mobility - Moved from different county within same state (%) - Asian
Geographical mobility - Moved from different county within same state (%) - Hispanic or Latino
Geographical mobility - Moved from different county within same state (%) - American Indian and Alaska Native
Geographical mobility - Moved from different county within same state (%) - Multirace
Geographical mobility - Moved from different county within same state (%) - Other Race
Geographical mobility - Moved from different state (%)
Geographical mobility - Moved from different state (%) - White
Geographical mobility - Moved from different state (%) - Black or African American
Geographical mobility - Moved from different state (%) - Asian
Geographical mobility - Moved from different state (%) - Hispanic or Latino
Geographical mobility - Moved from different state (%) - American Indian and Alaska Native
Geographical mobility - Moved from different state (%) - Multirace
Geographical mobility - Moved from different state (%) - Other Race
Geographical mobility - Moved from abroad (%)
Geographical mobility - Moved from abroad (%) - White
Geographical mobility - Moved from abroad (%) - Black or African American
Geographical mobility - Moved from abroad (%) - Asian
Geographical mobility - Moved from abroad (%) - Hispanic or Latino
Geographical mobility - Moved from abroad (%) - American Indian and Alaska Native
Geographical mobility - Moved from abroad (%) - Multirace
Geographical mobility - Moved from abroad (%) - Other Race
Place of birth for the foreign-born population - Ireland (%)
Place of birth for the foreign-born population - Denmark (%)
Place of birth for the foreign-born population - Norway (%)
Place of birth for the foreign-born population - Sweden (%)
Place of birth for the foreign-born population - United Kingdom (%)
Place of birth for the foreign-born population - England (%)
Place of birth for the foreign-born population - Scotland (%)
Place of birth for the foreign-born population - Other Northern Europe (%)
Place of birth for the foreign-born population - Austria (%)
Place of birth for the foreign-born population - Belgium (%)
Place of birth for the foreign-born population - France (%)
Place of birth for the foreign-born population - Germany (%)
Place of birth for the foreign-born population - Netherlands (%)
Place of birth for the foreign-born population - Switzerland (%)
Place of birth for the foreign-born population - Other Western Europe (%)
Place of birth for the foreign-born population - Greece (%)
Place of birth for the foreign-born population - Italy (%)
Place of birth for the foreign-born population - Portugal (%)
Place of birth for the foreign-born population - Spain (%)
Place of birth for the foreign-born population - Other Southern Europe (%)
Place of birth for the foreign-born population - Albania (%)
Place of birth for the foreign-born population - Belarus (%)
Place of birth for the foreign-born population - Bosnia and Herzegovina (%)
Place of birth for the foreign-born population - Bulgaria (%)
Place of birth for the foreign-born population - Croatia (%)
Place of birth for the foreign-born population - Czechoslovakia (%)
Place of birth for the foreign-born population - Hungary (%)
Place of birth for the foreign-born population - Latvia (%)
Place of birth for the foreign-born population - Lithuania (%)
Place of birth for the foreign-born population - North Macedonia (Macedonia) (%)
Place of birth for the foreign-born population - Moldova (%)
Place of birth for the foreign-born population - Poland (%)
Place of birth for the foreign-born population - Romania (%)
Place of birth for the foreign-born population - Russia (%)
Place of birth for the foreign-born population - Serbia (%)
Place of birth for the foreign-born population - Ukraine (%)
Place of birth for the foreign-born population - Other Eastern Europe (%)
Place of birth for the foreign-born population - China (%)
Place of birth for the foreign-born population - Hong Kong (%)
Place of birth for the foreign-born population - Taiwan (%)
Place of birth for the foreign-born population - Japan (%)
Place of birth for the foreign-born population - Korea (%)
Place of birth for the foreign-born population - Other Eastern Asia (%)
Place of birth for the foreign-born population - Afghanistan (%)
Place of birth for the foreign-born population - Bangladesh (%)
Place of birth for the foreign-born population - India (%)
Place of birth for the foreign-born population - Iran (%)
Place of birth for the foreign-born population - Kazakhstan (%)
Place of birth for the foreign-born population - Nepal (%)
Place of birth for the foreign-born population - Pakistan (%)
Place of birth for the foreign-born population - Sri Lanka (%)
Place of birth for the foreign-born population - Uzbekistan (%)
Place of birth for the foreign-born population - Other South Central Asia (%)
Place of birth for the foreign-born population - Burma (%)
Place of birth for the foreign-born population - Cambodia (%)
Place of birth for the foreign-born population - Indonesia (%)
Place of birth for the foreign-born population - Laos (%)
Place of birth for the foreign-born population - Malaysia (%)
Place of birth for the foreign-born population - Philippines (%)
Place of birth for the foreign-born population - Singapore (%)
Place of birth for the foreign-born population - Thailand (%)
Place of birth for the foreign-born population - Vietnam (%)
Place of birth for the foreign-born population - Other South Eastern Asia (%)
Place of birth for the foreign-born population - Armenia (%)
Place of birth for the foreign-born population - Iraq (%)
Place of birth for the foreign-born population - Israel (%)
Place of birth for the foreign-born population - Jordan (%)
Place of birth for the foreign-born population - Kuwait (%)
Place of birth for the foreign-born population - Lebanon (%)
Place of birth for the foreign-born population - Saudi Arabia (%)
Place of birth for the foreign-born population - Syria (%)
Place of birth for the foreign-born population - Turkey (%)
Place of birth for the foreign-born population - Yemen (%)
Place of birth for the foreign-born population - Other Western Asia (%)
Place of birth for the foreign-born population - Eritrea (%)
Place of birth for the foreign-born population - Ethiopia (%)
Place of birth for the foreign-born population - Kenya (%)
Place of birth for the foreign-born population - Somalia (%)
Place of birth for the foreign-born population - Uganda (%)
Place of birth for the foreign-born population - Zimbabwe (%)
Place of birth for the foreign-born population - Other Eastern Africa (%)
Place of birth for the foreign-born population - Cameroon (%)
Place of birth for the foreign-born population - Congo (%)
Place of birth for the foreign-born population - Democratic Republic of Congo (Zaire) (%)
Place of birth for the foreign-born population - Other Middle Africa (%)
Place of birth for the foreign-born population - Egypt (%)
Place of birth for the foreign-born population - Morocco (%)
Place of birth for the foreign-born population - Sudan (%)
Place of birth for the foreign-born population - Other Northern Africa (%)
Place of birth for the foreign-born population - South Africa (%)
Place of birth for the foreign-born population - Other Southern Africa (%)
Place of birth for the foreign-born population - Cabo Verde (%)
Place of birth for the foreign-born population - Ghana (%)
Place of birth for the foreign-born population - Liberia (%)
Place of birth for the foreign-born population - Nigeria (%)
Place of birth for the foreign-born population - Senegal (%)
Place of birth for the foreign-born population - Sierra Leone (%)
Place of birth for the foreign-born population - Other Western Africa (%)
Place of birth for the foreign-born population - Australia (%)
Place of birth for the foreign-born population - New Zealand (%)
Place of birth for the foreign-born population - Fiji (%)
Place of birth for the foreign-born population - Micronesia (%)
Place of birth for the foreign-born population - Bahamas (%)
Place of birth for the foreign-born population - Barbados (%)
Place of birth for the foreign-born population - Cuba (%)
Place of birth for the foreign-born population - Dominica (%)
Place of birth for the foreign-born population - Dominican Republic (%)
Place of birth for the foreign-born population - Grenada (%)
Place of birth for the foreign-born population - Haiti (%)
Place of birth for the foreign-born population - Jamaica (%)
Place of birth for the foreign-born population - St. Vincent and the Grenadines (%)
Place of birth for the foreign-born population - Trinidad and Tobago (%)
Place of birth for the foreign-born population - West Indies (%)
Place of birth for the foreign-born population - Other Caribbean (%)
Place of birth for the foreign-born population - Belize (%)
Place of birth for the foreign-born population - Costa Rica (%)
Place of birth for the foreign-born population - El Salvador (%)
Place of birth for the foreign-born population - Guatemala (%)
Place of birth for the foreign-born population - Honduras (%)
Place of birth for the foreign-born population - Mexico (%)
Place of birth for the foreign-born population - Nicaragua (%)
Place of birth for the foreign-born population - Panama (%)
Place of birth for the foreign-born population - Other Central America (%)
Place of birth for the foreign-born population - Argentina (%)
Place of birth for the foreign-born population - Bolivia (%)
Place of birth for the foreign-born population - Brazil (%)
Place of birth for the foreign-born population - Chile (%)
Place of birth for the foreign-born population - Colombia (%)
Place of birth for the foreign-born population - Ecuador (%)
Place of birth for the foreign-born population - Guyana (%)
Place of birth for the foreign-born population - Peru (%)
Place of birth for the foreign-born population - Uruguay (%)
Place of birth for the foreign-born population - Venezuela (%)
Place of birth for the foreign-born population - Other South America (%)
Place of birth for the foreign-born population - Canada (%)
Place of birth for the foreign-born population - Other Northern America (%)
Place of birth for the foreign-born population - Other (%)
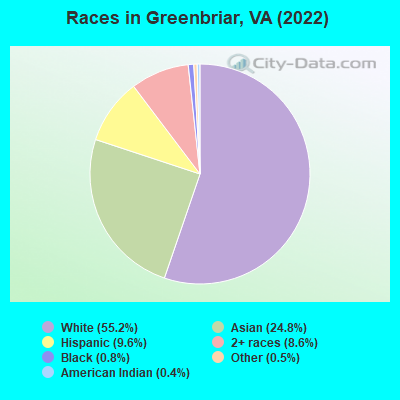
According to 2022 data, the most numerous races in Greenbriar, VA are White alone (4,361 residents), Black alone (66 residents), and Hispanic (757 residents). 66.0% of Greenbriar residents speak English at home.
Race distribution in Greenbriar 4,361 55.2% White alone 1,955 24.8% Asian alone 757 9.6% Hispanic 679 8.6% Two or more races 66 0.8% Black alone 43 0.5% Other race alone 28 0.4% American Indian alone
2000 2022
4,965,637 70.2% White alone 1,376,378 19.4% Black alone 329,540 4.7% Hispanic 259,277 3.7% Asian alone 114,022 1.6% Two or more races 18,596 0.3% American Indian alone 11,685 0.2% Other race alone 3,380 0.05% Native Hawaiian and Other
5,095,130 58.7% White alone 1,594,785 18.4% Black alone 905,750 10.4% Hispanic 602,881 6.9% Asian alone 406,047 4.7% Two or more races 60,419 0.7% Other race alone 11,738 0.1% American Indian alone 6,869 0.08% Native Hawaiian and Other
Income and house value in Greenbriar Median household income in 2022 $125,438 White non-Hispanic householders$140,584 Asian householders$105,058 Some other race householders$88,253 Two or more races householders$105,441 Hispanic or Latino race householders
Median age by race in Greenbriar
42.9 Median age for White residents45.8 41.1 55.8 Median age for Black or African American residents54.7 -696,888,888.2 70.0 Median age for American Indian / Alaska Native residents-964,539,006.1 -669,005,847.3 42.3 Median age for Asian residents38.9 44.2 -666,666,666.0 Median age for Native Hawaiian / Pacific Islander residents-558,791,801.0 -584,518,166.9 44.6 Median age for Other race residents45.3 15.9 23.6 Median age for Two or more races residents24.1 19.4 43.8 Median age for White alone residents45.5 40.8 25.7 Median age for Hispanic or Latino residents24.4 34.4
Owner/renter occupied households by race in Greenbriar
House owners and renters - White residents 1,413 72.3% Owner occupied540 27.7% Renter occupiedHouse owners and renters - Black or African American residents 12 39.0% Owner occupied19 61.0% Renter occupiedHouse owners and renters - American Indian / Alaska Native residents 9 100.0% Owner occupiedHouse owners and renters - Asian residents 416 61.7% Owner occupied259 38.3% Renter occupiedHouse owners and renters - Other race residents 105 100.0% Renter occupiedHouse owners and renters - Two or more races residents 99 36.2% Owner occupied174 63.8% Renter occupiedHouse owners and renters - White alone residents 1,414 70.8% Owner occupied582 29.2% Renter occupiedHouse owners and renters - Hispanic or Latino residents 91 53.1% Owner occupied80 46.9% Renter occupied
Language usage in Greenbriar
English speakers - Total 66.0% of residents of Greenbriar speak English at home.
7.7% of residents speak Spanish at home 341 60.4% Speak English very well224 39.6% Speak English less than very well26.4% of residents speak other language at home 1,362 70.5% Speak English very well571 29.5% Speak English less than very well
English speakers - Born in the United States 88.9% of residents of Greenbriar speak English at home.
2.7% of residents speak Spanish at home 88 100.0% Speak English very well8.3% of residents speak other language at home 171 64.5% Speak English very well94 35.5% Speak English less than very well
English speakers - Native, born elsewhere 72.4% of residents of Greenbriar speak English at home.
17.6% of residents speak Spanish at home 37 100.0% Speak English very well7.1% of residents speak other language at home 15 100.0% Speak English very well
English speakers - Foreign-born 9.7% of residents of Greenbriar speak English at home.
18.9% of residents speak Spanish at home 169 43.4% Speak English very well220 56.6% Speak English less than very well70.3% of residents speak other language at home 985 67.9% Speak English very well465 32.1% Speak English less than very well
White (Caucasian) - Speak only English Native:
96.6% (3,815)Foreign-born:
37.4% (46)
White (Caucasian) - Speak another language Native:
4.3% (168)Foreign-born:
66.8% (83)
Black or African American - Speak only English Native:
80.7% (27)Foreign-born:
100.0% (20)
Asian - Speak only English Native:
24.7% (102)Foreign-born:
8.6% (125)
Asian - Speak another language Native:
77.5% (321)Foreign-born:
90.8% (1,328)
Two or more races - Speak another language Native:
20.8% (164)Foreign-born:
100.0% (120)
White alone - Speak only English Native:
96.8% (3,792)Foreign-born:
34.4% (50)
White alone - Speak another language Native:
3.5% (135)Foreign-born:
66.6% (97)
Hispanic or Latino - Speak another language Native:
39.3% (127)Foreign-born:
99.9% (395)
Foreign-born residents in Greenbriar
Marital status for residents in Greenbriar Marital status - White (Caucasian) population 15 years and over
Males 29.9% Never married56.6% Now married2.1% Separated1.8% Widowed9.7% DivorcedFemales 26.5% Never married54.7% Now married0.0% Separated5.6% Widowed13.2% DivorcedWomen who gave birth in the past 12 months Now married:
100.0% (34)Unmarried:
0.0% (0)
Women who did not give birth in the past 12 months Now married:
49.8% (446)Unmarried:
50.2% (450)
Marital status - Black or African American population 15 years and over
Males 44.1% Never married0.0% Now married55.9% Separated0.0% Widowed0.0% DivorcedFemales 68.4% Never married31.6% Now married0.0% Separated0.0% Widowed0.0% DivorcedWomen who did not give birth in the past 12 months Now married:
100.0% (6)Unmarried:
0.0% (0)
Marital status - American Indian / Alaska Native population 15 years and over
Males 0.0% Never married0.0% Now married0.0% Separated0.0% Widowed100.0% DivorcedFemales 0.0% Never married0.0% Now married0.0% Separated0.0% Widowed100.0% DivorcedWomen who did not give birth in the past 12 months Now married:
0.0% (0)Unmarried:
100.0% (5)
Marital status - Asian population 15 years and over
Males 31.5% Never married61.7% Now married2.2% Separated0.0% Widowed4.6% DivorcedFemales 17.5% Never married76.4% Now married1.4% Separated1.7% Widowed3.1% DivorcedWomen who did not give birth in the past 12 months Now married:
80.7% (485)Unmarried:
19.3% (116)
Marital status - Other race population 15 years and over
Males 22.4% Never married77.6% Now married0.0% Separated0.0% Widowed0.0% DivorcedFemales 19.8% Never married80.2% Now married0.0% Separated0.0% Widowed0.0% DivorcedWomen who did not give birth in the past 12 months Now married:
78.1% (70)Unmarried:
21.9% (20)
Marital status - Two or more races population 15 years and over
Males 70.1% Never married13.4% Now married0.0% Separated0.0% Widowed16.5% DivorcedFemales 54.0% Never married41.0% Now married0.0% Separated0.0% Widowed5.0% DivorcedWomen who did not give birth in the past 12 months Now married:
28.9% (59)Unmarried:
71.1% (144)
Marital status - White alone, not Hispanic / Latino population 15 years and over
Males 29.4% Never married56.7% Now married2.2% Separated1.8% Widowed9.9% DivorcedFemales 27.5% Never married53.8% Now married0.0% Separated5.8% Widowed12.9% DivorcedWomen who gave birth in the past 12 months Now married:
100.0% (21)Unmarried:
0.0% (0)
Women who did not give birth in the past 12 months Now married:
49.3% (461)Unmarried:
50.7% (474)
Marital status - Hispanic or Latino population 15 years and over
Males 38.8% Never married61.2% Now married0.0% Separated0.0% Widowed0.0% DivorcedFemales 16.0% Never married76.8% Now married0.0% Separated0.0% Widowed7.2% DivorcedWomen who gave birth in the past 12 months Now married:
100.0% (16)Unmarried:
0.0% (0)
Women who did not give birth in the past 12 months Now married:
69.3% (123)Unmarried:
30.7% (55)
Ancestries in Greenbriar
517 13.0% English220 5.5% German211 5.3% Eastern European193 4.8% Italian134 3.4% American129 3.2% European94 2.4% Kenyan82 2.1% Turkish45 1.1% Irish31 0.8% Scotch-Irish30 0.8% British27 0.7% African24 0.6% Belgian24 0.6% Czech23 0.6% Cajun17 0.4% Scandinavian16 0.4% Greek16 0.4% Portuguese15 0.4% Lebanese14 0.4% Palestinian14 0.4% Danish14 0.4% Dutch14 0.4% French13 0.3% Polish13 0.3% Russian11 0.3% Iranian11 0.3% Slovak7 0.2% Afghan5 0.1% Arab
Children Nativity (place of birth) in Greenbriar
Children under 6 years - Living with two parents Both parents native 279 100.0% NativeBoth parents foreign-born 58 80.4% Native14 19.6% Foreign-bornOne native, one foreign-born parent 78 100.0% NativeChildren under 6 years - Living with one parent Native parent 100 100.0% NativeChildren 6 to 17 years - Living with two parents Both parents native 406 100.0% NativeBoth parents foreign-born 182 37.9% Native298 62.1% Foreign-bornOne native, one foreign-born parent 135 100.0% NativeChildren 6 to 17 years - Living with one parent Native parent 55 62.6% Native33 37.4% Foreign-bornForeign-born parent 48 81.9% Native11 18.1% Foreign-born