Races in Green Knoll, New Jersey (NJ) Detailed Stats
Data:
Races - White alone (%)
Races - White alone (% change since 2000)
Races - Black alone (%)
Races - Black alone (% change since 2000)
Races - American Indian alone (%)
Races - American Indian alone (% change since 2000)
Races - Asian alone (%)
Races - Asian alone (% change since 2000)
Races - Hispanic (%)
Races - Hispanic (% change since 2000)
Races - Native Hawaiian and Other Pacific Islander alone (%)
Races - Native Hawaiian and Other Pacific Islander alone (% change since 2000)
Races - Two or more races(%)
Races - Two or more races(% change since 2000)
Races - Other race alone (%)
Races - Other race alone (% change since 2000)
Racial diversity
Place of birth - Born in state of residence (%)
Place of birth - Born in state of residence (%) - White
Place of birth - Born in state of residence (%) - Black or African American
Place of birth - Born in state of residence (%) - Asian
Place of birth - Born in state of residence (%) - Hispanic or Latino
Place of birth - Born in state of residence (%) - American Indian and Alaska Native
Place of birth - Born in state of residence (%) - Multirace
Place of birth - Born in state of residence (%) - Other Race
Place of birth - Born in other state (%)
Place of birth - Born in other state (%) - White
Place of birth - Born in other state (%) - Black or African American
Place of birth - Born in other state (%) - Asian
Place of birth - Born in other state (%) - Hispanic or Latino
Place of birth - Born in other state (%) - American Indian and Alaska Native
Place of birth - Born in other state (%) - Multirace
Place of birth - Born in other state (%) - Other Race
Place of birth - Native, outside of US (%)
Place of birth - Native, outside of US (%) - White
Place of birth - Native, outside of US (%) - Black or African American
Place of birth - Native, outside of US (%) - Asian
Place of birth - Native, outside of US (%) - Hispanic or Latino
Place of birth - Native, outside of US (%) - American Indian and Alaska Native
Place of birth - Native, outside of US (%) - Multirace
Place of birth - Native, outside of US (%) - Other Race
Place of birth - Foreign born (%)
Place of birth - Foreign born (%) - White
Place of birth - Foreign born (%) - Black or African American
Place of birth - Foreign born (%) - Asian
Place of birth - Foreign born (%) - Hispanic or Latino
Place of birth - Foreign born (%) - American Indian and Alaska Native
Place of birth - Foreign born (%) - Multirace
Place of birth - Foreign born (%) - Other Race
Residents speaking English at home (%)
Residents speaking English at home - Born in the United States (%)
Residents speaking English at home - Native, born elsewhere (%)
Residents speaking English at home - Foreign born (%)
Residents speaking Spanish at home (%)
Residents speaking Spanish at home - Born in the United States (%)
Residents speaking Spanish at home - Native, born elsewhere (%)
Residents speaking Spanish at home - Foreign born (%)
Residents speaking other language at home (%)
Residents speaking other language at home - Born in the United States (%)
Residents speaking other language at home - Native, born elsewhere (%)
Residents speaking other language at home - Foreign born (%)
Marital status - Never married (%)
Marital status - Now married (%)
Marital status - Separated (%)
Marital status - Widowed (%)
Marital status - Divorced (%)
Ancestries Reported - Arab (%)
Ancestries Reported - Czech (%)
Ancestries Reported - Danish (%)
Ancestries Reported - Dutch (%)
Ancestries Reported - English (%)
Ancestries Reported - French (%)
Ancestries Reported - French Canadian (%)
Ancestries Reported - German (%)
Ancestries Reported - Greek (%)
Ancestries Reported - Hungarian (%)
Ancestries Reported - Irish (%)
Ancestries Reported - Italian (%)
Ancestries Reported - Lithuanian (%)
Ancestries Reported - Norwegian (%)
Ancestries Reported - Polish (%)
Ancestries Reported - Portuguese (%)
Ancestries Reported - Russian (%)
Ancestries Reported - Scotch-Irish (%)
Ancestries Reported - Scottish (%)
Ancestries Reported - Slovak (%)
Ancestries Reported - Subsaharan African (%)
Ancestries Reported - Swedish (%)
Ancestries Reported - Swiss (%)
Ancestries Reported - Ukrainian (%)
Ancestries Reported - United States (%)
Ancestries Reported - Welsh (%)
Ancestries Reported - West Indian (%)
Ancestries Reported - Other (%)
Geographical mobility - Same house 1 year ago (%)
Geographical mobility - Same house 1 year ago (%) - White
Geographical mobility - Same house 1 year ago (%) - Black or African American
Geographical mobility - Same house 1 year ago (%) - Asian
Geographical mobility - Same house 1 year ago (%) - Hispanic or Latino
Geographical mobility - Same house 1 year ago (%) - American Indian and Alaska Native
Geographical mobility - Same house 1 year ago (%) - Multirace
Geographical mobility - Same house 1 year ago (%) - Other Race
Geographical mobility - Moved within same county (%)
Geographical mobility - Moved within same county (%) - White
Geographical mobility - Moved within same county (%) - Black or African American
Geographical mobility - Moved within same county (%) - Asian
Geographical mobility - Moved within same county (%) - Hispanic or Latino
Geographical mobility - Moved within same county (%) - American Indian and Alaska Native
Geographical mobility - Moved within same county (%) - Multirace
Geographical mobility - Moved within same county (%) - Other Race
Geographical mobility - Moved from different county within same state (%)
Geographical mobility - Moved from different county within same state (%) - White
Geographical mobility - Moved from different county within same state (%) - Black or African American
Geographical mobility - Moved from different county within same state (%) - Asian
Geographical mobility - Moved from different county within same state (%) - Hispanic or Latino
Geographical mobility - Moved from different county within same state (%) - American Indian and Alaska Native
Geographical mobility - Moved from different county within same state (%) - Multirace
Geographical mobility - Moved from different county within same state (%) - Other Race
Geographical mobility - Moved from different state (%)
Geographical mobility - Moved from different state (%) - White
Geographical mobility - Moved from different state (%) - Black or African American
Geographical mobility - Moved from different state (%) - Asian
Geographical mobility - Moved from different state (%) - Hispanic or Latino
Geographical mobility - Moved from different state (%) - American Indian and Alaska Native
Geographical mobility - Moved from different state (%) - Multirace
Geographical mobility - Moved from different state (%) - Other Race
Geographical mobility - Moved from abroad (%)
Geographical mobility - Moved from abroad (%) - White
Geographical mobility - Moved from abroad (%) - Black or African American
Geographical mobility - Moved from abroad (%) - Asian
Geographical mobility - Moved from abroad (%) - Hispanic or Latino
Geographical mobility - Moved from abroad (%) - American Indian and Alaska Native
Geographical mobility - Moved from abroad (%) - Multirace
Geographical mobility - Moved from abroad (%) - Other Race
Place of birth for the foreign-born population - Ireland (%)
Place of birth for the foreign-born population - Denmark (%)
Place of birth for the foreign-born population - Norway (%)
Place of birth for the foreign-born population - Sweden (%)
Place of birth for the foreign-born population - United Kingdom (%)
Place of birth for the foreign-born population - England (%)
Place of birth for the foreign-born population - Scotland (%)
Place of birth for the foreign-born population - Other Northern Europe (%)
Place of birth for the foreign-born population - Austria (%)
Place of birth for the foreign-born population - Belgium (%)
Place of birth for the foreign-born population - France (%)
Place of birth for the foreign-born population - Germany (%)
Place of birth for the foreign-born population - Netherlands (%)
Place of birth for the foreign-born population - Switzerland (%)
Place of birth for the foreign-born population - Other Western Europe (%)
Place of birth for the foreign-born population - Greece (%)
Place of birth for the foreign-born population - Italy (%)
Place of birth for the foreign-born population - Portugal (%)
Place of birth for the foreign-born population - Spain (%)
Place of birth for the foreign-born population - Other Southern Europe (%)
Place of birth for the foreign-born population - Albania (%)
Place of birth for the foreign-born population - Belarus (%)
Place of birth for the foreign-born population - Bosnia and Herzegovina (%)
Place of birth for the foreign-born population - Bulgaria (%)
Place of birth for the foreign-born population - Croatia (%)
Place of birth for the foreign-born population - Czechoslovakia (%)
Place of birth for the foreign-born population - Hungary (%)
Place of birth for the foreign-born population - Latvia (%)
Place of birth for the foreign-born population - Lithuania (%)
Place of birth for the foreign-born population - North Macedonia (Macedonia) (%)
Place of birth for the foreign-born population - Moldova (%)
Place of birth for the foreign-born population - Poland (%)
Place of birth for the foreign-born population - Romania (%)
Place of birth for the foreign-born population - Russia (%)
Place of birth for the foreign-born population - Serbia (%)
Place of birth for the foreign-born population - Ukraine (%)
Place of birth for the foreign-born population - Other Eastern Europe (%)
Place of birth for the foreign-born population - China (%)
Place of birth for the foreign-born population - Hong Kong (%)
Place of birth for the foreign-born population - Taiwan (%)
Place of birth for the foreign-born population - Japan (%)
Place of birth for the foreign-born population - Korea (%)
Place of birth for the foreign-born population - Other Eastern Asia (%)
Place of birth for the foreign-born population - Afghanistan (%)
Place of birth for the foreign-born population - Bangladesh (%)
Place of birth for the foreign-born population - India (%)
Place of birth for the foreign-born population - Iran (%)
Place of birth for the foreign-born population - Kazakhstan (%)
Place of birth for the foreign-born population - Nepal (%)
Place of birth for the foreign-born population - Pakistan (%)
Place of birth for the foreign-born population - Sri Lanka (%)
Place of birth for the foreign-born population - Uzbekistan (%)
Place of birth for the foreign-born population - Other South Central Asia (%)
Place of birth for the foreign-born population - Burma (%)
Place of birth for the foreign-born population - Cambodia (%)
Place of birth for the foreign-born population - Indonesia (%)
Place of birth for the foreign-born population - Laos (%)
Place of birth for the foreign-born population - Malaysia (%)
Place of birth for the foreign-born population - Philippines (%)
Place of birth for the foreign-born population - Singapore (%)
Place of birth for the foreign-born population - Thailand (%)
Place of birth for the foreign-born population - Vietnam (%)
Place of birth for the foreign-born population - Other South Eastern Asia (%)
Place of birth for the foreign-born population - Armenia (%)
Place of birth for the foreign-born population - Iraq (%)
Place of birth for the foreign-born population - Israel (%)
Place of birth for the foreign-born population - Jordan (%)
Place of birth for the foreign-born population - Kuwait (%)
Place of birth for the foreign-born population - Lebanon (%)
Place of birth for the foreign-born population - Saudi Arabia (%)
Place of birth for the foreign-born population - Syria (%)
Place of birth for the foreign-born population - Turkey (%)
Place of birth for the foreign-born population - Yemen (%)
Place of birth for the foreign-born population - Other Western Asia (%)
Place of birth for the foreign-born population - Eritrea (%)
Place of birth for the foreign-born population - Ethiopia (%)
Place of birth for the foreign-born population - Kenya (%)
Place of birth for the foreign-born population - Somalia (%)
Place of birth for the foreign-born population - Uganda (%)
Place of birth for the foreign-born population - Zimbabwe (%)
Place of birth for the foreign-born population - Other Eastern Africa (%)
Place of birth for the foreign-born population - Cameroon (%)
Place of birth for the foreign-born population - Congo (%)
Place of birth for the foreign-born population - Democratic Republic of Congo (Zaire) (%)
Place of birth for the foreign-born population - Other Middle Africa (%)
Place of birth for the foreign-born population - Egypt (%)
Place of birth for the foreign-born population - Morocco (%)
Place of birth for the foreign-born population - Sudan (%)
Place of birth for the foreign-born population - Other Northern Africa (%)
Place of birth for the foreign-born population - South Africa (%)
Place of birth for the foreign-born population - Other Southern Africa (%)
Place of birth for the foreign-born population - Cabo Verde (%)
Place of birth for the foreign-born population - Ghana (%)
Place of birth for the foreign-born population - Liberia (%)
Place of birth for the foreign-born population - Nigeria (%)
Place of birth for the foreign-born population - Senegal (%)
Place of birth for the foreign-born population - Sierra Leone (%)
Place of birth for the foreign-born population - Other Western Africa (%)
Place of birth for the foreign-born population - Australia (%)
Place of birth for the foreign-born population - New Zealand (%)
Place of birth for the foreign-born population - Fiji (%)
Place of birth for the foreign-born population - Micronesia (%)
Place of birth for the foreign-born population - Bahamas (%)
Place of birth for the foreign-born population - Barbados (%)
Place of birth for the foreign-born population - Cuba (%)
Place of birth for the foreign-born population - Dominica (%)
Place of birth for the foreign-born population - Dominican Republic (%)
Place of birth for the foreign-born population - Grenada (%)
Place of birth for the foreign-born population - Haiti (%)
Place of birth for the foreign-born population - Jamaica (%)
Place of birth for the foreign-born population - St. Vincent and the Grenadines (%)
Place of birth for the foreign-born population - Trinidad and Tobago (%)
Place of birth for the foreign-born population - West Indies (%)
Place of birth for the foreign-born population - Other Caribbean (%)
Place of birth for the foreign-born population - Belize (%)
Place of birth for the foreign-born population - Costa Rica (%)
Place of birth for the foreign-born population - El Salvador (%)
Place of birth for the foreign-born population - Guatemala (%)
Place of birth for the foreign-born population - Honduras (%)
Place of birth for the foreign-born population - Mexico (%)
Place of birth for the foreign-born population - Nicaragua (%)
Place of birth for the foreign-born population - Panama (%)
Place of birth for the foreign-born population - Other Central America (%)
Place of birth for the foreign-born population - Argentina (%)
Place of birth for the foreign-born population - Bolivia (%)
Place of birth for the foreign-born population - Brazil (%)
Place of birth for the foreign-born population - Chile (%)
Place of birth for the foreign-born population - Colombia (%)
Place of birth for the foreign-born population - Ecuador (%)
Place of birth for the foreign-born population - Guyana (%)
Place of birth for the foreign-born population - Peru (%)
Place of birth for the foreign-born population - Uruguay (%)
Place of birth for the foreign-born population - Venezuela (%)
Place of birth for the foreign-born population - Other South America (%)
Place of birth for the foreign-born population - Canada (%)
Place of birth for the foreign-born population - Other Northern America (%)
Place of birth for the foreign-born population - Other (%)
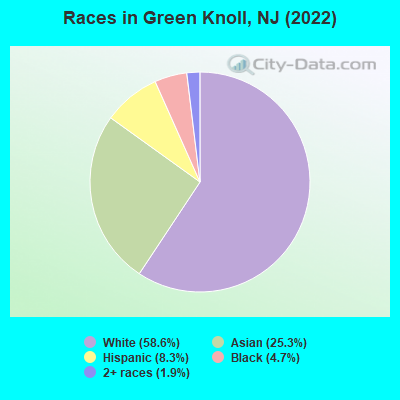
According to 2022 data, the most numerous races in Green Knoll, NJ are White alone (3,906 residents), Hispanic (554 residents), and Black alone (311 residents). 67.9% of Green Knoll residents speak English at home.
Race distribution in Green Knoll 3,906 58.6% White alone 1,687 25.3% Asian alone 554 8.3% Hispanic 311 4.7% Black alone 127 1.9% Two or more races 6 0.09% Native Hawaiian and Other 3 0.04% Other race alone
2000 2022
5,557,209 66.0% White alone 1,117,191 13.3% Hispanic 1,096,171 13.0% Black alone 477,012 5.7% Asian alone 133,689 1.6% Two or more races 19,565 0.2% Other race alone 11,338 0.1% American Indian alone 2,175 0.03% Native Hawaiian and Other
4,766,476 51.5% White alone 2,028,470 21.9% Hispanic 1,111,632 12.0% Black alone 923,546 10.0% Asian alone 332,237 3.6% Two or more races 89,847 1.0% Other race alone 8,557 0.09% American Indian alone 934 0.01% Native Hawaiian and Other
Income and house value in Green Knoll Median household income in 2022 $140,164 White non-Hispanic householdersover $200,000 Black householders$170,123 Asian householdersover $200,000 Two or more races householders$138,334 Hispanic or Latino race householders
Median age by race in Green Knoll
48.5 Median age for White residents43.5 52.4 45.8 Median age for Black or African American residents46.4 41.8 -666,666,666.0 Median age for American Indian / Alaska Native residents-643,500,642.9 -1,220,338,981.8 38.8 Median age for Asian residents38.2 39.8 -804,177,544.9 Median age for Native Hawaiian / Pacific Islander residents-666,666,666.0 -713,070,378.3 41.5 Median age for Other race residents38.3 51.1 60.8 Median age for Two or more races residents62.1 53.6 50.9 Median age for White alone residents44.6 54.3 36.3 Median age for Hispanic or Latino residents34.6 36.9
Owner/renter occupied households by race in Green Knoll
House owners and renters - White residents 1,170 77.1% Owner occupied347 22.9% Renter occupiedHouse owners and renters - Black or African American residents 96 100.0% Owner occupiedHouse owners and renters - Asian residents 413 77.1% Owner occupied123 22.9% Renter occupiedHouse owners and renters - Other race residents 37 100.0% Owner occupiedHouse owners and renters - Two or more races residents 131 85.6% Owner occupied22 14.4% Renter occupiedHouse owners and renters - White alone residents 1,146 76.2% Owner occupied358 23.8% Renter occupiedHouse owners and renters - Hispanic or Latino residents 168 80.0% Owner occupied42 20.0% Renter occupied
Language usage in Green Knoll
English speakers - Total 67.9% of residents of Green Knoll speak English at home.
5.9% of residents speak Spanish at home 286 75.3% Speak English very well94 24.7% Speak English less than very well26.3% of residents speak other language at home 1,277 76.1% Speak English very well402 23.9% Speak English less than very well
English speakers - Born in the United States 90.7% of residents of Green Knoll speak English at home.
4.3% of residents speak Spanish at home 29 61.7% Speak English very well18 38.3% Speak English less than very well5.4% of residents speak other language at home 59 100.0% Speak English very well
English speakers - Native, born elsewhere 14.4% of residents of Green Knoll speak English at home.
65.3% of residents speak Spanish at home 38 49.4% Speak English very well39 50.6% Speak English less than very well35.6% of residents speak other language at home 7 16.7% Speak English very well35 83.3% Speak English less than very well
English speakers - Foreign-born 21.8% of residents of Green Knoll speak English at home.
8.3% of residents speak Spanish at home 75 59.5% Speak English very well51 40.5% Speak English less than very well71.2% of residents speak other language at home 734 67.6% Speak English very well352 32.4% Speak English less than very well
White (Caucasian) - Speak only English Native:
93.0% (3,299)Foreign-born:
49.7% (147)
White (Caucasian) - Speak another language Native:
7.0% (250)Foreign-born:
46.8% (138)
Black or African American - Speak another language Native:
12.1% (35)Foreign-born:
52.7% (22)
Asian - Speak only English Native:
33.1% (185)Foreign-born:
8.9% (93)
Asian - Speak another language Native:
70.8% (396)Foreign-born:
91.1% (950)
Other race - Speak another language Native:
100.0% (26)Foreign-born:
78.4% (45)
Two or more races - Speak only English Native:
58.8% (190)Foreign-born:
10.5% (5)
Two or more races - Speak another language Native:
39.3% (127)Foreign-born:
89.4% (38)
White alone - Speak only English Native:
93.8% (3,228)Foreign-born:
53.1% (155)
White alone - Speak another language Native:
6.1% (210)Foreign-born:
35.5% (103)
Hispanic or Latino - Speak only English Native:
39.1% (159)Foreign-born:
12.1% (17)
Hispanic or Latino - Speak another language Native:
61.1% (249)Foreign-born:
88.8% (127)
Foreign-born residents in Green Knoll
Marital status for residents in Green Knoll Marital status - White (Caucasian) population 15 years and over
Males 30.4% Never married58.8% Now married0.7% Separated2.6% Widowed7.4% DivorcedFemales 25.8% Never married43.9% Now married1.3% Separated15.6% Widowed13.3% DivorcedWomen who gave birth in the past 12 months Now married:
7.7% (10)Unmarried:
92.3% (120)
Women who did not give birth in the past 12 months Now married:
51.4% (337)Unmarried:
48.6% (319)
Marital status - Black or African American population 15 years and over
Males 26.6% Never married73.4% Now married0.0% Separated0.0% Widowed0.0% DivorcedFemales 39.7% Never married48.9% Now married1.1% Separated0.0% Widowed10.3% DivorcedWomen who did not give birth in the past 12 months Now married:
44.0% (34)Unmarried:
56.0% (43)
Marital status - Asian population 15 years and over
Males 31.3% Never married64.3% Now married0.0% Separated1.1% Widowed3.3% DivorcedFemales 19.2% Never married61.2% Now married5.5% Separated3.9% Widowed10.1% DivorcedWomen who did not give birth in the past 12 months Now married:
69.0% (252)Unmarried:
31.0% (113)
Marital status - Other race population 15 years and over
Males 56.1% Never married43.9% Now married0.0% Separated0.0% Widowed0.0% DivorcedFemales 0.0% Never married100.0% Now married0.0% Separated0.0% Widowed0.0% DivorcedWomen who did not give birth in the past 12 months Now married:
100.0% (22)Unmarried:
0.0% (0)
Marital status - Two or more races population 15 years and over
Males 12.8% Never married87.2% Now married0.0% Separated0.0% Widowed0.0% DivorcedFemales 31.6% Never married65.8% Now married0.0% Separated2.6% Widowed0.0% DivorcedWomen who did not give birth in the past 12 months Now married:
59.6% (48)Unmarried:
40.4% (32)
Marital status - White alone, not Hispanic / Latino population 15 years and over
Males 31.4% Never married58.6% Now married0.7% Separated1.7% Widowed7.5% DivorcedFemales 24.2% Never married44.9% Now married0.9% Separated15.8% Widowed14.3% DivorcedWomen who gave birth in the past 12 months Now married:
7.7% (10)Unmarried:
92.3% (125)
Women who did not give birth in the past 12 months Now married:
53.7% (317)Unmarried:
46.3% (274)
Marital status - Hispanic or Latino population 15 years and over
Males 33.1% Never married55.8% Now married0.0% Separated9.2% Widowed1.8% DivorcedFemales 34.2% Never married53.8% Now married4.1% Separated7.9% Widowed0.0% DivorcedWomen who did not give birth in the past 12 months Now married:
56.2% (93)Unmarried:
43.8% (73)
Ancestries in Green Knoll
237 8.2% Italian112 3.9% Irish104 3.6% Egyptian98 3.4% German80 2.8% Polish54 1.9% European49 1.7% English42 1.5% Hungarian40 1.4% American40 1.4% Portuguese28 1.0% Eastern European26 0.9% Greek23 0.8% Northern European19 0.7% Austrian15 0.5% Swedish11 0.4% French10 0.3% Norwegian9 0.3% Scotch-Irish8 0.3% Scottish8 0.3% U.S. Virgin Islander7 0.2% Czech3 0.1% Armenian
Children Nativity (place of birth) in Green Knoll
Children under 6 years - Living with two parents Both parents native 98 100.0% NativeBoth parents foreign-born 85 100.0% NativeOne native, one foreign-born parent 25 100.0% NativeChildren under 6 years - Living with one parent Native parent 95 100.0% NativeChildren 6 to 17 years - Living with two parents Both parents native 407 94.8% Native22 5.2% Foreign-bornBoth parents foreign-born 436 84.5% Native80 15.5% Foreign-bornOne native, one foreign-born parent 44 100.0% NativeChildren 6 to 17 years - Living with one parent Native parent 100 100.0% NativeForeign-born parent 10 45.9% Native12 54.1% Foreign-born
Grandparents responsible for own grandchildren in Green Knoll
Grandparents (30 to 59 years) White / Caucasian 7 100.0% Responsible for grandchildrenHispanic or Latino 12 100.0% Responsible for grandchildren
Grandparents (60 years and over) White / Caucasian 110 100.0% Not responsible for grandchildrenHispanic or Latino 22 100.0% Not responsible for grandchildren