Races in Green Cove Springs, Florida (FL) Detailed Stats
Data:
Races - White alone (%)
Races - White alone (% change since 2000)
Races - Black alone (%)
Races - Black alone (% change since 2000)
Races - American Indian alone (%)
Races - American Indian alone (% change since 2000)
Races - Asian alone (%)
Races - Asian alone (% change since 2000)
Races - Hispanic (%)
Races - Hispanic (% change since 2000)
Races - Native Hawaiian and Other Pacific Islander alone (%)
Races - Native Hawaiian and Other Pacific Islander alone (% change since 2000)
Races - Two or more races(%)
Races - Two or more races(% change since 2000)
Races - Other race alone (%)
Races - Other race alone (% change since 2000)
Racial diversity
Place of birth - Born in state of residence (%)
Place of birth - Born in state of residence (%) - White
Place of birth - Born in state of residence (%) - Black or African American
Place of birth - Born in state of residence (%) - Asian
Place of birth - Born in state of residence (%) - Hispanic or Latino
Place of birth - Born in state of residence (%) - American Indian and Alaska Native
Place of birth - Born in state of residence (%) - Multirace
Place of birth - Born in state of residence (%) - Other Race
Place of birth - Born in other state (%)
Place of birth - Born in other state (%) - White
Place of birth - Born in other state (%) - Black or African American
Place of birth - Born in other state (%) - Asian
Place of birth - Born in other state (%) - Hispanic or Latino
Place of birth - Born in other state (%) - American Indian and Alaska Native
Place of birth - Born in other state (%) - Multirace
Place of birth - Born in other state (%) - Other Race
Place of birth - Native, outside of US (%)
Place of birth - Native, outside of US (%) - White
Place of birth - Native, outside of US (%) - Black or African American
Place of birth - Native, outside of US (%) - Asian
Place of birth - Native, outside of US (%) - Hispanic or Latino
Place of birth - Native, outside of US (%) - American Indian and Alaska Native
Place of birth - Native, outside of US (%) - Multirace
Place of birth - Native, outside of US (%) - Other Race
Place of birth - Foreign born (%)
Place of birth - Foreign born (%) - White
Place of birth - Foreign born (%) - Black or African American
Place of birth - Foreign born (%) - Asian
Place of birth - Foreign born (%) - Hispanic or Latino
Place of birth - Foreign born (%) - American Indian and Alaska Native
Place of birth - Foreign born (%) - Multirace
Place of birth - Foreign born (%) - Other Race
Residents speaking English at home (%)
Residents speaking English at home - Born in the United States (%)
Residents speaking English at home - Native, born elsewhere (%)
Residents speaking English at home - Foreign born (%)
Residents speaking Spanish at home (%)
Residents speaking Spanish at home - Born in the United States (%)
Residents speaking Spanish at home - Native, born elsewhere (%)
Residents speaking Spanish at home - Foreign born (%)
Residents speaking other language at home (%)
Residents speaking other language at home - Born in the United States (%)
Residents speaking other language at home - Native, born elsewhere (%)
Residents speaking other language at home - Foreign born (%)
Marital status - Never married (%)
Marital status - Now married (%)
Marital status - Separated (%)
Marital status - Widowed (%)
Marital status - Divorced (%)
Ancestries Reported - Arab (%)
Ancestries Reported - Czech (%)
Ancestries Reported - Danish (%)
Ancestries Reported - Dutch (%)
Ancestries Reported - English (%)
Ancestries Reported - French (%)
Ancestries Reported - French Canadian (%)
Ancestries Reported - German (%)
Ancestries Reported - Greek (%)
Ancestries Reported - Hungarian (%)
Ancestries Reported - Irish (%)
Ancestries Reported - Italian (%)
Ancestries Reported - Lithuanian (%)
Ancestries Reported - Norwegian (%)
Ancestries Reported - Polish (%)
Ancestries Reported - Portuguese (%)
Ancestries Reported - Russian (%)
Ancestries Reported - Scotch-Irish (%)
Ancestries Reported - Scottish (%)
Ancestries Reported - Slovak (%)
Ancestries Reported - Subsaharan African (%)
Ancestries Reported - Swedish (%)
Ancestries Reported - Swiss (%)
Ancestries Reported - Ukrainian (%)
Ancestries Reported - United States (%)
Ancestries Reported - Welsh (%)
Ancestries Reported - West Indian (%)
Ancestries Reported - Other (%)
Geographical mobility - Same house 1 year ago (%)
Geographical mobility - Same house 1 year ago (%) - White
Geographical mobility - Same house 1 year ago (%) - Black or African American
Geographical mobility - Same house 1 year ago (%) - Asian
Geographical mobility - Same house 1 year ago (%) - Hispanic or Latino
Geographical mobility - Same house 1 year ago (%) - American Indian and Alaska Native
Geographical mobility - Same house 1 year ago (%) - Multirace
Geographical mobility - Same house 1 year ago (%) - Other Race
Geographical mobility - Moved within same county (%)
Geographical mobility - Moved within same county (%) - White
Geographical mobility - Moved within same county (%) - Black or African American
Geographical mobility - Moved within same county (%) - Asian
Geographical mobility - Moved within same county (%) - Hispanic or Latino
Geographical mobility - Moved within same county (%) - American Indian and Alaska Native
Geographical mobility - Moved within same county (%) - Multirace
Geographical mobility - Moved within same county (%) - Other Race
Geographical mobility - Moved from different county within same state (%)
Geographical mobility - Moved from different county within same state (%) - White
Geographical mobility - Moved from different county within same state (%) - Black or African American
Geographical mobility - Moved from different county within same state (%) - Asian
Geographical mobility - Moved from different county within same state (%) - Hispanic or Latino
Geographical mobility - Moved from different county within same state (%) - American Indian and Alaska Native
Geographical mobility - Moved from different county within same state (%) - Multirace
Geographical mobility - Moved from different county within same state (%) - Other Race
Geographical mobility - Moved from different state (%)
Geographical mobility - Moved from different state (%) - White
Geographical mobility - Moved from different state (%) - Black or African American
Geographical mobility - Moved from different state (%) - Asian
Geographical mobility - Moved from different state (%) - Hispanic or Latino
Geographical mobility - Moved from different state (%) - American Indian and Alaska Native
Geographical mobility - Moved from different state (%) - Multirace
Geographical mobility - Moved from different state (%) - Other Race
Geographical mobility - Moved from abroad (%)
Geographical mobility - Moved from abroad (%) - White
Geographical mobility - Moved from abroad (%) - Black or African American
Geographical mobility - Moved from abroad (%) - Asian
Geographical mobility - Moved from abroad (%) - Hispanic or Latino
Geographical mobility - Moved from abroad (%) - American Indian and Alaska Native
Geographical mobility - Moved from abroad (%) - Multirace
Geographical mobility - Moved from abroad (%) - Other Race
Place of birth for the foreign-born population - Ireland (%)
Place of birth for the foreign-born population - Denmark (%)
Place of birth for the foreign-born population - Norway (%)
Place of birth for the foreign-born population - Sweden (%)
Place of birth for the foreign-born population - United Kingdom (%)
Place of birth for the foreign-born population - England (%)
Place of birth for the foreign-born population - Scotland (%)
Place of birth for the foreign-born population - Other Northern Europe (%)
Place of birth for the foreign-born population - Austria (%)
Place of birth for the foreign-born population - Belgium (%)
Place of birth for the foreign-born population - France (%)
Place of birth for the foreign-born population - Germany (%)
Place of birth for the foreign-born population - Netherlands (%)
Place of birth for the foreign-born population - Switzerland (%)
Place of birth for the foreign-born population - Other Western Europe (%)
Place of birth for the foreign-born population - Greece (%)
Place of birth for the foreign-born population - Italy (%)
Place of birth for the foreign-born population - Portugal (%)
Place of birth for the foreign-born population - Spain (%)
Place of birth for the foreign-born population - Other Southern Europe (%)
Place of birth for the foreign-born population - Albania (%)
Place of birth for the foreign-born population - Belarus (%)
Place of birth for the foreign-born population - Bosnia and Herzegovina (%)
Place of birth for the foreign-born population - Bulgaria (%)
Place of birth for the foreign-born population - Croatia (%)
Place of birth for the foreign-born population - Czechoslovakia (%)
Place of birth for the foreign-born population - Hungary (%)
Place of birth for the foreign-born population - Latvia (%)
Place of birth for the foreign-born population - Lithuania (%)
Place of birth for the foreign-born population - North Macedonia (Macedonia) (%)
Place of birth for the foreign-born population - Moldova (%)
Place of birth for the foreign-born population - Poland (%)
Place of birth for the foreign-born population - Romania (%)
Place of birth for the foreign-born population - Russia (%)
Place of birth for the foreign-born population - Serbia (%)
Place of birth for the foreign-born population - Ukraine (%)
Place of birth for the foreign-born population - Other Eastern Europe (%)
Place of birth for the foreign-born population - China (%)
Place of birth for the foreign-born population - Hong Kong (%)
Place of birth for the foreign-born population - Taiwan (%)
Place of birth for the foreign-born population - Japan (%)
Place of birth for the foreign-born population - Korea (%)
Place of birth for the foreign-born population - Other Eastern Asia (%)
Place of birth for the foreign-born population - Afghanistan (%)
Place of birth for the foreign-born population - Bangladesh (%)
Place of birth for the foreign-born population - India (%)
Place of birth for the foreign-born population - Iran (%)
Place of birth for the foreign-born population - Kazakhstan (%)
Place of birth for the foreign-born population - Nepal (%)
Place of birth for the foreign-born population - Pakistan (%)
Place of birth for the foreign-born population - Sri Lanka (%)
Place of birth for the foreign-born population - Uzbekistan (%)
Place of birth for the foreign-born population - Other South Central Asia (%)
Place of birth for the foreign-born population - Burma (%)
Place of birth for the foreign-born population - Cambodia (%)
Place of birth for the foreign-born population - Indonesia (%)
Place of birth for the foreign-born population - Laos (%)
Place of birth for the foreign-born population - Malaysia (%)
Place of birth for the foreign-born population - Philippines (%)
Place of birth for the foreign-born population - Singapore (%)
Place of birth for the foreign-born population - Thailand (%)
Place of birth for the foreign-born population - Vietnam (%)
Place of birth for the foreign-born population - Other South Eastern Asia (%)
Place of birth for the foreign-born population - Armenia (%)
Place of birth for the foreign-born population - Iraq (%)
Place of birth for the foreign-born population - Israel (%)
Place of birth for the foreign-born population - Jordan (%)
Place of birth for the foreign-born population - Kuwait (%)
Place of birth for the foreign-born population - Lebanon (%)
Place of birth for the foreign-born population - Saudi Arabia (%)
Place of birth for the foreign-born population - Syria (%)
Place of birth for the foreign-born population - Turkey (%)
Place of birth for the foreign-born population - Yemen (%)
Place of birth for the foreign-born population - Other Western Asia (%)
Place of birth for the foreign-born population - Eritrea (%)
Place of birth for the foreign-born population - Ethiopia (%)
Place of birth for the foreign-born population - Kenya (%)
Place of birth for the foreign-born population - Somalia (%)
Place of birth for the foreign-born population - Uganda (%)
Place of birth for the foreign-born population - Zimbabwe (%)
Place of birth for the foreign-born population - Other Eastern Africa (%)
Place of birth for the foreign-born population - Cameroon (%)
Place of birth for the foreign-born population - Congo (%)
Place of birth for the foreign-born population - Democratic Republic of Congo (Zaire) (%)
Place of birth for the foreign-born population - Other Middle Africa (%)
Place of birth for the foreign-born population - Egypt (%)
Place of birth for the foreign-born population - Morocco (%)
Place of birth for the foreign-born population - Sudan (%)
Place of birth for the foreign-born population - Other Northern Africa (%)
Place of birth for the foreign-born population - South Africa (%)
Place of birth for the foreign-born population - Other Southern Africa (%)
Place of birth for the foreign-born population - Cabo Verde (%)
Place of birth for the foreign-born population - Ghana (%)
Place of birth for the foreign-born population - Liberia (%)
Place of birth for the foreign-born population - Nigeria (%)
Place of birth for the foreign-born population - Senegal (%)
Place of birth for the foreign-born population - Sierra Leone (%)
Place of birth for the foreign-born population - Other Western Africa (%)
Place of birth for the foreign-born population - Australia (%)
Place of birth for the foreign-born population - New Zealand (%)
Place of birth for the foreign-born population - Fiji (%)
Place of birth for the foreign-born population - Micronesia (%)
Place of birth for the foreign-born population - Bahamas (%)
Place of birth for the foreign-born population - Barbados (%)
Place of birth for the foreign-born population - Cuba (%)
Place of birth for the foreign-born population - Dominica (%)
Place of birth for the foreign-born population - Dominican Republic (%)
Place of birth for the foreign-born population - Grenada (%)
Place of birth for the foreign-born population - Haiti (%)
Place of birth for the foreign-born population - Jamaica (%)
Place of birth for the foreign-born population - St. Vincent and the Grenadines (%)
Place of birth for the foreign-born population - Trinidad and Tobago (%)
Place of birth for the foreign-born population - West Indies (%)
Place of birth for the foreign-born population - Other Caribbean (%)
Place of birth for the foreign-born population - Belize (%)
Place of birth for the foreign-born population - Costa Rica (%)
Place of birth for the foreign-born population - El Salvador (%)
Place of birth for the foreign-born population - Guatemala (%)
Place of birth for the foreign-born population - Honduras (%)
Place of birth for the foreign-born population - Mexico (%)
Place of birth for the foreign-born population - Nicaragua (%)
Place of birth for the foreign-born population - Panama (%)
Place of birth for the foreign-born population - Other Central America (%)
Place of birth for the foreign-born population - Argentina (%)
Place of birth for the foreign-born population - Bolivia (%)
Place of birth for the foreign-born population - Brazil (%)
Place of birth for the foreign-born population - Chile (%)
Place of birth for the foreign-born population - Colombia (%)
Place of birth for the foreign-born population - Ecuador (%)
Place of birth for the foreign-born population - Guyana (%)
Place of birth for the foreign-born population - Peru (%)
Place of birth for the foreign-born population - Uruguay (%)
Place of birth for the foreign-born population - Venezuela (%)
Place of birth for the foreign-born population - Other South America (%)
Place of birth for the foreign-born population - Canada (%)
Place of birth for the foreign-born population - Other Northern America (%)
Place of birth for the foreign-born population - Other (%)
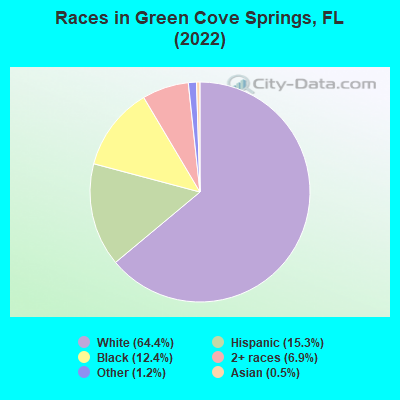
According to 2022 data, the most numerous races in Green Cove Springs, FL are White alone (6,478 residents), Hispanic (1,538 residents), and Black alone (1,245 residents). 93.9% of Green Cove Springs residents speak English at home. 4.3% of Green Cove Springs, FL residents are foreign-born (2.3% born in Latin America, 1.2% born in Europe, 0.6% born in Asia), which is 391.6% less than the foreign-born rate of 21.0% across the entire state of Florida.
Race distribution in Green Cove Springs
2000 2022
10,458,509 65.4% White alone 2,682,715 16.8% Hispanic 2,264,268 14.2% Black alone 261,693 1.6% Asian alone 236,954 1.5% Two or more races 42,358 0.3% American Indian alone 28,994 0.2% Other race alone 6,887 0.04% Native Hawaiian and Other
11,309,403 50.8% White alone 6,025,039 27.1% Hispanic 3,241,015 14.6% Black alone 861,630 3.9% Two or more races 623,692 2.8% Asian alone 152,054 0.7% Other race alone 22,504 0.1% American Indian alone 9,486 0.04% Native Hawaiian and Other
Income and house value in Green Cove Springs Median household income in 2022 $70,091 White non-Hispanic householders$58,681 Black householders$58,068 Two or more races householders$106,371 Hispanic or Latino race householdersMedian 2022 house value $317,130 White Non-Hispanic householders$169,721 Black or African American householders$237,756 American Indian or Alaska Native householders $823,002 Asian householders$219,467 Some other race householders$274,334 Two or more races householders$258,971 Hispanic or Latino householders
Median age by race in Green Cove Springs
43.3 Median age for White residents41.0 47.7 27.0 Median age for Black or African American residents27.3 26.6 -665,028,664.4 Median age for American Indian / Alaska Native residents-673,283,704.9 -594,925,633.7 45.1 Median age for Asian residents10.3 77.1 -679,849,340.2 Median age for Native Hawaiian / Pacific Islander residents-666,666,666.0 -666,666,666.0 43.1 Median age for Other race residents35.7 25.7 41.5 Median age for Two or more races residents44.2 49.4 46.6 Median age for White alone residents43.6 50.4 33.0 Median age for Hispanic or Latino residents31.8 31.6
Owner/renter occupied households by race in Green Cove Springs
House owners and renters - White residents 2,227 80.7% Owner occupied532 19.3% Renter occupiedHouse owners and renters - Black or African American residents 180 51.5% Owner occupied170 48.5% Renter occupiedHouse owners and renters - Asian residents 19 100.0% Owner occupiedHouse owners and renters - Other race residents 105 71.1% Owner occupied43 28.9% Renter occupiedHouse owners and renters - Two or more races residents 411 75.8% Owner occupied131 24.2% Renter occupiedHouse owners and renters - White alone residents 2,137 83.0% Owner occupied439 17.0% Renter occupiedHouse owners and renters - Hispanic or Latino residents 297 58.9% Owner occupied207 41.1% Renter occupied
Language usage in Green Cove Springs
English speakers - Total 93.9% of residents of Green Cove Springs speak English at home.
4.5% of residents speak Spanish at home 347 81.6% Speak English very well78 18.4% Speak English less than very well2.0% of residents speak other language at home 86 44.8% Speak English very well106 55.2% Speak English less than very well
English speakers - Born in the United States 97.7% of residents of Green Cove Springs speak English at home.
2.6% of residents speak Spanish at home 119 100.0% Speak English very well0.2% of residents speak other language at home 7 100.0% Speak English very well
English speakers - Native, born elsewhere 94.5% of residents of Green Cove Springs speak English at home.
20.5% of residents speak Spanish at home 32 45.1% Speak English very well39 54.9% Speak English less than very well
English speakers - Foreign-born 43.0% of residents of Green Cove Springs speak English at home.
20.4% of residents speak Spanish at home 76 88.4% Speak English very well10 11.6% Speak English less than very well37.3% of residents speak other language at home 66 42.0% Speak English very well91 58.0% Speak English less than very well
White (Caucasian) - Speak another language Native:
2.2% (139)Foreign-born:
97.4% (222)
Black or African American - Speak only English Native:
99.8% (1,134)Foreign-born:
35.3% (4)
Asian - Speak another language Native:
100.0% (9)Foreign-born:
52.3% (18)
Other race - Speak only English Native:
100.0% (429)Foreign-born:
89.8% (60)
Two or more races - Speak only English Native:
82.4% (970)Foreign-born:
100.0% (95)
Two or more races - Speak another language Native:
17.6% (207)Foreign-born:
24.4% (23)
White alone - Speak another language Native:
0.8% (50)Foreign-born:
100.0% (166)
Hispanic or Latino - Speak only English Native:
83.1% (1,090)Foreign-born:
51.3% (70)
Hispanic or Latino - Speak another language Native:
22.3% (293)Foreign-born:
69.5% (95)
Foreign-born residents in Green Cove Springs 430 residents are foreign born (2.3% Latin America , 1.2% Europe , 0.6% Asia ).
This city:
4.3%Florida:
21.1%
Marital status for residents in Green Cove Springs Marital status - White (Caucasian) population 15 years and over
Males 25.7% Never married52.0% Now married1.4% Separated1.6% Widowed19.3% DivorcedFemales 18.3% Never married53.3% Now married4.4% Separated12.0% Widowed12.0% DivorcedWomen who gave birth in the past 12 months Now married:
10.8% (8)Unmarried:
89.2% (65)
Women who did not give birth in the past 12 months Now married:
54.8% (614)Unmarried:
45.2% (507)
Marital status - Black or African American population 15 years and over
Males 77.1% Never married12.7% Now married0.0% Separated6.8% Widowed3.4% DivorcedFemales 59.4% Never married8.3% Now married1.2% Separated10.3% Widowed20.9% DivorcedWomen who did not give birth in the past 12 months Now married:
8.0% (24)Unmarried:
92.0% (273)
Marital status - Asian population 15 years and over
Males 0.0% Never married100.0% Now married0.0% Separated0.0% Widowed0.0% DivorcedFemales 0.0% Never married77.8% Now married0.0% Separated0.0% Widowed22.2% DivorcedWomen who did not give birth in the past 12 months Now married:
100.0% (6)Unmarried:
0.0% (0)
Marital status - Other race population 15 years and over
Males 84.2% Never married0.0% Now married0.0% Separated0.0% Widowed15.8% DivorcedFemales 64.3% Never married5.2% Now married0.0% Separated0.0% Widowed30.5% DivorcedWomen who did not give birth in the past 12 months Now married:
0.0% (0)Unmarried:
100.0% (285)
Marital status - Two or more races population 15 years and over
Males 51.6% Never married34.7% Now married0.0% Separated0.0% Widowed13.7% DivorcedFemales 28.3% Never married47.1% Now married13.4% Separated9.1% Widowed2.1% DivorcedWomen who gave birth in the past 12 months Now married:
73.8% (80)Unmarried:
26.2% (28)
Women who did not give birth in the past 12 months Now married:
59.4% (217)Unmarried:
40.6% (149)
Marital status - White alone, not Hispanic / Latino population 15 years and over
Males 25.0% Never married53.2% Now married1.5% Separated1.8% Widowed18.5% DivorcedFemales 18.0% Never married53.6% Now married4.7% Separated12.7% Widowed11.0% DivorcedWomen who gave birth in the past 12 months Now married:
10.8% (8)Unmarried:
89.2% (66)
Women who did not give birth in the past 12 months Now married:
57.8% (589)Unmarried:
42.2% (430)
Marital status - Hispanic or Latino population 15 years and over
Males 54.6% Never married26.1% Now married0.0% Separated0.0% Widowed19.4% DivorcedFemales 39.1% Never married41.4% Now married0.0% Separated0.0% Widowed19.5% DivorcedWomen who gave birth in the past 12 months Now married:
100.0% (49)Unmarried:
0.0% (0)
Women who did not give birth in the past 12 months Now married:
22.0% (74)Unmarried:
78.0% (263)
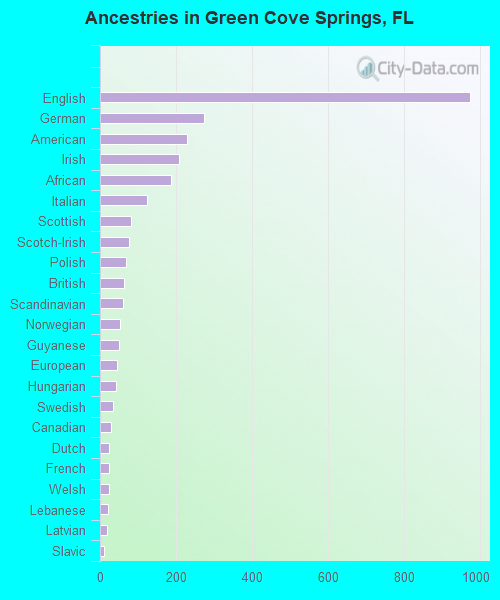
Ancestries in Green Cove Springs
975 22.9% English275 6.5% German230 5.4% American207 4.9% Irish188 4.4% African124 2.9% Italian82 1.9% Scottish77 1.8% Scotch-Irish68 1.6% Polish64 1.5% British61 1.4% Scandinavian53 1.2% Norwegian49 1.2% Guyanese46 1.1% European41 1.0% Hungarian35 0.8% Swedish30 0.7% Canadian25 0.6% Dutch25 0.6% French25 0.6% Welsh20 0.5% Lebanese18 0.4% Latvian10 0.2% Slavic8 0.2% Armenian7 0.2% Nigerian4 0.09% Haitian
Children Nativity (place of birth) in Green Cove Springs
Children under 6 years - Living with two parents Both parents native 355 100.0% NativeBoth parents foreign-born 26 100.0% NativeOne native, one foreign-born parent 12 100.0% NativeChildren under 6 years - Living with one parent Native parent 332 100.0% NativeForeign-born parent 20 100.0% NativeChildren 6 to 17 years - Living with two parents Both parents native 566 100.0% NativeBoth parents foreign-born 12 100.0% NativeChildren 6 to 17 years - Living with one parent Native parent 335 100.0% NativeForeign-born parent 182 50.6% Native178 49.4% Foreign-born
Grandparents responsible for own grandchildren in Green Cove Springs
Grandparents (30 to 59 years) White / Caucasian 9 100.0% Responsible for grandchildrenOther race 16 100.0% Not responsible for grandchildrenTwo or more races 20 100.0% Not responsible for grandchildrenWhite alone, not Hispanic / Latino 4 100.0% Responsible for grandchildrenHispanic or Latino 10 100.0% Responsible for grandchildrenGrandparents (60 years and over) White / Caucasian 32 25.2% Responsible for grandchildren95 74.8% Not responsible for grandchildrenTwo or more races 34 100.0% Not responsible for grandchildrenWhite alone, not Hispanic / Latino 32 24.5% Responsible for grandchildren98 75.5% Not responsible for grandchildren