Races in Grants, New Mexico (NM) Detailed Stats
Ancestries, Foreign-born residents, place of birth
Settings
X


Recent posts about races in Grants, New Mexico on our local forum with over 2,400,000 registered users:
 | Is March a nice time to visit? (61 replies) |
| Why does New Mexico have a bad reputation? (395 replies) |
| Gallup or Farmington? (2 replies) |
| Grants, NM... (32 replies) |
| Opinions on Gallup? (44 replies) |
| Needing info on Silver City, Grants, rural New Mexico (10 replies) |
Latest news about races in Grants, NM collected exclusively by city-data.com from local newspapers, TV, and radio stations
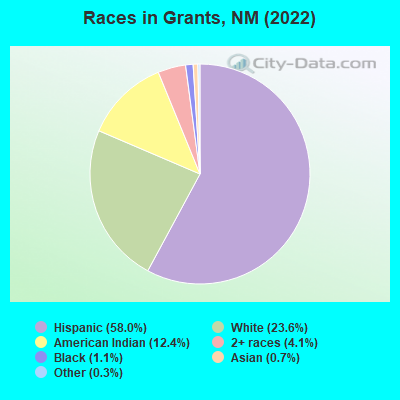
According to 2022 data, the most numerous races in Grants, NM are Hispanic (5,327 residents), White alone (2,166 residents), and American Indian alone (1,142 residents). 56.1% of Grants residents speak English at home. 7.3% of Grants, NM residents are foreign-born (6.4% born in Latin America), which is 22.6% less than the foreign-born rate of 9.0% across the entire state of New Mexico.
Race distribution in Grants
2000
2022

- 4,61152.4%Hispanic
- 2,86332.5%White alone
- 97211.0%American Indian alone
- 1381.6%Black alone
- 1141.3%Two or more races
- 790.9%Asian alone
- 250.3%Other race alone
- 40.05%Native Hawaiian and Other
Pacific Islander alone

-
- 5,32758.0%Hispanic
- 2,16623.6%White alone
- 1,14212.4%American Indian alone
- 3754.1%Two or more races
- 1041.1%Black alone
- 620.7%Asian alone
- 230.3%Other race alone
- 40.04%Native Hawaiian and Other
Pacific Islander alone
2000
2022
-
- 813,49544.7%White alone
- 765,38642.1%Hispanic
- 161,4608.9%American Indian alone
- 30,6541.7%Black alone
- 25,7931.4%Two or more races
- 18,2571.0%Asian alone
- 3,0090.2%Other race alone
- 9920.05%Native Hawaiian and Other
Pacific Islander alone

-
- 1,059,86750.2%Hispanic
- 735,47834.8%White alone
- 171,8088.1%American Indian alone
- 65,0843.1%Two or more races
- 36,8701.7%Black alone
- 35,8701.7%Asian alone
- 7,5820.4%Other race alone
- 7850.04%Native Hawaiian and Other
Pacific Islander alone

Income and house value in Grants
- Median household income in 2022
- $69,851White non-Hispanic householders
- $43,822American Indian and Alaska Native householders
- $57,605Two or more races householders
- $52,019Hispanic or Latino race householders
- Median 2022 house value
- $169,756White Non-Hispanic householders
- $164,689Black or African American householders
- $114,015American Indian or Alaska Native householders
- $195,346Asian householders
- $156,581Some other race householders
- $99,320Two or more races householders
- $155,567Hispanic or Latino householders
Household income for White non-Hispanic householders

Household income for Black householders

Household income for American Indian and Alaska Native householders

Household income for Some other race householders

Household income for Two or more races householders

Household income for Hispanic or Latino race householders

Median age by race in Grants
- 35.8Median age for White residents
- 39.1Males
- 35.4Females
- 37.3Median age for Black or African American residents
- 36.3Males
- 61.1Females
- 28.5Median age for American Indian / Alaska Native residents
- 28.6Males
- 28.5Females
- 36.9Median age for Asian residents
- -687,619,046.9Males
- -661,512,026.8Females
- -658,511,722.1Median age for Native Hawaiian / Pacific Islander residents
- -685,897,435.2Males
- -659,380,691.5Females
- 41.7Median age for Other race residents
- 38.9Males
- 56.1Females
- 32.4Median age for Two or more races residents
- 36.4Males
- 32.1Females
- 38.2Median age for White alone residents
- 37.3Males
- 40.9Females
- 33.0Median age for Hispanic or Latino residents
- 39.1Males
- 30.1Females
Owner/renter occupied households by race in Grants
- House owners and renters - White residents
- 1,11768.6%Owner occupied
- 51231.4%Renter occupied
- House owners and renters - Black or African American residents
- 1740.1%Owner occupied
- 2559.9%Renter occupied
- House owners and renters - American Indian / Alaska Native residents
- 10627.7%Owner occupied
- 27772.3%Renter occupied
- House owners and renters - Asian residents
- 4100.0%Renter occupied
- House owners and renters - Other race residents
- 36583.1%Owner occupied
- 7416.9%Renter occupied
- House owners and renters - Two or more races residents
- 29161.4%Owner occupied
- 18338.6%Renter occupied
- House owners and renters - White alone residents
- 49456.7%Owner occupied
- 37743.3%Renter occupied
- House owners and renters - Hispanic or Latino residents
- 1,30576.1%Owner occupied
- 41123.9%Renter occupied
Language usage in Grants
- English speakers - Total
- 56.1% of residents of Grants speak English at home.
- 37.0% of residents speak Spanish at home
- 2,05565.1%Speak English very well
- 1,10134.9%Speak English less than very well
- 6.5% of residents speak other language at home
- 50490.6%Speak English very well
- 529.4%Speak English less than very well
- English speakers - Born in the United States
- 74.2% of residents of Grants speak English at home.
- 19.9% of residents speak Spanish at home
- 37678.7%Speak English very well
- 10221.3%Speak English less than very well
- 5.6% of residents speak other language at home
- 135100.0%Speak English very well
All residents speak only English at home
- English speakers - Foreign-born
- 1.9% of residents of Grants speak English at home.
- 83.7% of residents speak Spanish at home
- 16729.9%Speak English very well
- 39270.1%Speak English less than very well
- 11.7% of residents speak other language at home
- 7191.0%Speak English very well
- 79.0%Speak English less than very well
White (Caucasian) - Speak another language
| Native: | 23.4% (890) |
| Foreign-born: | 100.0% (163) |
Black or African American - Speak another language
| Native: | 5.4% (8) |
| Foreign-born: | 76.6% (5) |
American Indian / Alaska Native - Speak only English
| Native: | 67.3% (782) |
| Foreign-born: | 67.6% (5) |
Other race - Speak another language
| Native: | 57.8% (550) |
| Foreign-born: | 98.8% (130) |
Two or more races - Speak another language
| Native: | 40.1% (697) |
| Foreign-born: | 98.0% (147) |
White alone - Speak another language
| Native: | 2.1% (40) |
| Foreign-born: | 94.6% (10) |
Hispanic or Latino - Speak only English
| Native: | 42.5% (1,921) |
| Foreign-born: | 1.2% (7) |
Hispanic or Latino - Speak another language
| Native: | 56.9% (2,576) |
| Foreign-born: | 96.0% (557) |
Foreign-born residents in Grants
674 residents are foreign born (6.4% Latin America).
| This city: | 7.3% |
| New Mexico: | 9.2% |


Marital status for residents in Grants
Marital status - White (Caucasian) population 15 years and over
- Males
- 27.0%Never married
- 47.7%Now married
- 9.7%Separated
- 5.0%Widowed
- 10.5%Divorced
- Females
- 31.8%Never married
- 43.2%Now married
- 0.9%Separated
- 7.3%Widowed
- 16.7%Divorced
Women who gave birth in the past 12 months
| Now married: | 44.4% (42) |
| Unmarried: | 55.6% (53) |
Women who did not give birth in the past 12 months
| Now married: | 28.2% (177) |
| Unmarried: | 71.8% (451) |
Marital status - Black or African American population 15 years and over
- Males
- 59.8%Never married
- 18.0%Now married
- 0.0%Separated
- 14.8%Widowed
- 7.4%Divorced
- Females
- 25.0%Never married
- 15.6%Now married
- 0.0%Separated
- 59.4%Widowed
- 0.0%Divorced
Women who did not give birth in the past 12 months
| Now married: | 0.0% (0) |
| Unmarried: | 100.0% (8) |
Marital status - American Indian / Alaska Native population 15 years and over
- Males
- 44.5%Never married
- 26.0%Now married
- 0.0%Separated
- 7.4%Widowed
- 22.1%Divorced
- Females
- 48.3%Never married
- 27.0%Now married
- 7.2%Separated
- 1.0%Widowed
- 16.5%Divorced
Women who gave birth in the past 12 months
| Now married: | 0.0% (0) |
| Unmarried: | 100.0% (21) |
Women who did not give birth in the past 12 months
| Now married: | 30.4% (89) |
| Unmarried: | 69.6% (203) |
Marital status - Asian population 15 years and over
- Males
- 0.0%Never married
- 100.0%Now married
- 0.0%Separated
- 0.0%Widowed
- 0.0%Divorced
- Females
- 0.0%Never married
- 100.0%Now married
- 0.0%Separated
- 0.0%Widowed
- 0.0%Divorced
Women who did not give birth in the past 12 months
| Now married: | 100.0% (57) |
| Unmarried: | 0.0% (0) |
Marital status - Other race population 15 years and over
- Males
- 44.5%Never married
- 27.2%Now married
- 1.1%Separated
- 3.3%Widowed
- 23.8%Divorced
- Females
- 17.0%Never married
- 39.5%Now married
- 0.0%Separated
- 14.8%Widowed
- 28.8%Divorced
Women who gave birth in the past 12 months
| Now married: | 0.0% (0) |
| Unmarried: | 100.0% (17) |
Women who did not give birth in the past 12 months
| Now married: | 65.3% (71) |
| Unmarried: | 34.7% (38) |
Marital status - Two or more races population 15 years and over
- Males
- 38.9%Never married
- 43.8%Now married
- 1.6%Separated
- 0.0%Widowed
- 15.7%Divorced
- Females
- 24.7%Never married
- 60.2%Now married
- 6.8%Separated
- 1.1%Widowed
- 7.1%Divorced
Women who gave birth in the past 12 months
| Now married: | 100.0% (53) |
| Unmarried: | 0.0% (0) |
Women who did not give birth in the past 12 months
| Now married: | 65.2% (467) |
| Unmarried: | 34.8% (249) |
Marital status - White alone, not Hispanic / Latino population 15 years and over
- Males
- 24.2%Never married
- 53.8%Now married
- 0.9%Separated
- 1.1%Widowed
- 20.0%Divorced
- Females
- 29.3%Never married
- 40.7%Now married
- 0.0%Separated
- 7.2%Widowed
- 22.8%Divorced
Women who gave birth in the past 12 months
| Now married: | 31.6% (24) |
| Unmarried: | 68.4% (53) |
Women who did not give birth in the past 12 months
| Now married: | 30.8% (135) |
| Unmarried: | 69.2% (304) |
Marital status - Hispanic or Latino population 15 years and over
- Males
- 34.1%Never married
- 41.2%Now married
- 9.4%Separated
- 5.0%Widowed
- 10.4%Divorced
- Females
- 28.4%Never married
- 51.0%Now married
- 1.7%Separated
- 6.4%Widowed
- 12.4%Divorced
Women who gave birth in the past 12 months
| Now married: | 70.2% (67) |
| Unmarried: | 29.8% (28) |
Women who did not give birth in the past 12 months
| Now married: | 46.7% (403) |
| Unmarried: | 53.3% (460) |
Ancestries in Grants

- 1372.3%European
- 981.6%German
- 841.4%English
- 761.3%Irish
- 591.0%Scottish
- 550.9%American
- 420.7%Eastern European
- 350.6%Greek
- 270.4%Italian
- 250.4%Lebanese
- 120.2%Slavic
- 110.2%Norwegian
- 100.2%Canadian
- 100.2%Welsh
- 90.1%Portuguese
- 80.1%Haitian
- 60.10%Scotch-Irish
- 60.10%Swedish
- 20.03%British
- 20.03%Russian

Geographical mobility in Grants

- Same house 1 year ago
- 3,65486.4%White (Caucasian)
- 11272.6%Black or African American
- 65150.9%American Indian / Alaska Native
- 5281.4%Asian
- 6100.0%Native Hawaiian / Pacific Islander
- 92883.2%Other race
- 1,38369.2%Two or more races
- 1,54772.5%White alone, not Hispanic / Latino
- 4,68288.9%Hispanic or Latino

-
- Moved within same county
- 1202.8%White / Caucasian
- 1912.4%Black or African American
- 745.8%American Indian / Alaska Native
- 20810.4%Two or more races
- 1085.1%White alone, not Hispanic / Latino
- 1552.9%Hispanic or Latino

-
- Moved within same state
- 2135.0%White / Caucasian
- 3421.7%Black or African American
- 64950.8%American Indian / Alaska Native
- 711.3%Asian
- 766.9%Other race
- 35617.8%Two or more races
- 2069.7%White alone, not Hispanic / Latino
- 2795.3%Hispanic or Latino

-
- Moved from different state
- 2255.3%White / Caucasian
- 70.5%American Indian / Alaska Native
- 69.3%Asian
- 857.6%Other race
- 22010.3%White alone, not Hispanic / Latino
- 1011.9%Hispanic or Latino

-
- Moved from abroad
- 60.1%White
- 582.9%Two or more races
- 80.4%White alone, not Hispanic / Latino
- 360.7%Hispanic or Latino

Children Nativity (place of birth) in Grants
Place of birth for residents in Grants
![Place of birth for the foreign-born population - Regions]()
- 600Americas
- 600Latin America
- 585Central America
- 57Asia
- 57South Eastern Asia
- 15Caribbean
- 10Europe
- 10Southern Europe
- 6Oceania

![Place of birth for the foreign-born population - Countries]()
- 541Mexico
- 44Vietnam
- 43Honduras
- 12Philippines
- 10Portugal
- 10Azores Islands
- 8Haiti
- 7Cuba
- 6Micronesia

Grandparents responsible for own grandchildren in Grants
Zip codes: 87021.