Races in Goldenrod, Florida (FL) Detailed Stats
Data:
Races - White alone (%)
Races - White alone (% change since 2000)
Races - Black alone (%)
Races - Black alone (% change since 2000)
Races - American Indian alone (%)
Races - American Indian alone (% change since 2000)
Races - Asian alone (%)
Races - Asian alone (% change since 2000)
Races - Hispanic (%)
Races - Hispanic (% change since 2000)
Races - Native Hawaiian and Other Pacific Islander alone (%)
Races - Native Hawaiian and Other Pacific Islander alone (% change since 2000)
Races - Two or more races(%)
Races - Two or more races(% change since 2000)
Races - Other race alone (%)
Races - Other race alone (% change since 2000)
Racial diversity
Place of birth - Born in state of residence (%)
Place of birth - Born in state of residence (%) - White
Place of birth - Born in state of residence (%) - Black or African American
Place of birth - Born in state of residence (%) - Asian
Place of birth - Born in state of residence (%) - Hispanic or Latino
Place of birth - Born in state of residence (%) - American Indian and Alaska Native
Place of birth - Born in state of residence (%) - Multirace
Place of birth - Born in state of residence (%) - Other Race
Place of birth - Born in other state (%)
Place of birth - Born in other state (%) - White
Place of birth - Born in other state (%) - Black or African American
Place of birth - Born in other state (%) - Asian
Place of birth - Born in other state (%) - Hispanic or Latino
Place of birth - Born in other state (%) - American Indian and Alaska Native
Place of birth - Born in other state (%) - Multirace
Place of birth - Born in other state (%) - Other Race
Place of birth - Native, outside of US (%)
Place of birth - Native, outside of US (%) - White
Place of birth - Native, outside of US (%) - Black or African American
Place of birth - Native, outside of US (%) - Asian
Place of birth - Native, outside of US (%) - Hispanic or Latino
Place of birth - Native, outside of US (%) - American Indian and Alaska Native
Place of birth - Native, outside of US (%) - Multirace
Place of birth - Native, outside of US (%) - Other Race
Place of birth - Foreign born (%)
Place of birth - Foreign born (%) - White
Place of birth - Foreign born (%) - Black or African American
Place of birth - Foreign born (%) - Asian
Place of birth - Foreign born (%) - Hispanic or Latino
Place of birth - Foreign born (%) - American Indian and Alaska Native
Place of birth - Foreign born (%) - Multirace
Place of birth - Foreign born (%) - Other Race
Residents speaking English at home (%)
Residents speaking English at home - Born in the United States (%)
Residents speaking English at home - Native, born elsewhere (%)
Residents speaking English at home - Foreign born (%)
Residents speaking Spanish at home (%)
Residents speaking Spanish at home - Born in the United States (%)
Residents speaking Spanish at home - Native, born elsewhere (%)
Residents speaking Spanish at home - Foreign born (%)
Residents speaking other language at home (%)
Residents speaking other language at home - Born in the United States (%)
Residents speaking other language at home - Native, born elsewhere (%)
Residents speaking other language at home - Foreign born (%)
Marital status - Never married (%)
Marital status - Now married (%)
Marital status - Separated (%)
Marital status - Widowed (%)
Marital status - Divorced (%)
Ancestries Reported - Arab (%)
Ancestries Reported - Czech (%)
Ancestries Reported - Danish (%)
Ancestries Reported - Dutch (%)
Ancestries Reported - English (%)
Ancestries Reported - French (%)
Ancestries Reported - French Canadian (%)
Ancestries Reported - German (%)
Ancestries Reported - Greek (%)
Ancestries Reported - Hungarian (%)
Ancestries Reported - Irish (%)
Ancestries Reported - Italian (%)
Ancestries Reported - Lithuanian (%)
Ancestries Reported - Norwegian (%)
Ancestries Reported - Polish (%)
Ancestries Reported - Portuguese (%)
Ancestries Reported - Russian (%)
Ancestries Reported - Scotch-Irish (%)
Ancestries Reported - Scottish (%)
Ancestries Reported - Slovak (%)
Ancestries Reported - Subsaharan African (%)
Ancestries Reported - Swedish (%)
Ancestries Reported - Swiss (%)
Ancestries Reported - Ukrainian (%)
Ancestries Reported - United States (%)
Ancestries Reported - Welsh (%)
Ancestries Reported - West Indian (%)
Ancestries Reported - Other (%)
Geographical mobility - Same house 1 year ago (%)
Geographical mobility - Same house 1 year ago (%) - White
Geographical mobility - Same house 1 year ago (%) - Black or African American
Geographical mobility - Same house 1 year ago (%) - Asian
Geographical mobility - Same house 1 year ago (%) - Hispanic or Latino
Geographical mobility - Same house 1 year ago (%) - American Indian and Alaska Native
Geographical mobility - Same house 1 year ago (%) - Multirace
Geographical mobility - Same house 1 year ago (%) - Other Race
Geographical mobility - Moved within same county (%)
Geographical mobility - Moved within same county (%) - White
Geographical mobility - Moved within same county (%) - Black or African American
Geographical mobility - Moved within same county (%) - Asian
Geographical mobility - Moved within same county (%) - Hispanic or Latino
Geographical mobility - Moved within same county (%) - American Indian and Alaska Native
Geographical mobility - Moved within same county (%) - Multirace
Geographical mobility - Moved within same county (%) - Other Race
Geographical mobility - Moved from different county within same state (%)
Geographical mobility - Moved from different county within same state (%) - White
Geographical mobility - Moved from different county within same state (%) - Black or African American
Geographical mobility - Moved from different county within same state (%) - Asian
Geographical mobility - Moved from different county within same state (%) - Hispanic or Latino
Geographical mobility - Moved from different county within same state (%) - American Indian and Alaska Native
Geographical mobility - Moved from different county within same state (%) - Multirace
Geographical mobility - Moved from different county within same state (%) - Other Race
Geographical mobility - Moved from different state (%)
Geographical mobility - Moved from different state (%) - White
Geographical mobility - Moved from different state (%) - Black or African American
Geographical mobility - Moved from different state (%) - Asian
Geographical mobility - Moved from different state (%) - Hispanic or Latino
Geographical mobility - Moved from different state (%) - American Indian and Alaska Native
Geographical mobility - Moved from different state (%) - Multirace
Geographical mobility - Moved from different state (%) - Other Race
Geographical mobility - Moved from abroad (%)
Geographical mobility - Moved from abroad (%) - White
Geographical mobility - Moved from abroad (%) - Black or African American
Geographical mobility - Moved from abroad (%) - Asian
Geographical mobility - Moved from abroad (%) - Hispanic or Latino
Geographical mobility - Moved from abroad (%) - American Indian and Alaska Native
Geographical mobility - Moved from abroad (%) - Multirace
Geographical mobility - Moved from abroad (%) - Other Race
Place of birth for the foreign-born population - Ireland (%)
Place of birth for the foreign-born population - Denmark (%)
Place of birth for the foreign-born population - Norway (%)
Place of birth for the foreign-born population - Sweden (%)
Place of birth for the foreign-born population - United Kingdom (%)
Place of birth for the foreign-born population - England (%)
Place of birth for the foreign-born population - Scotland (%)
Place of birth for the foreign-born population - Other Northern Europe (%)
Place of birth for the foreign-born population - Austria (%)
Place of birth for the foreign-born population - Belgium (%)
Place of birth for the foreign-born population - France (%)
Place of birth for the foreign-born population - Germany (%)
Place of birth for the foreign-born population - Netherlands (%)
Place of birth for the foreign-born population - Switzerland (%)
Place of birth for the foreign-born population - Other Western Europe (%)
Place of birth for the foreign-born population - Greece (%)
Place of birth for the foreign-born population - Italy (%)
Place of birth for the foreign-born population - Portugal (%)
Place of birth for the foreign-born population - Spain (%)
Place of birth for the foreign-born population - Other Southern Europe (%)
Place of birth for the foreign-born population - Albania (%)
Place of birth for the foreign-born population - Belarus (%)
Place of birth for the foreign-born population - Bosnia and Herzegovina (%)
Place of birth for the foreign-born population - Bulgaria (%)
Place of birth for the foreign-born population - Croatia (%)
Place of birth for the foreign-born population - Czechoslovakia (%)
Place of birth for the foreign-born population - Hungary (%)
Place of birth for the foreign-born population - Latvia (%)
Place of birth for the foreign-born population - Lithuania (%)
Place of birth for the foreign-born population - North Macedonia (Macedonia) (%)
Place of birth for the foreign-born population - Moldova (%)
Place of birth for the foreign-born population - Poland (%)
Place of birth for the foreign-born population - Romania (%)
Place of birth for the foreign-born population - Russia (%)
Place of birth for the foreign-born population - Serbia (%)
Place of birth for the foreign-born population - Ukraine (%)
Place of birth for the foreign-born population - Other Eastern Europe (%)
Place of birth for the foreign-born population - China (%)
Place of birth for the foreign-born population - Hong Kong (%)
Place of birth for the foreign-born population - Taiwan (%)
Place of birth for the foreign-born population - Japan (%)
Place of birth for the foreign-born population - Korea (%)
Place of birth for the foreign-born population - Other Eastern Asia (%)
Place of birth for the foreign-born population - Afghanistan (%)
Place of birth for the foreign-born population - Bangladesh (%)
Place of birth for the foreign-born population - India (%)
Place of birth for the foreign-born population - Iran (%)
Place of birth for the foreign-born population - Kazakhstan (%)
Place of birth for the foreign-born population - Nepal (%)
Place of birth for the foreign-born population - Pakistan (%)
Place of birth for the foreign-born population - Sri Lanka (%)
Place of birth for the foreign-born population - Uzbekistan (%)
Place of birth for the foreign-born population - Other South Central Asia (%)
Place of birth for the foreign-born population - Burma (%)
Place of birth for the foreign-born population - Cambodia (%)
Place of birth for the foreign-born population - Indonesia (%)
Place of birth for the foreign-born population - Laos (%)
Place of birth for the foreign-born population - Malaysia (%)
Place of birth for the foreign-born population - Philippines (%)
Place of birth for the foreign-born population - Singapore (%)
Place of birth for the foreign-born population - Thailand (%)
Place of birth for the foreign-born population - Vietnam (%)
Place of birth for the foreign-born population - Other South Eastern Asia (%)
Place of birth for the foreign-born population - Armenia (%)
Place of birth for the foreign-born population - Iraq (%)
Place of birth for the foreign-born population - Israel (%)
Place of birth for the foreign-born population - Jordan (%)
Place of birth for the foreign-born population - Kuwait (%)
Place of birth for the foreign-born population - Lebanon (%)
Place of birth for the foreign-born population - Saudi Arabia (%)
Place of birth for the foreign-born population - Syria (%)
Place of birth for the foreign-born population - Turkey (%)
Place of birth for the foreign-born population - Yemen (%)
Place of birth for the foreign-born population - Other Western Asia (%)
Place of birth for the foreign-born population - Eritrea (%)
Place of birth for the foreign-born population - Ethiopia (%)
Place of birth for the foreign-born population - Kenya (%)
Place of birth for the foreign-born population - Somalia (%)
Place of birth for the foreign-born population - Uganda (%)
Place of birth for the foreign-born population - Zimbabwe (%)
Place of birth for the foreign-born population - Other Eastern Africa (%)
Place of birth for the foreign-born population - Cameroon (%)
Place of birth for the foreign-born population - Congo (%)
Place of birth for the foreign-born population - Democratic Republic of Congo (Zaire) (%)
Place of birth for the foreign-born population - Other Middle Africa (%)
Place of birth for the foreign-born population - Egypt (%)
Place of birth for the foreign-born population - Morocco (%)
Place of birth for the foreign-born population - Sudan (%)
Place of birth for the foreign-born population - Other Northern Africa (%)
Place of birth for the foreign-born population - South Africa (%)
Place of birth for the foreign-born population - Other Southern Africa (%)
Place of birth for the foreign-born population - Cabo Verde (%)
Place of birth for the foreign-born population - Ghana (%)
Place of birth for the foreign-born population - Liberia (%)
Place of birth for the foreign-born population - Nigeria (%)
Place of birth for the foreign-born population - Senegal (%)
Place of birth for the foreign-born population - Sierra Leone (%)
Place of birth for the foreign-born population - Other Western Africa (%)
Place of birth for the foreign-born population - Australia (%)
Place of birth for the foreign-born population - New Zealand (%)
Place of birth for the foreign-born population - Fiji (%)
Place of birth for the foreign-born population - Micronesia (%)
Place of birth for the foreign-born population - Bahamas (%)
Place of birth for the foreign-born population - Barbados (%)
Place of birth for the foreign-born population - Cuba (%)
Place of birth for the foreign-born population - Dominica (%)
Place of birth for the foreign-born population - Dominican Republic (%)
Place of birth for the foreign-born population - Grenada (%)
Place of birth for the foreign-born population - Haiti (%)
Place of birth for the foreign-born population - Jamaica (%)
Place of birth for the foreign-born population - St. Vincent and the Grenadines (%)
Place of birth for the foreign-born population - Trinidad and Tobago (%)
Place of birth for the foreign-born population - West Indies (%)
Place of birth for the foreign-born population - Other Caribbean (%)
Place of birth for the foreign-born population - Belize (%)
Place of birth for the foreign-born population - Costa Rica (%)
Place of birth for the foreign-born population - El Salvador (%)
Place of birth for the foreign-born population - Guatemala (%)
Place of birth for the foreign-born population - Honduras (%)
Place of birth for the foreign-born population - Mexico (%)
Place of birth for the foreign-born population - Nicaragua (%)
Place of birth for the foreign-born population - Panama (%)
Place of birth for the foreign-born population - Other Central America (%)
Place of birth for the foreign-born population - Argentina (%)
Place of birth for the foreign-born population - Bolivia (%)
Place of birth for the foreign-born population - Brazil (%)
Place of birth for the foreign-born population - Chile (%)
Place of birth for the foreign-born population - Colombia (%)
Place of birth for the foreign-born population - Ecuador (%)
Place of birth for the foreign-born population - Guyana (%)
Place of birth for the foreign-born population - Peru (%)
Place of birth for the foreign-born population - Uruguay (%)
Place of birth for the foreign-born population - Venezuela (%)
Place of birth for the foreign-born population - Other South America (%)
Place of birth for the foreign-born population - Canada (%)
Place of birth for the foreign-born population - Other Northern America (%)
Place of birth for the foreign-born population - Other (%)
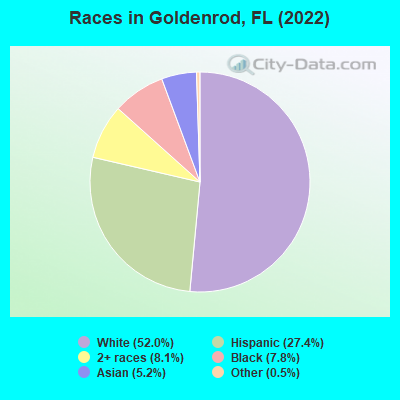
According to 2022 data, the most numerous races in Goldenrod, FL are White alone (6,598 residents), Hispanic (3,476 residents), and Black alone (986 residents). 72.7% of Goldenrod residents speak English at home. 14.1% of Goldenrod, FL residents are foreign-born (8.3% born in Latin America, 3.2% born in Asia, 1.9% born in Europe), which is 48.6% less than the foreign-born rate of 21.0% across the entire state of Florida.
Race distribution in Goldenrod
2000 2022
10,458,509 65.4% White alone 2,682,715 16.8% Hispanic 2,264,268 14.2% Black alone 261,693 1.6% Asian alone 236,954 1.5% Two or more races 42,358 0.3% American Indian alone 28,994 0.2% Other race alone 6,887 0.04% Native Hawaiian and Other
11,309,403 50.8% White alone 6,025,039 27.1% Hispanic 3,241,015 14.6% Black alone 861,630 3.9% Two or more races 623,692 2.8% Asian alone 152,054 0.7% Other race alone 22,504 0.1% American Indian alone 9,486 0.04% Native Hawaiian and Other
Income and house value in Goldenrod Median household income in 2022 $83,104 White non-Hispanic householders$38,408 Black householders$62,721 Some other race householders$70,129 Two or more races householders$47,489 Hispanic or Latino race householdersMedian 2022 house value $363,876 White Non-Hispanic householders$403,404 Black or African American householders $401,926 Asian householders$415,594 Some other race householders$341,341 Two or more races householders$369,417 Hispanic or Latino householders
Median age by race in Goldenrod
34.8 Median age for White residents34.5 35.1 24.8 Median age for Black or African American residents24.4 28.8 -544,061,302.1 Median age for American Indian / Alaska Native residents-541,955,349.7 -503,171,246.9 34.5 Median age for Asian residents34.6 41.9 -679,849,340.2 Median age for Native Hawaiian / Pacific Islander residents-858,307,848.3 -443,298,968.6 43.7 Median age for Other race residents28.6 48.9 28.8 Median age for Two or more races residents29.7 28.7 35.7 Median age for White alone residents35.9 36.1 30.9 Median age for Hispanic or Latino residents27.9 37.7
Owner/renter occupied households by race in Goldenrod
House owners and renters - White residents 1,877 55.9% Owner occupied1,480 44.1% Renter occupiedHouse owners and renters - Black or African American residents 53 9.0% Owner occupied534 91.0% Renter occupiedHouse owners and renters - Asian residents 114 37.8% Owner occupied188 62.2% Renter occupiedHouse owners and renters - Other race residents 140 38.5% Owner occupied224 61.5% Renter occupiedHouse owners and renters - Two or more races residents 468 54.4% Owner occupied393 45.6% Renter occupiedHouse owners and renters - White alone residents 1,819 59.8% Owner occupied1,224 40.2% Renter occupiedHouse owners and renters - Hispanic or Latino residents 478 36.8% Owner occupied820 63.2% Renter occupied
Language usage in Goldenrod
English speakers - Total 72.7% of residents of Goldenrod speak English at home.
19.5% of residents speak Spanish at home 1,721 72.8% Speak English very well644 27.2% Speak English less than very well7.2% of residents speak other language at home 711 81.6% Speak English very well160 18.4% Speak English less than very well
English speakers - Born in the United States 91.4% of residents of Goldenrod speak English at home.
6.6% of residents speak Spanish at home 299 82.1% Speak English very well65 17.9% Speak English less than very well1.8% of residents speak other language at home 100 100.0% Speak English very well
English speakers - Native, born elsewhere 19.3% of residents of Goldenrod speak English at home.
72.7% of residents speak Spanish at home 369 65.5% Speak English very well194 34.5% Speak English less than very well
English speakers - Foreign-born 18.6% of residents of Goldenrod speak English at home.
47.1% of residents speak Spanish at home 562 64.4% Speak English very well311 35.6% Speak English less than very well33.7% of residents speak other language at home 472 75.6% Speak English very well152 24.4% Speak English less than very well
White (Caucasian) - Speak only English Native:
94.6% (6,208)Foreign-born:
19.5% (89)
White (Caucasian) - Speak another language Native:
5.2% (342)Foreign-born:
81.5% (373)
Black or African American - Speak only English Native:
80.6% (783)Foreign-born:
27.2% (51)
Black or African American - Speak another language Native:
25.1% (244)Foreign-born:
83.9% (158)
Asian - Speak only English Native:
65.8% (121)Foreign-born:
24.7% (122)
Asian - Speak another language Native:
33.7% (62)Foreign-born:
73.3% (362)
Other race - Speak only English Native:
23.2% (175)Foreign-born:
15.3% (33)
Other race - Speak another language Native:
72.8% (550)Foreign-born:
99.3% (216)
Two or more races - Speak only English Native:
67.8% (1,365)Foreign-born:
17.3% (47)
Two or more races - Speak another language Native:
31.8% (640)Foreign-born:
82.6% (227)
White alone - Speak only English Native:
98.5% (5,939)Foreign-born:
21.2% (67)
White alone - Speak another language Native:
1.6% (99)Foreign-born:
86.0% (272)
Hispanic or Latino - Speak only English Native:
35.6% (852)Foreign-born:
7.3% (68)
Hispanic or Latino - Speak another language Native:
60.9% (1,457)Foreign-born:
92.4% (862)
Foreign-born residents in Goldenrod 1,794 residents are foreign born (8.3% Latin America , 3.2% Asia , 1.9% Europe ).
This city:
14.1%Florida:
21.1%
Marital status for residents in Goldenrod Marital status - White (Caucasian) population 15 years and over
Males 47.6% Never married40.6% Now married0.5% Separated4.1% Widowed7.2% DivorcedFemales 33.8% Never married42.3% Now married1.4% Separated9.8% Widowed12.6% DivorcedWomen who gave birth in the past 12 months Now married:
100.0% (52)Unmarried:
0.0% (0)
Women who did not give birth in the past 12 months Now married:
40.6% (843)Unmarried:
59.4% (1,235)
Marital status - Black or African American population 15 years and over
Males 74.2% Never married12.4% Now married6.6% Separated0.0% Widowed6.8% DivorcedFemales 56.1% Never married20.8% Now married0.0% Separated9.8% Widowed13.3% DivorcedWomen who gave birth in the past 12 months Now married:
0.0% (0)Unmarried:
100.0% (42)
Women who did not give birth in the past 12 months Now married:
13.9% (46)Unmarried:
86.1% (287)
Marital status - American Indian / Alaska Native population 15 years and over
Males 100.0% Never married0.0% Now married0.0% Separated0.0% Widowed0.0% DivorcedFemales 0.0% Never married100.0% Now married0.0% Separated0.0% Widowed0.0% DivorcedWomen who did not give birth in the past 12 months Now married:
100.0% (7)Unmarried:
0.0% (0)
Marital status - Asian population 15 years and over
Males 50.8% Never married42.9% Now married0.0% Separated1.6% Widowed4.8% DivorcedFemales 35.7% Never married59.2% Now married0.0% Separated5.0% Widowed0.0% DivorcedWomen who did not give birth in the past 12 months Now married:
50.0% (94)Unmarried:
50.0% (94)
Marital status - Other race population 15 years and over
Males 41.3% Never married43.4% Now married0.0% Separated0.0% Widowed15.3% DivorcedFemales 40.0% Never married37.3% Now married0.0% Separated10.7% Widowed11.9% DivorcedWomen who did not give birth in the past 12 months Now married:
35.6% (83)Unmarried:
64.4% (149)
Marital status - Two or more races population 15 years and over
Males 55.9% Never married37.1% Now married1.0% Separated0.0% Widowed6.0% DivorcedFemales 54.0% Never married21.2% Now married0.0% Separated2.4% Widowed22.3% DivorcedWomen who gave birth in the past 12 months Now married:
100.0% (37)Unmarried:
0.0% (0)
Women who did not give birth in the past 12 months Now married:
17.2% (122)Unmarried:
82.8% (585)
Marital status - White alone, not Hispanic / Latino population 15 years and over
Males 48.2% Never married40.8% Now married0.6% Separated4.2% Widowed6.3% DivorcedFemales 32.9% Never married43.5% Now married1.1% Separated10.2% Widowed12.2% DivorcedWomen who gave birth in the past 12 months Now married:
100.0% (29)Unmarried:
0.0% (0)
Women who did not give birth in the past 12 months Now married:
41.2% (773)Unmarried:
58.8% (1,101)
Marital status - Hispanic or Latino population 15 years and over
Males 49.6% Never married34.1% Now married0.0% Separated1.2% Widowed15.1% DivorcedFemales 43.2% Never married28.8% Now married1.3% Separated6.3% Widowed20.4% DivorcedWomen who gave birth in the past 12 months Now married:
100.0% (37)Unmarried:
0.0% (0)
Women who did not give birth in the past 12 months Now married:
26.8% (281)Unmarried:
73.2% (767)
Ancestries in Goldenrod
926 13.9% American320 4.8% Irish302 4.5% English281 4.2% Italian229 3.4% German114 1.7% Guyanese105 1.6% European91 1.4% Slovak68 1.0% French67 1.0% Jamaican63 0.9% Portuguese57 0.9% Scandinavian53 0.8% Lebanese53 0.8% Polish42 0.6% British37 0.6% Eastern European36 0.5% South African35 0.5% Swiss35 0.5% Haitian32 0.5% African27 0.4% French Canadian22 0.3% Norwegian22 0.3% Dutch22 0.3% Bahamian21 0.3% Basque21 0.3% Scotch-Irish19 0.3% Swedish15 0.2% Northern European12 0.2% Lithuanian11 0.2% Hungarian11 0.2% Cajun9 0.1% U.S. Virgin Islander7 0.1% Czech7 0.1% Palestinian7 0.1% Maltese6 0.09% Austrian4 0.06% Russian1 0.02% Scottish
Geographical mobility in Goldenrod Same house 1 year ago 5,864 80.8% White (Caucasian)1,059 90.1% Black or African American17 75.7% American Indian / Alaska Native686 99.1% Asian651 68.7% Other race2,051 82.1% Two or more races5,339 81.4% White alone, not Hispanic / Latino2,558 75.2% Hispanic or LatinoMoved within same county 489 6.7% White / Caucasian5 20.6% American Indian / Alaska Native193 20.4% Other race147 5.9% Two or more races429 6.5% White alone, not Hispanic / Latino523 15.4% Hispanic or LatinoMoved within same state 456 6.3% White / Caucasian50 4.2% Black or African American8 1.1% Asian10 1.1% Other race169 6.8% Two or more races470 7.2% White alone, not Hispanic / Latino113 3.3% Hispanic or LatinoMoved from different state 348 4.8% White / Caucasian93 7.9% Black or African American81 8.5% Other race64 2.6% Two or more races268 4.1% White alone, not Hispanic / Latino200 5.9% Hispanic or LatinoMoved from abroad 83 1.1% White9 0.8% Black or African American16 0.2% White alone, not Hispanic / Latino37 1.1% Hispanic or Latino
Children Nativity (place of birth) in Goldenrod
Children under 6 years - Living with two parents Both parents native 275 100.0% NativeBoth parents foreign-born 23 100.0% NativeOne native, one foreign-born parent 80 100.0% NativeChildren under 6 years - Living with one parent Native parent 162 100.0% NativeForeign-born parent 25 100.0% NativeChildren 6 to 17 years - Living with two parents Both parents native 456 100.0% NativeBoth parents foreign-born 35 21.5% Native127 78.5% Foreign-bornOne native, one foreign-born parent 12 100.0% NativeChildren 6 to 17 years - Living with one parent Native parent 484 100.0% NativeForeign-born parent 357 52.2% Native326 47.8% Foreign-born
Grandparents responsible for own grandchildren in Goldenrod
Grandparents (30 to 59 years) White / Caucasian 16 39.4% Responsible for grandchildren24 60.6% Not responsible for grandchildrenBlack or African American 15 100.0% Not responsible for grandchildrenWhite alone, not Hispanic / Latino 20 39.6% Responsible for grandchildren30 60.4% Not responsible for grandchildren
Grandparents (60 years and over) White / Caucasian 98 100.0% Not responsible for grandchildrenWhite alone, not Hispanic / Latino 83 100.0% Not responsible for grandchildren