Races in Golden Valley, Minnesota (MN) Detailed Stats
Data:
Races - White alone (%)
Races - White alone (% change since 2000)
Races - Black alone (%)
Races - Black alone (% change since 2000)
Races - American Indian alone (%)
Races - American Indian alone (% change since 2000)
Races - Asian alone (%)
Races - Asian alone (% change since 2000)
Races - Hispanic (%)
Races - Hispanic (% change since 2000)
Races - Native Hawaiian and Other Pacific Islander alone (%)
Races - Native Hawaiian and Other Pacific Islander alone (% change since 2000)
Races - Two or more races(%)
Races - Two or more races(% change since 2000)
Races - Other race alone (%)
Races - Other race alone (% change since 2000)
Racial diversity
Place of birth - Born in state of residence (%)
Place of birth - Born in state of residence (%) - White
Place of birth - Born in state of residence (%) - Black or African American
Place of birth - Born in state of residence (%) - Asian
Place of birth - Born in state of residence (%) - Hispanic or Latino
Place of birth - Born in state of residence (%) - American Indian and Alaska Native
Place of birth - Born in state of residence (%) - Multirace
Place of birth - Born in state of residence (%) - Other Race
Place of birth - Born in other state (%)
Place of birth - Born in other state (%) - White
Place of birth - Born in other state (%) - Black or African American
Place of birth - Born in other state (%) - Asian
Place of birth - Born in other state (%) - Hispanic or Latino
Place of birth - Born in other state (%) - American Indian and Alaska Native
Place of birth - Born in other state (%) - Multirace
Place of birth - Born in other state (%) - Other Race
Place of birth - Native, outside of US (%)
Place of birth - Native, outside of US (%) - White
Place of birth - Native, outside of US (%) - Black or African American
Place of birth - Native, outside of US (%) - Asian
Place of birth - Native, outside of US (%) - Hispanic or Latino
Place of birth - Native, outside of US (%) - American Indian and Alaska Native
Place of birth - Native, outside of US (%) - Multirace
Place of birth - Native, outside of US (%) - Other Race
Place of birth - Foreign born (%)
Place of birth - Foreign born (%) - White
Place of birth - Foreign born (%) - Black or African American
Place of birth - Foreign born (%) - Asian
Place of birth - Foreign born (%) - Hispanic or Latino
Place of birth - Foreign born (%) - American Indian and Alaska Native
Place of birth - Foreign born (%) - Multirace
Place of birth - Foreign born (%) - Other Race
Residents speaking English at home (%)
Residents speaking English at home - Born in the United States (%)
Residents speaking English at home - Native, born elsewhere (%)
Residents speaking English at home - Foreign born (%)
Residents speaking Spanish at home (%)
Residents speaking Spanish at home - Born in the United States (%)
Residents speaking Spanish at home - Native, born elsewhere (%)
Residents speaking Spanish at home - Foreign born (%)
Residents speaking other language at home (%)
Residents speaking other language at home - Born in the United States (%)
Residents speaking other language at home - Native, born elsewhere (%)
Residents speaking other language at home - Foreign born (%)
Marital status - Never married (%)
Marital status - Now married (%)
Marital status - Separated (%)
Marital status - Widowed (%)
Marital status - Divorced (%)
Ancestries Reported - Arab (%)
Ancestries Reported - Czech (%)
Ancestries Reported - Danish (%)
Ancestries Reported - Dutch (%)
Ancestries Reported - English (%)
Ancestries Reported - French (%)
Ancestries Reported - French Canadian (%)
Ancestries Reported - German (%)
Ancestries Reported - Greek (%)
Ancestries Reported - Hungarian (%)
Ancestries Reported - Irish (%)
Ancestries Reported - Italian (%)
Ancestries Reported - Lithuanian (%)
Ancestries Reported - Norwegian (%)
Ancestries Reported - Polish (%)
Ancestries Reported - Portuguese (%)
Ancestries Reported - Russian (%)
Ancestries Reported - Scotch-Irish (%)
Ancestries Reported - Scottish (%)
Ancestries Reported - Slovak (%)
Ancestries Reported - Subsaharan African (%)
Ancestries Reported - Swedish (%)
Ancestries Reported - Swiss (%)
Ancestries Reported - Ukrainian (%)
Ancestries Reported - United States (%)
Ancestries Reported - Welsh (%)
Ancestries Reported - West Indian (%)
Ancestries Reported - Other (%)
Geographical mobility - Same house 1 year ago (%)
Geographical mobility - Same house 1 year ago (%) - White
Geographical mobility - Same house 1 year ago (%) - Black or African American
Geographical mobility - Same house 1 year ago (%) - Asian
Geographical mobility - Same house 1 year ago (%) - Hispanic or Latino
Geographical mobility - Same house 1 year ago (%) - American Indian and Alaska Native
Geographical mobility - Same house 1 year ago (%) - Multirace
Geographical mobility - Same house 1 year ago (%) - Other Race
Geographical mobility - Moved within same county (%)
Geographical mobility - Moved within same county (%) - White
Geographical mobility - Moved within same county (%) - Black or African American
Geographical mobility - Moved within same county (%) - Asian
Geographical mobility - Moved within same county (%) - Hispanic or Latino
Geographical mobility - Moved within same county (%) - American Indian and Alaska Native
Geographical mobility - Moved within same county (%) - Multirace
Geographical mobility - Moved within same county (%) - Other Race
Geographical mobility - Moved from different county within same state (%)
Geographical mobility - Moved from different county within same state (%) - White
Geographical mobility - Moved from different county within same state (%) - Black or African American
Geographical mobility - Moved from different county within same state (%) - Asian
Geographical mobility - Moved from different county within same state (%) - Hispanic or Latino
Geographical mobility - Moved from different county within same state (%) - American Indian and Alaska Native
Geographical mobility - Moved from different county within same state (%) - Multirace
Geographical mobility - Moved from different county within same state (%) - Other Race
Geographical mobility - Moved from different state (%)
Geographical mobility - Moved from different state (%) - White
Geographical mobility - Moved from different state (%) - Black or African American
Geographical mobility - Moved from different state (%) - Asian
Geographical mobility - Moved from different state (%) - Hispanic or Latino
Geographical mobility - Moved from different state (%) - American Indian and Alaska Native
Geographical mobility - Moved from different state (%) - Multirace
Geographical mobility - Moved from different state (%) - Other Race
Geographical mobility - Moved from abroad (%)
Geographical mobility - Moved from abroad (%) - White
Geographical mobility - Moved from abroad (%) - Black or African American
Geographical mobility - Moved from abroad (%) - Asian
Geographical mobility - Moved from abroad (%) - Hispanic or Latino
Geographical mobility - Moved from abroad (%) - American Indian and Alaska Native
Geographical mobility - Moved from abroad (%) - Multirace
Geographical mobility - Moved from abroad (%) - Other Race
Place of birth for the foreign-born population - Ireland (%)
Place of birth for the foreign-born population - Denmark (%)
Place of birth for the foreign-born population - Norway (%)
Place of birth for the foreign-born population - Sweden (%)
Place of birth for the foreign-born population - United Kingdom (%)
Place of birth for the foreign-born population - England (%)
Place of birth for the foreign-born population - Scotland (%)
Place of birth for the foreign-born population - Other Northern Europe (%)
Place of birth for the foreign-born population - Austria (%)
Place of birth for the foreign-born population - Belgium (%)
Place of birth for the foreign-born population - France (%)
Place of birth for the foreign-born population - Germany (%)
Place of birth for the foreign-born population - Netherlands (%)
Place of birth for the foreign-born population - Switzerland (%)
Place of birth for the foreign-born population - Other Western Europe (%)
Place of birth for the foreign-born population - Greece (%)
Place of birth for the foreign-born population - Italy (%)
Place of birth for the foreign-born population - Portugal (%)
Place of birth for the foreign-born population - Spain (%)
Place of birth for the foreign-born population - Other Southern Europe (%)
Place of birth for the foreign-born population - Albania (%)
Place of birth for the foreign-born population - Belarus (%)
Place of birth for the foreign-born population - Bosnia and Herzegovina (%)
Place of birth for the foreign-born population - Bulgaria (%)
Place of birth for the foreign-born population - Croatia (%)
Place of birth for the foreign-born population - Czechoslovakia (%)
Place of birth for the foreign-born population - Hungary (%)
Place of birth for the foreign-born population - Latvia (%)
Place of birth for the foreign-born population - Lithuania (%)
Place of birth for the foreign-born population - North Macedonia (Macedonia) (%)
Place of birth for the foreign-born population - Moldova (%)
Place of birth for the foreign-born population - Poland (%)
Place of birth for the foreign-born population - Romania (%)
Place of birth for the foreign-born population - Russia (%)
Place of birth for the foreign-born population - Serbia (%)
Place of birth for the foreign-born population - Ukraine (%)
Place of birth for the foreign-born population - Other Eastern Europe (%)
Place of birth for the foreign-born population - China (%)
Place of birth for the foreign-born population - Hong Kong (%)
Place of birth for the foreign-born population - Taiwan (%)
Place of birth for the foreign-born population - Japan (%)
Place of birth for the foreign-born population - Korea (%)
Place of birth for the foreign-born population - Other Eastern Asia (%)
Place of birth for the foreign-born population - Afghanistan (%)
Place of birth for the foreign-born population - Bangladesh (%)
Place of birth for the foreign-born population - India (%)
Place of birth for the foreign-born population - Iran (%)
Place of birth for the foreign-born population - Kazakhstan (%)
Place of birth for the foreign-born population - Nepal (%)
Place of birth for the foreign-born population - Pakistan (%)
Place of birth for the foreign-born population - Sri Lanka (%)
Place of birth for the foreign-born population - Uzbekistan (%)
Place of birth for the foreign-born population - Other South Central Asia (%)
Place of birth for the foreign-born population - Burma (%)
Place of birth for the foreign-born population - Cambodia (%)
Place of birth for the foreign-born population - Indonesia (%)
Place of birth for the foreign-born population - Laos (%)
Place of birth for the foreign-born population - Malaysia (%)
Place of birth for the foreign-born population - Philippines (%)
Place of birth for the foreign-born population - Singapore (%)
Place of birth for the foreign-born population - Thailand (%)
Place of birth for the foreign-born population - Vietnam (%)
Place of birth for the foreign-born population - Other South Eastern Asia (%)
Place of birth for the foreign-born population - Armenia (%)
Place of birth for the foreign-born population - Iraq (%)
Place of birth for the foreign-born population - Israel (%)
Place of birth for the foreign-born population - Jordan (%)
Place of birth for the foreign-born population - Kuwait (%)
Place of birth for the foreign-born population - Lebanon (%)
Place of birth for the foreign-born population - Saudi Arabia (%)
Place of birth for the foreign-born population - Syria (%)
Place of birth for the foreign-born population - Turkey (%)
Place of birth for the foreign-born population - Yemen (%)
Place of birth for the foreign-born population - Other Western Asia (%)
Place of birth for the foreign-born population - Eritrea (%)
Place of birth for the foreign-born population - Ethiopia (%)
Place of birth for the foreign-born population - Kenya (%)
Place of birth for the foreign-born population - Somalia (%)
Place of birth for the foreign-born population - Uganda (%)
Place of birth for the foreign-born population - Zimbabwe (%)
Place of birth for the foreign-born population - Other Eastern Africa (%)
Place of birth for the foreign-born population - Cameroon (%)
Place of birth for the foreign-born population - Congo (%)
Place of birth for the foreign-born population - Democratic Republic of Congo (Zaire) (%)
Place of birth for the foreign-born population - Other Middle Africa (%)
Place of birth for the foreign-born population - Egypt (%)
Place of birth for the foreign-born population - Morocco (%)
Place of birth for the foreign-born population - Sudan (%)
Place of birth for the foreign-born population - Other Northern Africa (%)
Place of birth for the foreign-born population - South Africa (%)
Place of birth for the foreign-born population - Other Southern Africa (%)
Place of birth for the foreign-born population - Cabo Verde (%)
Place of birth for the foreign-born population - Ghana (%)
Place of birth for the foreign-born population - Liberia (%)
Place of birth for the foreign-born population - Nigeria (%)
Place of birth for the foreign-born population - Senegal (%)
Place of birth for the foreign-born population - Sierra Leone (%)
Place of birth for the foreign-born population - Other Western Africa (%)
Place of birth for the foreign-born population - Australia (%)
Place of birth for the foreign-born population - New Zealand (%)
Place of birth for the foreign-born population - Fiji (%)
Place of birth for the foreign-born population - Micronesia (%)
Place of birth for the foreign-born population - Bahamas (%)
Place of birth for the foreign-born population - Barbados (%)
Place of birth for the foreign-born population - Cuba (%)
Place of birth for the foreign-born population - Dominica (%)
Place of birth for the foreign-born population - Dominican Republic (%)
Place of birth for the foreign-born population - Grenada (%)
Place of birth for the foreign-born population - Haiti (%)
Place of birth for the foreign-born population - Jamaica (%)
Place of birth for the foreign-born population - St. Vincent and the Grenadines (%)
Place of birth for the foreign-born population - Trinidad and Tobago (%)
Place of birth for the foreign-born population - West Indies (%)
Place of birth for the foreign-born population - Other Caribbean (%)
Place of birth for the foreign-born population - Belize (%)
Place of birth for the foreign-born population - Costa Rica (%)
Place of birth for the foreign-born population - El Salvador (%)
Place of birth for the foreign-born population - Guatemala (%)
Place of birth for the foreign-born population - Honduras (%)
Place of birth for the foreign-born population - Mexico (%)
Place of birth for the foreign-born population - Nicaragua (%)
Place of birth for the foreign-born population - Panama (%)
Place of birth for the foreign-born population - Other Central America (%)
Place of birth for the foreign-born population - Argentina (%)
Place of birth for the foreign-born population - Bolivia (%)
Place of birth for the foreign-born population - Brazil (%)
Place of birth for the foreign-born population - Chile (%)
Place of birth for the foreign-born population - Colombia (%)
Place of birth for the foreign-born population - Ecuador (%)
Place of birth for the foreign-born population - Guyana (%)
Place of birth for the foreign-born population - Peru (%)
Place of birth for the foreign-born population - Uruguay (%)
Place of birth for the foreign-born population - Venezuela (%)
Place of birth for the foreign-born population - Other South America (%)
Place of birth for the foreign-born population - Canada (%)
Place of birth for the foreign-born population - Other Northern America (%)
Place of birth for the foreign-born population - Other (%)
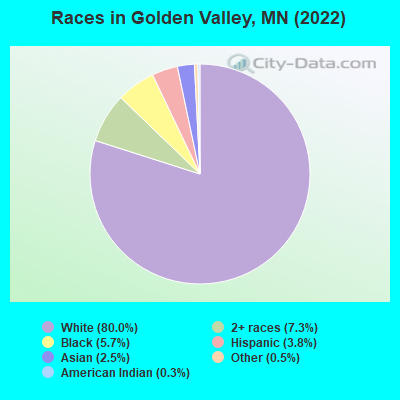
According to 2022 data, the most numerous races in Golden Valley, MN are White alone (17,557 residents), Black alone (1,251 residents), and Hispanic (838 residents). 86.4% of Golden Valley residents speak English at home. 12.4% of Golden Valley, MN residents are foreign-born (5.1% born in Asia, 4.0% born in Europe), which is 35.6% greater than the foreign-born rate of 8.0% across the entire state of Minnesota.
Race distribution in Golden Valley
2000 2022
4,337,143 88.2% White alone 168,813 3.4% Black alone 143,382 2.9% Hispanic 141,083 2.9% Asian alone 70,304 1.4% Two or more races 52,009 1.1% American Indian alone 5,031 0.1% Other race alone 1,714 0.03% Native Hawaiian and Other
4,356,347 76.2% White alone 395,179 6.9% Black alone 333,830 5.8% Hispanic 294,800 5.2% Asian alone 259,649 4.5% Two or more races 42,125 0.7% American Indian alone 32,976 0.6% Other race alone 2,278 0.04% Native Hawaiian and Other
Income and house value in Golden Valley Median household income in 2022 $109,209 White non-Hispanic householders$77,064 Black householders$79,555 Asian householders$100,643 Two or more races householders$113,798 Hispanic or Latino race householdersMedian 2022 house value $406,319 White Non-Hispanic householders$402,002 Black or African American householders $373,306 Asian householders$349,180 Two or more races householders$450,760 Hispanic or Latino householders
Median age by race in Golden Valley
49.7 Median age for White residents47.3 52.0 39.2 Median age for Black or African American residents38.7 42.4 36.9 Median age for American Indian / Alaska Native residents34.8 60.3 40.0 Median age for Asian residents42.2 39.5 -790,303,029.5 Median age for Native Hawaiian / Pacific Islander residents-856,799,036.4 -365,948,037.2 42.7 Median age for Other race residents44.6 40.3 17.5 Median age for Two or more races residents22.7 17.4 49.4 Median age for White alone residents47.2 52.2 31.4 Median age for Hispanic or Latino residents31.4 35.8
Owner/renter occupied households by race in Golden Valley
House owners and renters - White residents 6,354 74.0% Owner occupied2,232 26.0% Renter occupiedHouse owners and renters - Black or African American residents 199 38.3% Owner occupied321 61.7% Renter occupiedHouse owners and renters - Asian residents 171 82.3% Owner occupied37 17.7% Renter occupiedHouse owners and renters - Other race residents 32 38.9% Owner occupied51 61.1% Renter occupiedHouse owners and renters - Two or more races residents 291 54.5% Owner occupied242 45.5% Renter occupiedHouse owners and renters - White alone residents 6,282 74.3% Owner occupied2,177 25.7% Renter occupiedHouse owners and renters - Hispanic or Latino residents 196 68.1% Owner occupied92 31.9% Renter occupied
Language usage in Golden Valley
English speakers - Total 86.4% of residents of Golden Valley speak English at home.
2.8% of residents speak Spanish at home 447 75.6% Speak English very well144 24.4% Speak English less than very well10.8% of residents speak other language at home 1,011 44.5% Speak English very well1,261 55.5% Speak English less than very well
English speakers - Born in the United States 93.8% of residents of Golden Valley speak English at home.
3.0% of residents speak Spanish at home 132 64.4% Speak English very well73 35.6% Speak English less than very well2.7% of residents speak other language at home 153 85.0% Speak English very well27 15.0% Speak English less than very well
English speakers - Native, born elsewhere 87.5% of residents of Golden Valley speak English at home.
4.9% of residents speak Spanish at home 11 100.0% Speak English very well4.9% of residents speak other language at home 11 100.0% Speak English less than very well
English speakers - Foreign-born 23.4% of residents of Golden Valley speak English at home.
6.3% of residents speak Spanish at home 146 90.1% Speak English very well16 9.9% Speak English less than very well71.5% of residents speak other language at home 688 37.6% Speak English very well1,143 62.4% Speak English less than very well
White (Caucasian) - Speak only English Native:
96.6% (15,165)Foreign-born:
38.4% (381)
White (Caucasian) - Speak another language Native:
3.3% (524)Foreign-born:
60.2% (597)
Black or African American - Speak only English Native:
94.4% (932)Foreign-born:
32.3% (78)
Asian - Speak only English Native:
51.4% (86)Foreign-born:
18.4% (66)
Asian - Speak another language Native:
50.0% (84)Foreign-born:
81.6% (294)
Other race - Speak another language Native:
8.1% (12)Foreign-born:
100.0% (5)
Two or more races - Speak only English Native:
86.4% (1,095)Foreign-born:
12.6% (118)
Two or more races - Speak another language Native:
13.4% (170)Foreign-born:
86.5% (812)
White alone - Speak only English Native:
96.8% (15,122)Foreign-born:
38.0% (397)
White alone - Speak another language Native:
3.2% (497)Foreign-born:
60.2% (629)
Hispanic or Latino - Speak another language Native:
34.1% (198)Foreign-born:
95.7% (185)
Foreign-born residents in Golden Valley 2,729 residents are foreign born (5.1% Asia , 4.0% Europe ).
This city:
12.4%Minnesota:
8.5%
Marital status for residents in Golden Valley Marital status - White (Caucasian) population 15 years and over
Males 28.3% Never married61.5% Now married0.5% Separated2.3% Widowed7.3% DivorcedFemales 24.0% Never married54.3% Now married0.4% Separated9.7% Widowed11.6% DivorcedWomen who gave birth in the past 12 months Now married:
95.1% (205)Unmarried:
4.9% (11)
Women who did not give birth in the past 12 months Now married:
50.5% (1,693)Unmarried:
49.5% (1,662)
Marital status - Black or African American population 15 years and over
Males 54.8% Never married33.6% Now married2.6% Separated0.0% Widowed9.0% DivorcedFemales 53.9% Never married27.1% Now married0.0% Separated7.0% Widowed12.0% DivorcedWomen who did not give birth in the past 12 months Now married:
21.0% (65)Unmarried:
79.0% (244)
Marital status - American Indian / Alaska Native population 15 years and over
Males 89.5% Never married10.5% Now married0.0% Separated0.0% Widowed0.0% DivorcedFemales 0.0% Never married91.4% Now married0.0% Separated0.0% Widowed8.6% DivorcedWomen who did not give birth in the past 12 months Now married:
100.0% (6)Unmarried:
0.0% (0)
Marital status - Asian population 15 years and over
Males 38.3% Never married61.7% Now married0.0% Separated0.0% Widowed0.0% DivorcedFemales 21.9% Never married51.2% Now married13.3% Separated5.3% Widowed8.3% DivorcedWomen who gave birth in the past 12 months Now married:
100.0% (13)Unmarried:
0.0% (0)
Women who did not give birth in the past 12 months Now married:
57.0% (94)Unmarried:
43.0% (71)
Marital status - Other race population 15 years and over
Males 79.5% Never married20.5% Now married0.0% Separated0.0% Widowed0.0% DivorcedFemales 68.6% Never married31.4% Now married0.0% Separated0.0% Widowed0.0% DivorcedWomen who did not give birth in the past 12 months Now married:
0.0% (0)Unmarried:
100.0% (27)
Marital status - Two or more races population 15 years and over
Males 35.1% Never married60.8% Now married3.1% Separated0.0% Widowed1.0% DivorcedFemales 42.5% Never married55.6% Now married0.0% Separated0.0% Widowed1.9% DivorcedWomen who did not give birth in the past 12 months Now married:
47.4% (246)Unmarried:
52.6% (273)
Marital status - White alone, not Hispanic / Latino population 15 years and over
Males 27.9% Never married62.1% Now married0.5% Separated2.4% Widowed7.2% DivorcedFemales 23.7% Never married54.9% Now married0.4% Separated9.4% Widowed11.5% DivorcedWomen who gave birth in the past 12 months Now married:
95.1% (209)Unmarried:
4.9% (11)
Women who did not give birth in the past 12 months Now married:
51.7% (1,688)Unmarried:
48.3% (1,576)
Marital status - Hispanic or Latino population 15 years and over
Males 33.6% Never married59.3% Now married0.0% Separated0.0% Widowed7.1% DivorcedFemales 37.5% Never married37.9% Now married0.0% Separated15.1% Widowed9.5% DivorcedWomen who did not give birth in the past 12 months Now married:
25.4% (56)Unmarried:
74.6% (164)
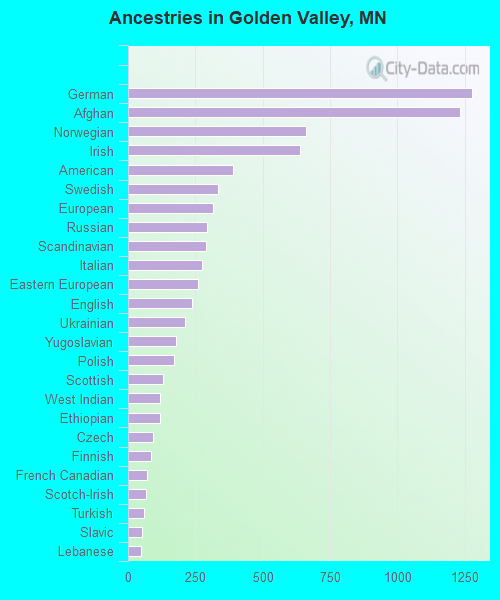
Ancestries in Golden Valley
1,276 14.1% German1,232 13.6% Afghan659 7.3% Norwegian640 7.1% Irish389 4.3% American335 3.7% Swedish314 3.5% European292 3.2% Russian288 3.2% Scandinavian275 3.0% Italian260 2.9% Eastern European239 2.6% English212 2.3% Ukrainian177 2.0% Yugoslavian172 1.9% Polish130 1.4% Scottish120 1.3% West Indian118 1.3% Ethiopian91 1.0% Czech85 0.9% Finnish71 0.8% French Canadian66 0.7% Scotch-Irish58 0.6% Turkish53 0.6% Slavic50 0.6% Lebanese49 0.5% Nigerian41 0.5% Northern European33 0.4% Danish33 0.4% Swiss29 0.3% Hungarian26 0.3% Dutch23 0.3% Welsh21 0.2% Iranian20 0.2% Canadian16 0.2% French11 0.1% Ghanaian11 0.1% British9 0.10% Romanian9 0.10% South African8 0.09% Trinidadian and Tobagonian7 0.08% Brazilian4 0.04% African2 0.02% Liberian
Geographical mobility in Golden Valley Same house 1 year ago 15,695 89.9% White (Caucasian)907 72.7% Black or African American71 96.4% American Indian / Alaska Native422 78.1% Asian8 100.0% Native Hawaiian / Pacific Islander136 94.4% Other race2,004 87.4% Two or more races15,669 90.2% White alone, not Hispanic / Latino640 76.6% Hispanic or LatinoMoved within same county 1,221 7.0% White / Caucasian190 15.2% Black or African American3 4.5% American Indian / Alaska Native109 20.2% Asian4 3.0% Other race193 8.4% Two or more races1,180 6.8% White alone, not Hispanic / Latino167 20.0% Hispanic or LatinoMoved within same state 271 1.6% White / Caucasian80 6.4% Black or African American2 3.3% American Indian / Alaska Native6 0.3% Two or more races270 1.6% White alone, not Hispanic / Latino8 0.9% Hispanic or LatinoMoved from different state 286 1.6% White / Caucasian23 1.8% Black or African American90 3.9% Two or more races279 1.6% White alone, not Hispanic / LatinoMoved from abroad 24 0.1% White5 3.3% Other race26 0.1% White alone, not Hispanic / Latino
Children Nativity (place of birth) in Golden Valley
Children under 6 years - Living with two parents Both parents native 889 100.0% NativeBoth parents foreign-born 79 36.5% Native137 63.5% Foreign-bornOne native, one foreign-born parent 27 100.0% NativeChildren under 6 years - Living with one parent Native parent 50 100.0% NativeForeign-born parent 44 100.0% NativeChildren 6 to 17 years - Living with two parents Both parents native 1,343 100.0% NativeBoth parents foreign-born 160 48.2% Native172 51.8% Foreign-bornOne native, one foreign-born parent 231 76.3% Native72 23.7% Foreign-bornChildren 6 to 17 years - Living with one parent Native parent 442 100.0% NativeForeign-born parent 53 52.3% Native48 47.7% Foreign-born