Races in Golden Glades, Florida (FL) Detailed Stats
Data:
Races - White alone (%)
Races - White alone (% change since 2000)
Races - Black alone (%)
Races - Black alone (% change since 2000)
Races - American Indian alone (%)
Races - American Indian alone (% change since 2000)
Races - Asian alone (%)
Races - Asian alone (% change since 2000)
Races - Hispanic (%)
Races - Hispanic (% change since 2000)
Races - Native Hawaiian and Other Pacific Islander alone (%)
Races - Native Hawaiian and Other Pacific Islander alone (% change since 2000)
Races - Two or more races(%)
Races - Two or more races(% change since 2000)
Races - Other race alone (%)
Races - Other race alone (% change since 2000)
Racial diversity
Place of birth - Born in state of residence (%)
Place of birth - Born in state of residence (%) - White
Place of birth - Born in state of residence (%) - Black or African American
Place of birth - Born in state of residence (%) - Asian
Place of birth - Born in state of residence (%) - Hispanic or Latino
Place of birth - Born in state of residence (%) - American Indian and Alaska Native
Place of birth - Born in state of residence (%) - Multirace
Place of birth - Born in state of residence (%) - Other Race
Place of birth - Born in other state (%)
Place of birth - Born in other state (%) - White
Place of birth - Born in other state (%) - Black or African American
Place of birth - Born in other state (%) - Asian
Place of birth - Born in other state (%) - Hispanic or Latino
Place of birth - Born in other state (%) - American Indian and Alaska Native
Place of birth - Born in other state (%) - Multirace
Place of birth - Born in other state (%) - Other Race
Place of birth - Native, outside of US (%)
Place of birth - Native, outside of US (%) - White
Place of birth - Native, outside of US (%) - Black or African American
Place of birth - Native, outside of US (%) - Asian
Place of birth - Native, outside of US (%) - Hispanic or Latino
Place of birth - Native, outside of US (%) - American Indian and Alaska Native
Place of birth - Native, outside of US (%) - Multirace
Place of birth - Native, outside of US (%) - Other Race
Place of birth - Foreign born (%)
Place of birth - Foreign born (%) - White
Place of birth - Foreign born (%) - Black or African American
Place of birth - Foreign born (%) - Asian
Place of birth - Foreign born (%) - Hispanic or Latino
Place of birth - Foreign born (%) - American Indian and Alaska Native
Place of birth - Foreign born (%) - Multirace
Place of birth - Foreign born (%) - Other Race
Residents speaking English at home (%)
Residents speaking English at home - Born in the United States (%)
Residents speaking English at home - Native, born elsewhere (%)
Residents speaking English at home - Foreign born (%)
Residents speaking Spanish at home (%)
Residents speaking Spanish at home - Born in the United States (%)
Residents speaking Spanish at home - Native, born elsewhere (%)
Residents speaking Spanish at home - Foreign born (%)
Residents speaking other language at home (%)
Residents speaking other language at home - Born in the United States (%)
Residents speaking other language at home - Native, born elsewhere (%)
Residents speaking other language at home - Foreign born (%)
Marital status - Never married (%)
Marital status - Now married (%)
Marital status - Separated (%)
Marital status - Widowed (%)
Marital status - Divorced (%)
Ancestries Reported - Arab (%)
Ancestries Reported - Czech (%)
Ancestries Reported - Danish (%)
Ancestries Reported - Dutch (%)
Ancestries Reported - English (%)
Ancestries Reported - French (%)
Ancestries Reported - French Canadian (%)
Ancestries Reported - German (%)
Ancestries Reported - Greek (%)
Ancestries Reported - Hungarian (%)
Ancestries Reported - Irish (%)
Ancestries Reported - Italian (%)
Ancestries Reported - Lithuanian (%)
Ancestries Reported - Norwegian (%)
Ancestries Reported - Polish (%)
Ancestries Reported - Portuguese (%)
Ancestries Reported - Russian (%)
Ancestries Reported - Scotch-Irish (%)
Ancestries Reported - Scottish (%)
Ancestries Reported - Slovak (%)
Ancestries Reported - Subsaharan African (%)
Ancestries Reported - Swedish (%)
Ancestries Reported - Swiss (%)
Ancestries Reported - Ukrainian (%)
Ancestries Reported - United States (%)
Ancestries Reported - Welsh (%)
Ancestries Reported - West Indian (%)
Ancestries Reported - Other (%)
Geographical mobility - Same house 1 year ago (%)
Geographical mobility - Same house 1 year ago (%) - White
Geographical mobility - Same house 1 year ago (%) - Black or African American
Geographical mobility - Same house 1 year ago (%) - Asian
Geographical mobility - Same house 1 year ago (%) - Hispanic or Latino
Geographical mobility - Same house 1 year ago (%) - American Indian and Alaska Native
Geographical mobility - Same house 1 year ago (%) - Multirace
Geographical mobility - Same house 1 year ago (%) - Other Race
Geographical mobility - Moved within same county (%)
Geographical mobility - Moved within same county (%) - White
Geographical mobility - Moved within same county (%) - Black or African American
Geographical mobility - Moved within same county (%) - Asian
Geographical mobility - Moved within same county (%) - Hispanic or Latino
Geographical mobility - Moved within same county (%) - American Indian and Alaska Native
Geographical mobility - Moved within same county (%) - Multirace
Geographical mobility - Moved within same county (%) - Other Race
Geographical mobility - Moved from different county within same state (%)
Geographical mobility - Moved from different county within same state (%) - White
Geographical mobility - Moved from different county within same state (%) - Black or African American
Geographical mobility - Moved from different county within same state (%) - Asian
Geographical mobility - Moved from different county within same state (%) - Hispanic or Latino
Geographical mobility - Moved from different county within same state (%) - American Indian and Alaska Native
Geographical mobility - Moved from different county within same state (%) - Multirace
Geographical mobility - Moved from different county within same state (%) - Other Race
Geographical mobility - Moved from different state (%)
Geographical mobility - Moved from different state (%) - White
Geographical mobility - Moved from different state (%) - Black or African American
Geographical mobility - Moved from different state (%) - Asian
Geographical mobility - Moved from different state (%) - Hispanic or Latino
Geographical mobility - Moved from different state (%) - American Indian and Alaska Native
Geographical mobility - Moved from different state (%) - Multirace
Geographical mobility - Moved from different state (%) - Other Race
Geographical mobility - Moved from abroad (%)
Geographical mobility - Moved from abroad (%) - White
Geographical mobility - Moved from abroad (%) - Black or African American
Geographical mobility - Moved from abroad (%) - Asian
Geographical mobility - Moved from abroad (%) - Hispanic or Latino
Geographical mobility - Moved from abroad (%) - American Indian and Alaska Native
Geographical mobility - Moved from abroad (%) - Multirace
Geographical mobility - Moved from abroad (%) - Other Race
Place of birth for the foreign-born population - Ireland (%)
Place of birth for the foreign-born population - Denmark (%)
Place of birth for the foreign-born population - Norway (%)
Place of birth for the foreign-born population - Sweden (%)
Place of birth for the foreign-born population - United Kingdom (%)
Place of birth for the foreign-born population - England (%)
Place of birth for the foreign-born population - Scotland (%)
Place of birth for the foreign-born population - Other Northern Europe (%)
Place of birth for the foreign-born population - Austria (%)
Place of birth for the foreign-born population - Belgium (%)
Place of birth for the foreign-born population - France (%)
Place of birth for the foreign-born population - Germany (%)
Place of birth for the foreign-born population - Netherlands (%)
Place of birth for the foreign-born population - Switzerland (%)
Place of birth for the foreign-born population - Other Western Europe (%)
Place of birth for the foreign-born population - Greece (%)
Place of birth for the foreign-born population - Italy (%)
Place of birth for the foreign-born population - Portugal (%)
Place of birth for the foreign-born population - Spain (%)
Place of birth for the foreign-born population - Other Southern Europe (%)
Place of birth for the foreign-born population - Albania (%)
Place of birth for the foreign-born population - Belarus (%)
Place of birth for the foreign-born population - Bosnia and Herzegovina (%)
Place of birth for the foreign-born population - Bulgaria (%)
Place of birth for the foreign-born population - Croatia (%)
Place of birth for the foreign-born population - Czechoslovakia (%)
Place of birth for the foreign-born population - Hungary (%)
Place of birth for the foreign-born population - Latvia (%)
Place of birth for the foreign-born population - Lithuania (%)
Place of birth for the foreign-born population - North Macedonia (Macedonia) (%)
Place of birth for the foreign-born population - Moldova (%)
Place of birth for the foreign-born population - Poland (%)
Place of birth for the foreign-born population - Romania (%)
Place of birth for the foreign-born population - Russia (%)
Place of birth for the foreign-born population - Serbia (%)
Place of birth for the foreign-born population - Ukraine (%)
Place of birth for the foreign-born population - Other Eastern Europe (%)
Place of birth for the foreign-born population - China (%)
Place of birth for the foreign-born population - Hong Kong (%)
Place of birth for the foreign-born population - Taiwan (%)
Place of birth for the foreign-born population - Japan (%)
Place of birth for the foreign-born population - Korea (%)
Place of birth for the foreign-born population - Other Eastern Asia (%)
Place of birth for the foreign-born population - Afghanistan (%)
Place of birth for the foreign-born population - Bangladesh (%)
Place of birth for the foreign-born population - India (%)
Place of birth for the foreign-born population - Iran (%)
Place of birth for the foreign-born population - Kazakhstan (%)
Place of birth for the foreign-born population - Nepal (%)
Place of birth for the foreign-born population - Pakistan (%)
Place of birth for the foreign-born population - Sri Lanka (%)
Place of birth for the foreign-born population - Uzbekistan (%)
Place of birth for the foreign-born population - Other South Central Asia (%)
Place of birth for the foreign-born population - Burma (%)
Place of birth for the foreign-born population - Cambodia (%)
Place of birth for the foreign-born population - Indonesia (%)
Place of birth for the foreign-born population - Laos (%)
Place of birth for the foreign-born population - Malaysia (%)
Place of birth for the foreign-born population - Philippines (%)
Place of birth for the foreign-born population - Singapore (%)
Place of birth for the foreign-born population - Thailand (%)
Place of birth for the foreign-born population - Vietnam (%)
Place of birth for the foreign-born population - Other South Eastern Asia (%)
Place of birth for the foreign-born population - Armenia (%)
Place of birth for the foreign-born population - Iraq (%)
Place of birth for the foreign-born population - Israel (%)
Place of birth for the foreign-born population - Jordan (%)
Place of birth for the foreign-born population - Kuwait (%)
Place of birth for the foreign-born population - Lebanon (%)
Place of birth for the foreign-born population - Saudi Arabia (%)
Place of birth for the foreign-born population - Syria (%)
Place of birth for the foreign-born population - Turkey (%)
Place of birth for the foreign-born population - Yemen (%)
Place of birth for the foreign-born population - Other Western Asia (%)
Place of birth for the foreign-born population - Eritrea (%)
Place of birth for the foreign-born population - Ethiopia (%)
Place of birth for the foreign-born population - Kenya (%)
Place of birth for the foreign-born population - Somalia (%)
Place of birth for the foreign-born population - Uganda (%)
Place of birth for the foreign-born population - Zimbabwe (%)
Place of birth for the foreign-born population - Other Eastern Africa (%)
Place of birth for the foreign-born population - Cameroon (%)
Place of birth for the foreign-born population - Congo (%)
Place of birth for the foreign-born population - Democratic Republic of Congo (Zaire) (%)
Place of birth for the foreign-born population - Other Middle Africa (%)
Place of birth for the foreign-born population - Egypt (%)
Place of birth for the foreign-born population - Morocco (%)
Place of birth for the foreign-born population - Sudan (%)
Place of birth for the foreign-born population - Other Northern Africa (%)
Place of birth for the foreign-born population - South Africa (%)
Place of birth for the foreign-born population - Other Southern Africa (%)
Place of birth for the foreign-born population - Cabo Verde (%)
Place of birth for the foreign-born population - Ghana (%)
Place of birth for the foreign-born population - Liberia (%)
Place of birth for the foreign-born population - Nigeria (%)
Place of birth for the foreign-born population - Senegal (%)
Place of birth for the foreign-born population - Sierra Leone (%)
Place of birth for the foreign-born population - Other Western Africa (%)
Place of birth for the foreign-born population - Australia (%)
Place of birth for the foreign-born population - New Zealand (%)
Place of birth for the foreign-born population - Fiji (%)
Place of birth for the foreign-born population - Micronesia (%)
Place of birth for the foreign-born population - Bahamas (%)
Place of birth for the foreign-born population - Barbados (%)
Place of birth for the foreign-born population - Cuba (%)
Place of birth for the foreign-born population - Dominica (%)
Place of birth for the foreign-born population - Dominican Republic (%)
Place of birth for the foreign-born population - Grenada (%)
Place of birth for the foreign-born population - Haiti (%)
Place of birth for the foreign-born population - Jamaica (%)
Place of birth for the foreign-born population - St. Vincent and the Grenadines (%)
Place of birth for the foreign-born population - Trinidad and Tobago (%)
Place of birth for the foreign-born population - West Indies (%)
Place of birth for the foreign-born population - Other Caribbean (%)
Place of birth for the foreign-born population - Belize (%)
Place of birth for the foreign-born population - Costa Rica (%)
Place of birth for the foreign-born population - El Salvador (%)
Place of birth for the foreign-born population - Guatemala (%)
Place of birth for the foreign-born population - Honduras (%)
Place of birth for the foreign-born population - Mexico (%)
Place of birth for the foreign-born population - Nicaragua (%)
Place of birth for the foreign-born population - Panama (%)
Place of birth for the foreign-born population - Other Central America (%)
Place of birth for the foreign-born population - Argentina (%)
Place of birth for the foreign-born population - Bolivia (%)
Place of birth for the foreign-born population - Brazil (%)
Place of birth for the foreign-born population - Chile (%)
Place of birth for the foreign-born population - Colombia (%)
Place of birth for the foreign-born population - Ecuador (%)
Place of birth for the foreign-born population - Guyana (%)
Place of birth for the foreign-born population - Peru (%)
Place of birth for the foreign-born population - Uruguay (%)
Place of birth for the foreign-born population - Venezuela (%)
Place of birth for the foreign-born population - Other South America (%)
Place of birth for the foreign-born population - Canada (%)
Place of birth for the foreign-born population - Other Northern America (%)
Place of birth for the foreign-born population - Other (%)
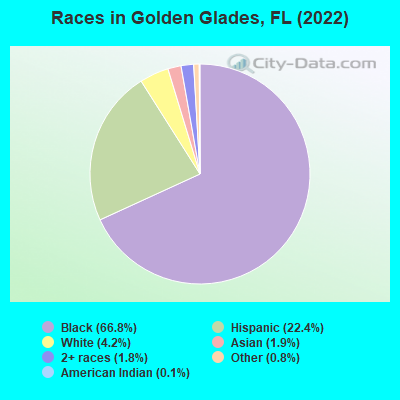
According to 2022 data, the most numerous races in Golden Glades, FL are White alone (1,438 residents), Hispanic (7,735 residents), and Black alone (23,068 residents). 31.0% of Golden Glades residents speak English at home. 48.3% of Golden Glades, FL residents are foreign-born (45.2% born in Latin America), which is 56.6% greater than the foreign-born rate of 21.0% across the entire state of Florida.
Race distribution in Golden Glades
2000 2022
10,458,509 65.4% White alone 2,682,715 16.8% Hispanic 2,264,268 14.2% Black alone 261,693 1.6% Asian alone 236,954 1.5% Two or more races 42,358 0.3% American Indian alone 28,994 0.2% Other race alone 6,887 0.04% Native Hawaiian and Other
11,309,403 50.8% White alone 6,025,039 27.1% Hispanic 3,241,015 14.6% Black alone 861,630 3.9% Two or more races 623,692 2.8% Asian alone 152,054 0.7% Other race alone 22,504 0.1% American Indian alone 9,486 0.04% Native Hawaiian and Other
Income and house value in Golden Glades Median household income in 2022 $65,997 White non-Hispanic householders$53,532 Black householders$114,166 Asian householders$44,234 Two or more races householders$49,713 Hispanic or Latino race householdersMedian 2022 house value $371,965 White Non-Hispanic householders$373,125 Black or African American householders$869,980 American Indian or Alaska Native householders $404,444 Asian householders$351,858 Some other race householders$400,191 Two or more races householders$367,325 Hispanic or Latino householders
Median age by race in Golden Glades
35.6 Median age for White residents36.7 32.8 37.6 Median age for Black or African American residents32.5 42.5 16.9 Median age for American Indian / Alaska Native residents-543,352,600.6 -762,696,213.5 42.8 Median age for Asian residents38.9 41.9 -679,849,340.2 Median age for Native Hawaiian / Pacific Islander residents-858,307,848.3 -443,298,968.6 44.4 Median age for Other race residents41.9 48.3 41.2 Median age for Two or more races residents41.8 39.7 55.1 Median age for White alone residents49.4 58.9 39.0 Median age for Hispanic or Latino residents39.2 38.8
Owner/renter occupied households by race in Golden Glades
House owners and renters - White residents 629 66.8% Owner occupied313 33.2% Renter occupiedHouse owners and renters - Black or African American residents 3,189 43.2% Owner occupied4,186 56.8% Renter occupiedHouse owners and renters - Asian residents 220 94.3% Owner occupied13 5.7% Renter occupiedHouse owners and renters - Other race residents 247 65.4% Owner occupied131 34.6% Renter occupiedHouse owners and renters - Two or more races residents 1,320 60.2% Owner occupied874 39.8% Renter occupiedHouse owners and renters - White alone residents 444 81.0% Owner occupied104 19.0% Renter occupiedHouse owners and renters - Hispanic or Latino residents 1,494 57.8% Owner occupied1,090 42.2% Renter occupied
Language usage in Golden Glades
English speakers - Total 31.0% of residents of Golden Glades speak English at home.
19.6% of residents speak Spanish at home 3,535 55.7% Speak English very well2,814 44.3% Speak English less than very well49.6% of residents speak other language at home 9,786 61.0% Speak English very well6,256 39.0% Speak English less than very well
English speakers - Born in the United States 68.3% of residents of Golden Glades speak English at home.
20.6% of residents speak Spanish at home 510 87.8% Speak English very well71 12.2% Speak English less than very well13.1% of residents speak other language at home 235 63.7% Speak English very well134 36.3% Speak English less than very well
English speakers - Native, born elsewhere 42.5% of residents of Golden Glades speak English at home.
44.0% of residents speak Spanish at home 331 81.5% Speak English very well75 18.5% Speak English less than very well17.0% of residents speak other language at home 106 67.5% Speak English very well51 32.5% Speak English less than very well
English speakers - Foreign-born 14.4% of residents of Golden Glades speak English at home.
23.9% of residents speak Spanish at home 1,427 35.9% Speak English very well2,548 64.1% Speak English less than very well60.3% of residents speak other language at home 4,301 43.0% Speak English very well5,706 57.0% Speak English less than very well
White (Caucasian) - Speak only English Native:
67.1% (1,108)Foreign-born:
7.3% (54)
White (Caucasian) - Speak another language Native:
37.1% (612)Foreign-born:
91.9% (679)
Black or African American - Speak only English Native:
51.2% (5,524)Foreign-born:
16.4% (1,774)
Black or African American - Speak another language Native:
48.7% (5,251)Foreign-born:
82.4% (8,924)
Asian - Speak only English Native:
22.7% (63)Foreign-born:
16.4% (66)
Asian - Speak another language Native:
75.5% (209)Foreign-born:
84.1% (338)
Other race - Speak only English Native:
28.0% (155)Foreign-born:
25.6% (228)
Other race - Speak another language Native:
72.1% (400)Foreign-born:
74.0% (660)
Two or more races - Speak only English Native:
28.7% (635)Foreign-born:
10.4% (349)
Two or more races - Speak another language Native:
71.0% (1,570)Foreign-born:
90.4% (3,032)
White alone - Speak only English Native:
89.8% (1,019)Foreign-born:
70.9% (81)
White alone - Speak another language Native:
11.1% (126)Foreign-born:
40.1% (46)
Hispanic or Latino - Speak only English Native:
24.5% (694)Foreign-born:
6.2% (259)
Hispanic or Latino - Speak another language Native:
75.9% (2,151)Foreign-born:
93.9% (3,952)
Foreign-born residents in Golden Glades 16,698 residents are foreign born (45.2% Latin America ).
This city:
48.3%Florida:
21.1%
Marital status for residents in Golden Glades Marital status - White (Caucasian) population 15 years and over
Males 40.2% Never married37.2% Now married5.1% Separated6.7% Widowed10.8% DivorcedFemales 35.7% Never married29.2% Now married1.8% Separated18.0% Widowed15.3% DivorcedWomen who gave birth in the past 12 months Now married:
26.5% (5)Unmarried:
73.5% (14)
Women who did not give birth in the past 12 months Now married:
41.2% (202)Unmarried:
58.8% (288)
Marital status - Black or African American population 15 years and over
Males 53.1% Never married37.4% Now married0.9% Separated1.9% Widowed6.7% DivorcedFemales 41.4% Never married35.1% Now married5.3% Separated8.5% Widowed9.7% DivorcedWomen who gave birth in the past 12 months Now married:
51.2% (174)Unmarried:
48.8% (165)
Women who did not give birth in the past 12 months Now married:
30.4% (1,451)Unmarried:
69.6% (3,319)
Marital status - American Indian / Alaska Native population 15 years and over
Males 100.0% Never married0.0% Now married0.0% Separated0.0% Widowed0.0% DivorcedFemales 70.6% Never married29.4% Now married0.0% Separated0.0% Widowed0.0% DivorcedWomen who did not give birth in the past 12 months Now married:
29.4% (16)Unmarried:
70.6% (38)
Marital status - Asian population 15 years and over
Males 51.5% Never married39.3% Now married0.0% Separated4.0% Widowed5.2% DivorcedFemales 32.7% Never married54.2% Now married0.0% Separated4.7% Widowed8.4% DivorcedWomen who did not give birth in the past 12 months Now married:
29.3% (46)Unmarried:
70.7% (111)
Marital status - Other race population 15 years and over
Males 41.8% Never married29.1% Now married4.9% Separated5.8% Widowed18.4% DivorcedFemales 25.6% Never married25.9% Now married5.3% Separated26.6% Widowed16.6% DivorcedWomen who gave birth in the past 12 months Now married:
0.0% (0)Unmarried:
100.0% (63)
Women who did not give birth in the past 12 months Now married:
28.2% (79)Unmarried:
71.8% (202)
Marital status - Two or more races population 15 years and over
Males 35.6% Never married37.0% Now married8.9% Separated0.8% Widowed17.8% DivorcedFemales 34.1% Never married38.1% Now married4.5% Separated17.4% Widowed5.9% DivorcedWomen who gave birth in the past 12 months Now married:
0.0% (0)Unmarried:
100.0% (62)
Women who did not give birth in the past 12 months Now married:
47.4% (486)Unmarried:
52.6% (540)
Marital status - White alone, not Hispanic / Latino population 15 years and over
Males 43.8% Never married21.2% Now married5.2% Separated12.6% Widowed17.2% DivorcedFemales 18.0% Never married26.3% Now married0.0% Separated28.0% Widowed27.8% DivorcedWomen who gave birth in the past 12 months Now married:
42.9% (9)Unmarried:
57.1% (12)
Women who did not give birth in the past 12 months Now married:
40.3% (26)Unmarried:
59.7% (39)
Marital status - Hispanic or Latino population 15 years and over
Males 38.9% Never married40.4% Now married6.9% Separated2.1% Widowed11.7% DivorcedFemales 38.0% Never married32.4% Now married3.7% Separated15.4% Widowed10.5% DivorcedWomen who gave birth in the past 12 months Now married:
0.0% (0)Unmarried:
100.0% (94)
Women who did not give birth in the past 12 months Now married:
39.4% (607)Unmarried:
60.6% (932)
Ancestries in Golden Glades
12,642 50.1% Haitian859 3.4% American830 3.3% Jamaican241 1.0% Nigerian175 0.7% Bahamian127 0.5% African91 0.4% Trinidadian and Tobagonian84 0.3% English80 0.3% German69 0.3% Irish40 0.2% Italian38 0.2% Portuguese37 0.1% Polish21 0.08% Guyanese20 0.08% Bulgarian20 0.08% Scottish20 0.08% Barbadian18 0.07% Brazilian9 0.04% Greek9 0.04% Norwegian8 0.03% British West Indian5 0.02% European2 0.01% British2 0.01% Scotch-Irish
Geographical mobility in Golden Glades Same house 1 year ago 2,159 83.0% White (Caucasian)21,496 94.6% Black or African American710 100.0% Asian1,476 92.1% Other race5,272 89.1% Two or more races1,242 87.3% White alone, not Hispanic / Latino6,672 86.2% Hispanic or LatinoMoved within same county 288 11.1% White / Caucasian796 3.5% Black or African American30 32.7% American Indian / Alaska Native73 4.6% Other race393 6.6% Two or more races93 6.5% White alone, not Hispanic / Latino676 8.7% Hispanic or LatinoMoved within same state 70 2.7% White / Caucasian188 0.8% Black or African American45 49.6% American Indian / Alaska Native4 0.2% Other race84 1.4% Two or more races38 2.7% White alone, not Hispanic / Latino105 1.4% Hispanic or LatinoMoved from different state 32 1.2% White / Caucasian44 0.2% Black or African American36 2.5% White alone, not Hispanic / LatinoMoved from abroad 24 0.9% White85 0.4% Black or African American68 4.3% Other race154 2.6% Two or more races235 3.0% Hispanic or Latino
Children Nativity (place of birth) in Golden Glades
Children under 6 years - Living with two parents Both parents native 186 100.0% NativeBoth parents foreign-born 362 87.4% Native52 12.6% Foreign-bornOne native, one foreign-born parent 291 100.0% NativeChildren under 6 years - Living with one parent Native parent 671 93.8% Native44 6.2% Foreign-bornForeign-born parent 699 85.1% Native122 14.9% Foreign-bornChildren 6 to 17 years - Living with two parents Both parents native 484 98.2% Native9 1.8% Foreign-bornBoth parents foreign-born 1,271 77.7% Native364 22.3% Foreign-bornOne native, one foreign-born parent 166 100.0% NativeChildren 6 to 17 years - Living with one parent Native parent 767 100.0% NativeForeign-born parent 1,872 52.8% Native1,674 47.2% Foreign-born
Grandparents responsible for own grandchildren in Golden Glades
Grandparents (30 to 59 years) White / Caucasian 22 22.1% Responsible for grandchildren77 77.9% Not responsible for grandchildrenBlack or African American 101 95.8% Responsible for grandchildren4 4.2% Not responsible for grandchildrenTwo or more races 23 100.0% Not responsible for grandchildrenWhite alone, not Hispanic / Latino 28 79.1% Responsible for grandchildren7 20.9% Not responsible for grandchildrenHispanic or Latino 34 22.0% Responsible for grandchildren121 78.0% Not responsible for grandchildrenGrandparents (60 years and over) White / Caucasian 31 100.0% Not responsible for grandchildrenBlack or African American 80 18.6% Responsible for grandchildren350 81.4% Not responsible for grandchildrenTwo or more races 105 55.9% Responsible for grandchildren83 44.1% Not responsible for grandchildrenWhite alone, not Hispanic / Latino 13 100.0% Not responsible for grandchildrenHispanic or Latino 110 39.1% Responsible for grandchildren172 60.9% Not responsible for grandchildren