Races in Golden Gate, Florida (FL) Detailed Stats
Data:
Races - White alone (%)
Races - White alone (% change since 2000)
Races - Black alone (%)
Races - Black alone (% change since 2000)
Races - American Indian alone (%)
Races - American Indian alone (% change since 2000)
Races - Asian alone (%)
Races - Asian alone (% change since 2000)
Races - Hispanic (%)
Races - Hispanic (% change since 2000)
Races - Native Hawaiian and Other Pacific Islander alone (%)
Races - Native Hawaiian and Other Pacific Islander alone (% change since 2000)
Races - Two or more races(%)
Races - Two or more races(% change since 2000)
Races - Other race alone (%)
Races - Other race alone (% change since 2000)
Racial diversity
Place of birth - Born in state of residence (%)
Place of birth - Born in state of residence (%) - White
Place of birth - Born in state of residence (%) - Black or African American
Place of birth - Born in state of residence (%) - Asian
Place of birth - Born in state of residence (%) - Hispanic or Latino
Place of birth - Born in state of residence (%) - American Indian and Alaska Native
Place of birth - Born in state of residence (%) - Multirace
Place of birth - Born in state of residence (%) - Other Race
Place of birth - Born in other state (%)
Place of birth - Born in other state (%) - White
Place of birth - Born in other state (%) - Black or African American
Place of birth - Born in other state (%) - Asian
Place of birth - Born in other state (%) - Hispanic or Latino
Place of birth - Born in other state (%) - American Indian and Alaska Native
Place of birth - Born in other state (%) - Multirace
Place of birth - Born in other state (%) - Other Race
Place of birth - Native, outside of US (%)
Place of birth - Native, outside of US (%) - White
Place of birth - Native, outside of US (%) - Black or African American
Place of birth - Native, outside of US (%) - Asian
Place of birth - Native, outside of US (%) - Hispanic or Latino
Place of birth - Native, outside of US (%) - American Indian and Alaska Native
Place of birth - Native, outside of US (%) - Multirace
Place of birth - Native, outside of US (%) - Other Race
Place of birth - Foreign born (%)
Place of birth - Foreign born (%) - White
Place of birth - Foreign born (%) - Black or African American
Place of birth - Foreign born (%) - Asian
Place of birth - Foreign born (%) - Hispanic or Latino
Place of birth - Foreign born (%) - American Indian and Alaska Native
Place of birth - Foreign born (%) - Multirace
Place of birth - Foreign born (%) - Other Race
Residents speaking English at home (%)
Residents speaking English at home - Born in the United States (%)
Residents speaking English at home - Native, born elsewhere (%)
Residents speaking English at home - Foreign born (%)
Residents speaking Spanish at home (%)
Residents speaking Spanish at home - Born in the United States (%)
Residents speaking Spanish at home - Native, born elsewhere (%)
Residents speaking Spanish at home - Foreign born (%)
Residents speaking other language at home (%)
Residents speaking other language at home - Born in the United States (%)
Residents speaking other language at home - Native, born elsewhere (%)
Residents speaking other language at home - Foreign born (%)
Marital status - Never married (%)
Marital status - Now married (%)
Marital status - Separated (%)
Marital status - Widowed (%)
Marital status - Divorced (%)
Ancestries Reported - Arab (%)
Ancestries Reported - Czech (%)
Ancestries Reported - Danish (%)
Ancestries Reported - Dutch (%)
Ancestries Reported - English (%)
Ancestries Reported - French (%)
Ancestries Reported - French Canadian (%)
Ancestries Reported - German (%)
Ancestries Reported - Greek (%)
Ancestries Reported - Hungarian (%)
Ancestries Reported - Irish (%)
Ancestries Reported - Italian (%)
Ancestries Reported - Lithuanian (%)
Ancestries Reported - Norwegian (%)
Ancestries Reported - Polish (%)
Ancestries Reported - Portuguese (%)
Ancestries Reported - Russian (%)
Ancestries Reported - Scotch-Irish (%)
Ancestries Reported - Scottish (%)
Ancestries Reported - Slovak (%)
Ancestries Reported - Subsaharan African (%)
Ancestries Reported - Swedish (%)
Ancestries Reported - Swiss (%)
Ancestries Reported - Ukrainian (%)
Ancestries Reported - United States (%)
Ancestries Reported - Welsh (%)
Ancestries Reported - West Indian (%)
Ancestries Reported - Other (%)
Geographical mobility - Same house 1 year ago (%)
Geographical mobility - Same house 1 year ago (%) - White
Geographical mobility - Same house 1 year ago (%) - Black or African American
Geographical mobility - Same house 1 year ago (%) - Asian
Geographical mobility - Same house 1 year ago (%) - Hispanic or Latino
Geographical mobility - Same house 1 year ago (%) - American Indian and Alaska Native
Geographical mobility - Same house 1 year ago (%) - Multirace
Geographical mobility - Same house 1 year ago (%) - Other Race
Geographical mobility - Moved within same county (%)
Geographical mobility - Moved within same county (%) - White
Geographical mobility - Moved within same county (%) - Black or African American
Geographical mobility - Moved within same county (%) - Asian
Geographical mobility - Moved within same county (%) - Hispanic or Latino
Geographical mobility - Moved within same county (%) - American Indian and Alaska Native
Geographical mobility - Moved within same county (%) - Multirace
Geographical mobility - Moved within same county (%) - Other Race
Geographical mobility - Moved from different county within same state (%)
Geographical mobility - Moved from different county within same state (%) - White
Geographical mobility - Moved from different county within same state (%) - Black or African American
Geographical mobility - Moved from different county within same state (%) - Asian
Geographical mobility - Moved from different county within same state (%) - Hispanic or Latino
Geographical mobility - Moved from different county within same state (%) - American Indian and Alaska Native
Geographical mobility - Moved from different county within same state (%) - Multirace
Geographical mobility - Moved from different county within same state (%) - Other Race
Geographical mobility - Moved from different state (%)
Geographical mobility - Moved from different state (%) - White
Geographical mobility - Moved from different state (%) - Black or African American
Geographical mobility - Moved from different state (%) - Asian
Geographical mobility - Moved from different state (%) - Hispanic or Latino
Geographical mobility - Moved from different state (%) - American Indian and Alaska Native
Geographical mobility - Moved from different state (%) - Multirace
Geographical mobility - Moved from different state (%) - Other Race
Geographical mobility - Moved from abroad (%)
Geographical mobility - Moved from abroad (%) - White
Geographical mobility - Moved from abroad (%) - Black or African American
Geographical mobility - Moved from abroad (%) - Asian
Geographical mobility - Moved from abroad (%) - Hispanic or Latino
Geographical mobility - Moved from abroad (%) - American Indian and Alaska Native
Geographical mobility - Moved from abroad (%) - Multirace
Geographical mobility - Moved from abroad (%) - Other Race
Place of birth for the foreign-born population - Ireland (%)
Place of birth for the foreign-born population - Denmark (%)
Place of birth for the foreign-born population - Norway (%)
Place of birth for the foreign-born population - Sweden (%)
Place of birth for the foreign-born population - United Kingdom (%)
Place of birth for the foreign-born population - England (%)
Place of birth for the foreign-born population - Scotland (%)
Place of birth for the foreign-born population - Other Northern Europe (%)
Place of birth for the foreign-born population - Austria (%)
Place of birth for the foreign-born population - Belgium (%)
Place of birth for the foreign-born population - France (%)
Place of birth for the foreign-born population - Germany (%)
Place of birth for the foreign-born population - Netherlands (%)
Place of birth for the foreign-born population - Switzerland (%)
Place of birth for the foreign-born population - Other Western Europe (%)
Place of birth for the foreign-born population - Greece (%)
Place of birth for the foreign-born population - Italy (%)
Place of birth for the foreign-born population - Portugal (%)
Place of birth for the foreign-born population - Spain (%)
Place of birth for the foreign-born population - Other Southern Europe (%)
Place of birth for the foreign-born population - Albania (%)
Place of birth for the foreign-born population - Belarus (%)
Place of birth for the foreign-born population - Bosnia and Herzegovina (%)
Place of birth for the foreign-born population - Bulgaria (%)
Place of birth for the foreign-born population - Croatia (%)
Place of birth for the foreign-born population - Czechoslovakia (%)
Place of birth for the foreign-born population - Hungary (%)
Place of birth for the foreign-born population - Latvia (%)
Place of birth for the foreign-born population - Lithuania (%)
Place of birth for the foreign-born population - North Macedonia (Macedonia) (%)
Place of birth for the foreign-born population - Moldova (%)
Place of birth for the foreign-born population - Poland (%)
Place of birth for the foreign-born population - Romania (%)
Place of birth for the foreign-born population - Russia (%)
Place of birth for the foreign-born population - Serbia (%)
Place of birth for the foreign-born population - Ukraine (%)
Place of birth for the foreign-born population - Other Eastern Europe (%)
Place of birth for the foreign-born population - China (%)
Place of birth for the foreign-born population - Hong Kong (%)
Place of birth for the foreign-born population - Taiwan (%)
Place of birth for the foreign-born population - Japan (%)
Place of birth for the foreign-born population - Korea (%)
Place of birth for the foreign-born population - Other Eastern Asia (%)
Place of birth for the foreign-born population - Afghanistan (%)
Place of birth for the foreign-born population - Bangladesh (%)
Place of birth for the foreign-born population - India (%)
Place of birth for the foreign-born population - Iran (%)
Place of birth for the foreign-born population - Kazakhstan (%)
Place of birth for the foreign-born population - Nepal (%)
Place of birth for the foreign-born population - Pakistan (%)
Place of birth for the foreign-born population - Sri Lanka (%)
Place of birth for the foreign-born population - Uzbekistan (%)
Place of birth for the foreign-born population - Other South Central Asia (%)
Place of birth for the foreign-born population - Burma (%)
Place of birth for the foreign-born population - Cambodia (%)
Place of birth for the foreign-born population - Indonesia (%)
Place of birth for the foreign-born population - Laos (%)
Place of birth for the foreign-born population - Malaysia (%)
Place of birth for the foreign-born population - Philippines (%)
Place of birth for the foreign-born population - Singapore (%)
Place of birth for the foreign-born population - Thailand (%)
Place of birth for the foreign-born population - Vietnam (%)
Place of birth for the foreign-born population - Other South Eastern Asia (%)
Place of birth for the foreign-born population - Armenia (%)
Place of birth for the foreign-born population - Iraq (%)
Place of birth for the foreign-born population - Israel (%)
Place of birth for the foreign-born population - Jordan (%)
Place of birth for the foreign-born population - Kuwait (%)
Place of birth for the foreign-born population - Lebanon (%)
Place of birth for the foreign-born population - Saudi Arabia (%)
Place of birth for the foreign-born population - Syria (%)
Place of birth for the foreign-born population - Turkey (%)
Place of birth for the foreign-born population - Yemen (%)
Place of birth for the foreign-born population - Other Western Asia (%)
Place of birth for the foreign-born population - Eritrea (%)
Place of birth for the foreign-born population - Ethiopia (%)
Place of birth for the foreign-born population - Kenya (%)
Place of birth for the foreign-born population - Somalia (%)
Place of birth for the foreign-born population - Uganda (%)
Place of birth for the foreign-born population - Zimbabwe (%)
Place of birth for the foreign-born population - Other Eastern Africa (%)
Place of birth for the foreign-born population - Cameroon (%)
Place of birth for the foreign-born population - Congo (%)
Place of birth for the foreign-born population - Democratic Republic of Congo (Zaire) (%)
Place of birth for the foreign-born population - Other Middle Africa (%)
Place of birth for the foreign-born population - Egypt (%)
Place of birth for the foreign-born population - Morocco (%)
Place of birth for the foreign-born population - Sudan (%)
Place of birth for the foreign-born population - Other Northern Africa (%)
Place of birth for the foreign-born population - South Africa (%)
Place of birth for the foreign-born population - Other Southern Africa (%)
Place of birth for the foreign-born population - Cabo Verde (%)
Place of birth for the foreign-born population - Ghana (%)
Place of birth for the foreign-born population - Liberia (%)
Place of birth for the foreign-born population - Nigeria (%)
Place of birth for the foreign-born population - Senegal (%)
Place of birth for the foreign-born population - Sierra Leone (%)
Place of birth for the foreign-born population - Other Western Africa (%)
Place of birth for the foreign-born population - Australia (%)
Place of birth for the foreign-born population - New Zealand (%)
Place of birth for the foreign-born population - Fiji (%)
Place of birth for the foreign-born population - Micronesia (%)
Place of birth for the foreign-born population - Bahamas (%)
Place of birth for the foreign-born population - Barbados (%)
Place of birth for the foreign-born population - Cuba (%)
Place of birth for the foreign-born population - Dominica (%)
Place of birth for the foreign-born population - Dominican Republic (%)
Place of birth for the foreign-born population - Grenada (%)
Place of birth for the foreign-born population - Haiti (%)
Place of birth for the foreign-born population - Jamaica (%)
Place of birth for the foreign-born population - St. Vincent and the Grenadines (%)
Place of birth for the foreign-born population - Trinidad and Tobago (%)
Place of birth for the foreign-born population - West Indies (%)
Place of birth for the foreign-born population - Other Caribbean (%)
Place of birth for the foreign-born population - Belize (%)
Place of birth for the foreign-born population - Costa Rica (%)
Place of birth for the foreign-born population - El Salvador (%)
Place of birth for the foreign-born population - Guatemala (%)
Place of birth for the foreign-born population - Honduras (%)
Place of birth for the foreign-born population - Mexico (%)
Place of birth for the foreign-born population - Nicaragua (%)
Place of birth for the foreign-born population - Panama (%)
Place of birth for the foreign-born population - Other Central America (%)
Place of birth for the foreign-born population - Argentina (%)
Place of birth for the foreign-born population - Bolivia (%)
Place of birth for the foreign-born population - Brazil (%)
Place of birth for the foreign-born population - Chile (%)
Place of birth for the foreign-born population - Colombia (%)
Place of birth for the foreign-born population - Ecuador (%)
Place of birth for the foreign-born population - Guyana (%)
Place of birth for the foreign-born population - Peru (%)
Place of birth for the foreign-born population - Uruguay (%)
Place of birth for the foreign-born population - Venezuela (%)
Place of birth for the foreign-born population - Other South America (%)
Place of birth for the foreign-born population - Canada (%)
Place of birth for the foreign-born population - Other Northern America (%)
Place of birth for the foreign-born population - Other (%)
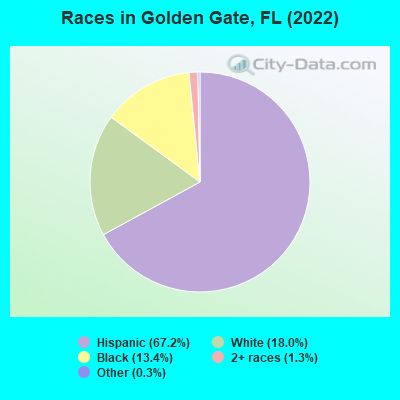
According to 2022 data, the most numerous races in Golden Gate, FL are White alone (5,548 residents), Hispanic (20,674 residents), and Black alone (4,117 residents). 28.8% of Golden Gate residents speak English at home. 49.8% of Golden Gate, FL residents are foreign-born (48.7% born in Latin America), which is 57.8% greater than the foreign-born rate of 21.0% across the entire state of Florida.
Race distribution in Golden Gate
2000 2022
10,458,509 65.4% White alone 2,682,715 16.8% Hispanic 2,264,268 14.2% Black alone 261,693 1.6% Asian alone 236,954 1.5% Two or more races 42,358 0.3% American Indian alone 28,994 0.2% Other race alone 6,887 0.04% Native Hawaiian and Other
11,309,403 50.8% White alone 6,025,039 27.1% Hispanic 3,241,015 14.6% Black alone 861,630 3.9% Two or more races 623,692 2.8% Asian alone 152,054 0.7% Other race alone 22,504 0.1% American Indian alone 9,486 0.04% Native Hawaiian and Other
Income and house value in Golden Gate Median household income in 2022 $44,056 White non-Hispanic householders$83,442 Black householders$74,911 American Indian and Alaska Native householders$68,472 Some other race householders$60,943 Two or more races householders$65,142 Hispanic or Latino race householdersMedian 2022 house value $394,723 White Non-Hispanic householders$392,284 Black or African American householders $345,535 Asian householders$368,300 Some other race householders$389,845 Two or more races householders$394,723 Hispanic or Latino householders
Median age by race in Golden Gate
39.0 Median age for White residents39.1 39.6 37.3 Median age for Black or African American residents37.2 33.0 21.8 Median age for American Indian / Alaska Native residents25.4 21.3 -693,674,484.0 Median age for Asian residents-700,515,083.9 -697,158,696.5 -679,849,340.2 Median age for Native Hawaiian / Pacific Islander residents-858,307,848.3 -666,666,666.0 30.6 Median age for Other race residents37.6 27.8 34.5 Median age for Two or more races residents36.3 30.7 47.9 Median age for White alone residents48.0 47.6 35.1 Median age for Hispanic or Latino residents37.1 30.6
Owner/renter occupied households by race in Golden Gate
House owners and renters - White residents 2,456 62.2% Owner occupied1,494 37.8% Renter occupiedHouse owners and renters - Black or African American residents 738 56.6% Owner occupied566 43.4% Renter occupiedHouse owners and renters - American Indian / Alaska Native residents 144 100.0% Renter occupiedHouse owners and renters - Other race residents 290 43.9% Owner occupied370 56.1% Renter occupiedHouse owners and renters - Two or more races residents 1,806 47.1% Owner occupied2,026 52.9% Renter occupiedHouse owners and renters - White alone residents 1,578 69.4% Owner occupied696 30.6% Renter occupiedHouse owners and renters - Hispanic or Latino residents 2,503 46.8% Owner occupied2,850 53.2% Renter occupied
Language usage in Golden Gate
English speakers - Total 28.8% of residents of Golden Gate speak English at home.
62.4% of residents speak Spanish at home 8,106 45.6% Speak English very well9,675 54.4% Speak English less than very well10.3% of residents speak other language at home 2,057 70.3% Speak English very well871 29.7% Speak English less than very well
English speakers - Born in the United States 78.0% of residents of Golden Gate speak English at home.
19.6% of residents speak Spanish at home 904 97.7% Speak English very well21 2.3% Speak English less than very well1.5% of residents speak other language at home 73 100.0% Speak English very well
English speakers - Native, born elsewhere 29.8% of residents of Golden Gate speak English at home.
75.6% of residents speak Spanish at home 593 41.6% Speak English very well831 58.4% Speak English less than very well1.9% of residents speak other language at home 36 100.0% Speak English very well
English speakers - Foreign-born 3.8% of residents of Golden Gate speak English at home.
84.4% of residents speak Spanish at home 3,752 29.7% Speak English very well8,866 70.3% Speak English less than very well14.2% of residents speak other language at home 1,273 60.0% Speak English very well847 40.0% Speak English less than very well
White (Caucasian) - Speak only English Native:
75.6% (5,176)Foreign-born:
4.4% (132)
White (Caucasian) - Speak another language Native:
16.8% (1,153)Foreign-born:
77.7% (2,325)
Black or African American - Speak only English Native:
66.0% (1,320)Foreign-born:
2.6% (54)
Black or African American - Speak another language Native:
33.6% (673)Foreign-born:
100.0% (2,058)
American Indian / Alaska Native - Speak another language Native:
100.0% (176)Foreign-born:
100.0% (663)
Other race - Speak only English Native:
18.0% (165)Foreign-born:
3.2% (48)
Other race - Speak another language Native:
82.0% (753)Foreign-born:
94.6% (1,432)
Two or more races - Speak only English Native:
29.5% (1,337)Foreign-born:
4.1% (383)
Two or more races - Speak another language Native:
69.7% (3,158)Foreign-born:
96.2% (8,958)
White alone - Speak only English Native:
94.5% (4,799)Foreign-born:
45.1% (125)
White alone - Speak another language Native:
6.0% (304)Foreign-born:
54.8% (152)
Hispanic or Latino - Speak only English Native:
23.5% (1,462)Foreign-born:
2.7% (336)
Hispanic or Latino - Speak another language Native:
76.1% (4,740)Foreign-born:
96.9% (12,293)
Foreign-born residents in Golden Gate 15,319 residents are foreign born (48.7% Latin America ).
This city:
49.8%Florida:
21.1%
Marital status for residents in Golden Gate Marital status - White (Caucasian) population 15 years and over
Males 44.5% Never married38.7% Now married5.0% Separated2.9% Widowed8.9% DivorcedFemales 27.0% Never married36.9% Now married4.7% Separated10.2% Widowed21.2% DivorcedWomen who gave birth in the past 12 months Now married:
13.7% (21)Unmarried:
86.3% (133)
Women who did not give birth in the past 12 months Now married:
36.0% (738)Unmarried:
64.0% (1,309)
Marital status - Black or African American population 15 years and over
Males 45.8% Never married39.3% Now married7.4% Separated0.0% Widowed7.4% DivorcedFemales 53.2% Never married35.4% Now married2.1% Separated4.4% Widowed4.8% DivorcedWomen who gave birth in the past 12 months Now married:
78.7% (48)Unmarried:
21.3% (13)
Women who did not give birth in the past 12 months Now married:
24.9% (228)Unmarried:
75.1% (685)
Marital status - American Indian / Alaska Native population 15 years and over
Males 39.9% Never married60.1% Now married0.0% Separated0.0% Widowed0.0% DivorcedFemales 60.0% Never married40.0% Now married0.0% Separated0.0% Widowed0.0% DivorcedWomen who gave birth in the past 12 months Now married:
100.0% (75)Unmarried:
0.0% (0)
Women who did not give birth in the past 12 months Now married:
13.5% (38)Unmarried:
86.5% (241)
Marital status - Other race population 15 years and over
Males 25.4% Never married70.2% Now married0.0% Separated0.0% Widowed4.4% DivorcedFemales 49.8% Never married44.0% Now married1.3% Separated0.0% Widowed5.0% DivorcedWomen who gave birth in the past 12 months Now married:
66.7% (11)Unmarried:
33.3% (5)
Women who did not give birth in the past 12 months Now married:
35.3% (322)Unmarried:
64.7% (589)
Marital status - Two or more races population 15 years and over
Males 50.2% Never married44.2% Now married0.0% Separated1.4% Widowed4.2% DivorcedFemales 35.4% Never married47.6% Now married4.2% Separated2.9% Widowed9.8% DivorcedWomen who gave birth in the past 12 months Now married:
43.9% (147)Unmarried:
56.1% (188)
Women who did not give birth in the past 12 months Now married:
54.5% (1,797)Unmarried:
45.5% (1,500)
Marital status - White alone, not Hispanic / Latino population 15 years and over
Males 43.6% Never married35.7% Now married1.7% Separated7.2% Widowed11.7% DivorcedFemales 28.5% Never married33.4% Now married4.5% Separated9.7% Widowed23.9% DivorcedWomen who gave birth in the past 12 months Now married:
13.7% (13)Unmarried:
86.3% (82)
Women who did not give birth in the past 12 months Now married:
30.3% (313)Unmarried:
69.7% (721)
Marital status - Hispanic or Latino population 15 years and over
Males 45.5% Never married45.9% Now married2.8% Separated0.7% Widowed5.1% DivorcedFemales 35.4% Never married43.9% Now married3.7% Separated5.4% Widowed11.6% DivorcedWomen who gave birth in the past 12 months Now married:
44.0% (169)Unmarried:
56.0% (215)
Women who did not give birth in the past 12 months Now married:
44.1% (2,080)Unmarried:
55.9% (2,637)
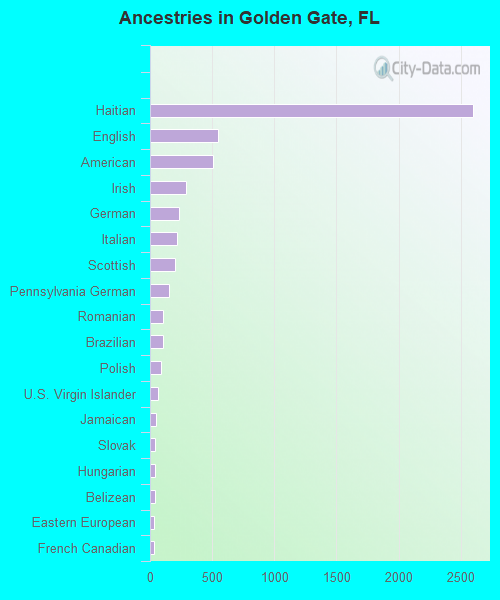
Ancestries in Golden Gate
2,598 14.6% Haitian548 3.1% English505 2.8% American288 1.6% Irish235 1.3% German214 1.2% Italian199 1.1% Scottish155 0.9% Pennsylvania German104 0.6% Romanian101 0.6% Brazilian86 0.5% Polish64 0.4% U.S. Virgin Islander52 0.3% Jamaican42 0.2% Slovak41 0.2% Hungarian41 0.2% Belizean36 0.2% Eastern European34 0.2% French Canadian20 0.1% Swiss20 0.1% Ukrainian16 0.09% Danish16 0.09% Yugoslavian15 0.08% Czech15 0.08% Swedish14 0.08% European14 0.08% Israeli13 0.07% Czechoslovakian12 0.07% Norwegian12 0.07% Turkish2 0.01% African
Geographical mobility in Golden Gate Same house 1 year ago 10,819 90.8% White (Caucasian)3,832 90.7% Black or African American772 100.0% American Indian / Alaska Native21 100.0% Asian2,967 94.1% Other race13,240 91.9% Two or more races5,377 97.7% White alone, not Hispanic / Latino18,741 92.5% Hispanic or LatinoMoved within same county 477 4.0% White / Caucasian253 6.0% Black or African American168 5.3% Other race554 3.8% Two or more races84 1.5% White alone, not Hispanic / Latino578 2.9% Hispanic or LatinoMoved within same state 262 2.2% White / Caucasian130 3.1% Black or African American255 1.8% Two or more races22 0.4% White alone, not Hispanic / Latino306 1.5% Hispanic or LatinoMoved from different state 126 1.1% White / Caucasian2 0.0% Black or African American24 0.2% Two or more races106 1.9% White alone, not Hispanic / Latino60 0.3% Hispanic or LatinoMoved from abroad 321 2.7% White28 0.7% Black or African American306 2.1% Two or more races26 0.5% White alone, not Hispanic / Latino654 3.2% Hispanic or Latino
Children Nativity (place of birth) in Golden Gate
Children under 6 years - Living with two parents Both parents native 319 100.0% NativeBoth parents foreign-born 594 78.7% Native161 21.3% Foreign-bornOne native, one foreign-born parent 451 100.0% NativeChildren under 6 years - Living with one parent Native parent 276 100.0% NativeForeign-born parent 586 90.2% Native63 9.8% Foreign-bornChildren 6 to 17 years - Living with two parents Both parents native 337 100.0% NativeBoth parents foreign-born 1,936 74.5% Native662 25.5% Foreign-bornOne native, one foreign-born parent 332 92.2% Native28 7.8% Foreign-bornChildren 6 to 17 years - Living with one parent Native parent 383 100.0% NativeForeign-born parent 554 59.8% Native373 40.2% Foreign-born
Grandparents responsible for own grandchildren in Golden Gate
Grandparents (30 to 59 years) White / Caucasian 68 31.9% Responsible for grandchildren146 68.1% Not responsible for grandchildrenBlack or African American 17 39.6% Responsible for grandchildren25 60.4% Not responsible for grandchildrenAmerican Indian / Alaska Native 110 100.0% Not responsible for grandchildrenTwo or more races 237 70.8% Responsible for grandchildren98 29.2% Not responsible for grandchildrenWhite alone, not Hispanic / Latino 16 100.0% Not responsible for grandchildrenHispanic or Latino 516 75.4% Responsible for grandchildren168 24.6% Not responsible for grandchildrenGrandparents (60 years and over) White / Caucasian 75 40.0% Responsible for grandchildren113 60.0% Not responsible for grandchildrenBlack or African American 22 20.9% Responsible for grandchildren82 79.1% Not responsible for grandchildrenTwo or more races 73 19.0% Responsible for grandchildren310 81.0% Not responsible for grandchildrenWhite alone, not Hispanic / Latino 81 100.0% Responsible for grandchildrenHispanic or Latino 43 14.6% Responsible for grandchildren255 85.4% Not responsible for grandchildren