Races in Glastonbury Center, Connecticut (CT) Detailed Stats
Ancestries, Foreign-born residents, place of birth
Settings
X


Discuss Glastonbury Center, Connecticut races on our local forum with over 2,400,000 registered users
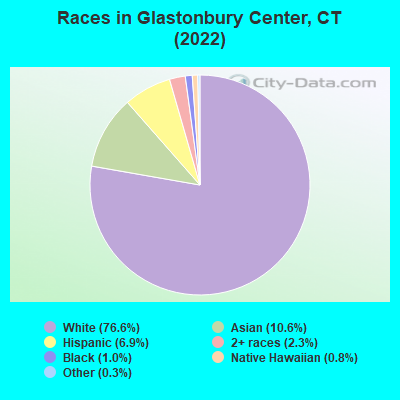
According to 2022 data, the most numerous races in Glastonbury Center, CT are White alone (6,119 residents), Hispanic (553 residents), and Black alone (77 residents). 81.2% of Glastonbury Center residents speak English at home. 17.2% of Glastonbury Center, CT residents are foreign-born (7.2% born in Asia, 4.6% born in Europe, 4.4% born in Latin America), which is 12.6% greater than the foreign-born rate of 15.0% across the entire state of Connecticut.
Race distribution in Glastonbury Center
2000
2022

- 6,72894.0%White alone
- 1842.6%Hispanic
- 1291.8%Asian alone
- 580.8%Black alone
- 420.6%Two or more races
- 110.2%American Indian alone
- 50.07%Other race alone

-
- 6,11976.6%White alone
- 84610.6%Asian alone
- 5536.9%Hispanic
- 1862.3%Two or more races
- 771.0%Black alone
- 650.8%Native Hawaiian and Other
Pacific Islander alone - 200.3%Other race alone
2000
2022
-
- 2,638,84577.5%White alone
- 320,3239.4%Hispanic
- 295,5718.7%Black alone
- 81,5642.4%Asian alone
- 52,8961.6%Two or more races
- 8,1410.2%Other race alone
- 7,2670.2%American Indian alone
- 9580.03%Native Hawaiian and Other
Pacific Islander alone

-
- 2,246,91362.0%White alone
- 658,97818.2%Hispanic
- 353,9739.8%Black alone
- 172,9294.8%Asian alone
- 159,6314.4%Two or more races
- 29,7610.8%Other race alone
- 3,4280.09%American Indian alone
- 5920.02%Native Hawaiian and Other
Pacific Islander alone

Income and house value in Glastonbury Center
- Median household income in 2022
- $101,166White non-Hispanic householders
- $48,139Two or more races householders
- Median 2022 house value
- $403,885White Non-Hispanic householders
- $311,149Asian householders
- $262,263Two or more races householders
- $288,489Hispanic or Latino householders
Household income for White non-Hispanic householders

Household income for Black householders

Household income for Asian householders

Household income for Some other race householders

Household income for Two or more races householders

Household income for Hispanic or Latino race householders

Median age by race in Glastonbury Center
- 53.2Median age for White residents
- 50.8Males
- 55.2Females
- 38.2Median age for Black or African American residents
- 34.9Males
- -681,159,419.6Females
- -742,173,111.6Median age for American Indian / Alaska Native residents
- -701,030,927.1Males
- -704,477,611.2Females
- 37.0Median age for Asian residents
- 39.9Males
- 35.5Females
- 15.4Median age for Native Hawaiian / Pacific Islander residents
- -414,239,481.8Males
- 16.0Females
- 51.5Median age for Other race residents
- -670,794,633.0Males
- -699,186,991.2Females
- 36.7Median age for Two or more races residents
- 13.3Males
- 60.7Females
- 53.6Median age for White alone residents
- 49.4Males
- 56.4Females
- 49.4Median age for Hispanic or Latino residents
- 54.1Males
- 49.4Females
Owner/renter occupied households by race in Glastonbury Center
- House owners and renters - White residents
- 2,27975.0%Owner occupied
- 76125.0%Renter occupied
- House owners and renters - Black or African American residents
- 2942.2%Owner occupied
- 4057.8%Renter occupied
- House owners and renters - Asian residents
- 8927.7%Owner occupied
- 23272.3%Renter occupied
- House owners and renters - Native Hawaiian / Pacific Islander residents
- 20100.0%Renter occupied
- House owners and renters - Other race residents
- 46100.0%Renter occupied
- House owners and renters - Two or more races residents
- 9171.9%Owner occupied
- 3628.1%Renter occupied
- House owners and renters - White alone residents
- 2,23974.3%Owner occupied
- 77325.7%Renter occupied
- House owners and renters - Hispanic or Latino residents
- 8846.7%Owner occupied
- 10053.3%Renter occupied
Language usage in Glastonbury Center
- English speakers - Total
- 81.2% of residents of Glastonbury Center speak English at home.
- 5.3% of residents speak Spanish at home
- 22655.8%Speak English very well
- 17944.2%Speak English less than very well
- 13.1% of residents speak other language at home
- 65966.0%Speak English very well
- 34034.0%Speak English less than very well
- English speakers - Born in the United States
- 93.6% of residents of Glastonbury Center speak English at home.
- 0.4% of residents speak Spanish at home
- 11100.0%Speak English very well
- 4.7% of residents speak other language at home
- 8976.7%Speak English very well
- 2723.3%Speak English less than very well
- English speakers - Native, born elsewhere
- 86.7% of residents of Glastonbury Center speak English at home.
- 19.9% of residents speak Spanish at home
- 3890.5%Speak English very well
- 49.5%Speak English less than very well
- English speakers - Foreign-born
- 22.4% of residents of Glastonbury Center speak English at home.
- 25.1% of residents speak Spanish at home
- 16148.1%Speak English very well
- 17451.9%Speak English less than very well
- 52.1% of residents speak other language at home
- 40357.8%Speak English very well
- 29442.2%Speak English less than very well
White (Caucasian) - Speak only English
| Native: | 97.3% (5,276) |
| Foreign-born: | 24.0% (127) |
White (Caucasian) - Speak another language
| Native: | 3.5% (188) |
| Foreign-born: | 74.7% (396) |
Black or African American - Speak only English
| Native: | 97.7% (70) |
| Foreign-born: | 100.0% (3) |
Asian - Speak only English
| Native: | 64.3% (144) |
| Foreign-born: | 22.0% (126) |
Asian - Speak another language
| Native: | 36.3% (81) |
| Foreign-born: | 77.6% (445) |
Other race - Speak only English
| Native: | 54.9% (7) |
| Foreign-born: | 32.7% (16) |
Other race - Speak another language
| Native: | 47.7% (6) |
| Foreign-born: | 62.3% (30) |
White alone - Speak only English
| Native: | 96.0% (5,255) |
| Foreign-born: | 30.6% (107) |
White alone - Speak another language
| Native: | 4.0% (220) |
| Foreign-born: | 69.3% (242) |
Hispanic or Latino - Speak only English
| Native: | 81.0% (162) |
| Foreign-born: | 6.7% (24) |
Hispanic or Latino - Speak another language
| Native: | 21.8% (44) |
| Foreign-born: | 93.1% (334) |
Foreign-born residents in Glastonbury Center
1,371 residents are foreign born (7.2% Asia, 4.6% Europe, 4.4% Latin America).
| This city: | 17.2% |
| Connecticut: | 15.0% |


Marital status for residents in Glastonbury Center
Marital status - White (Caucasian) population 15 years and over
- Males
- 20.7%Never married
- 66.1%Now married
- 0.0%Separated
- 4.4%Widowed
- 8.8%Divorced
- Females
- 30.8%Never married
- 41.4%Now married
- 1.4%Separated
- 11.9%Widowed
- 14.5%Divorced
Women who gave birth in the past 12 months
| Now married: | 100.0% (66) |
| Unmarried: | 0.0% (0) |
Women who did not give birth in the past 12 months
| Now married: | 33.8% (441) |
| Unmarried: | 66.2% (864) |
Marital status - Black or African American population 15 years and over
- Males
- 52.8%Never married
- 13.9%Now married
- 23.6%Separated
- 0.0%Widowed
- 9.7%Divorced
- Females
- 50.0%Never married
- 0.0%Now married
- 0.0%Separated
- 0.0%Widowed
- 50.0%Divorced
Marital status - Asian population 15 years and over
- Males
- 3.5%Never married
- 57.0%Now married
- 0.0%Separated
- 0.0%Widowed
- 39.5%Divorced
- Females
- 30.7%Never married
- 61.7%Now married
- 0.0%Separated
- 2.6%Widowed
- 4.9%Divorced
Women who did not give birth in the past 12 months
| Now married: | 49.4% (118) |
| Unmarried: | 50.6% (121) |
Marital status - Native Hawaiian / Pacific Islander population 15 years and over
- Males
- 100.0%Never married
- 0.0%Now married
- 0.0%Separated
- 0.0%Widowed
- 0.0%Divorced
- Females
- 100.0%Never married
- 0.0%Now married
- 0.0%Separated
- 0.0%Widowed
- 0.0%Divorced
Women who did not give birth in the past 12 months
| Now married: | 0.0% (0) |
| Unmarried: | 100.0% (37) |
Marital status - Other race population 15 years and over
- Males
- 100.0%Never married
- 0.0%Now married
- 0.0%Separated
- 0.0%Widowed
- 0.0%Divorced
- Females
- 25.0%Never married
- 0.0%Now married
- 0.0%Separated
- 0.0%Widowed
- 75.0%Divorced
Women who did not give birth in the past 12 months
| Now married: | 0.0% (0) |
| Unmarried: | 100.0% (6) |
Marital status - Two or more races population 15 years and over
- Males
- 52.9%Never married
- 47.1%Now married
- 0.0%Separated
- 0.0%Widowed
- 0.0%Divorced
- Females
- 29.9%Never married
- 24.3%Now married
- 0.0%Separated
- 17.8%Widowed
- 28.0%Divorced
Women who did not give birth in the past 12 months
| Now married: | 0.0% (0) |
| Unmarried: | 100.0% (49) |
Marital status - White alone, not Hispanic / Latino population 15 years and over
- Males
- 19.8%Never married
- 68.5%Now married
- 0.0%Separated
- 4.7%Widowed
- 7.0%Divorced
- Females
- 29.5%Never married
- 43.1%Now married
- 1.5%Separated
- 12.9%Widowed
- 13.0%Divorced
Women who gave birth in the past 12 months
| Now married: | 100.0% (70) |
| Unmarried: | 0.0% (0) |
Women who did not give birth in the past 12 months
| Now married: | 38.6% (445) |
| Unmarried: | 61.4% (707) |
Marital status - Hispanic or Latino population 15 years and over
- Males
- 40.1%Never married
- 32.5%Now married
- 0.0%Separated
- 0.0%Widowed
- 27.4%Divorced
- Females
- 50.6%Never married
- 16.1%Now married
- 0.0%Separated
- 0.0%Widowed
- 33.2%Divorced
Women who did not give birth in the past 12 months
| Now married: | 7.5% (21) |
| Unmarried: | 92.5% (260) |
Ancestries in Glastonbury Center

- 81520.3%Italian
- 60915.1%Irish
- 3558.8%Polish
- 1834.5%English
- 1684.2%European
- 1343.3%German
- 882.2%American
- 631.6%French Canadian
- 531.3%French
- 481.2%Albanian
- 290.7%Russian
- 230.6%Scottish
- 160.4%Welsh
- 140.3%British
- 140.3%Dutch
- 140.3%Portuguese
- 130.3%Canadian
- 110.3%Lithuanian
- 100.2%Northern European
- 100.2%Norwegian
- 100.2%Slovak
- 70.2%Eastern European
- 60.1%Scandinavian
- 30.07%Jamaican
- 20.05%African

Geographical mobility in Glastonbury Center

- Same house 1 year ago
- 5,33786.6%White (Caucasian)
- 2026.6%Black or African American
- 59469.6%Asian
- 5693.5%Other race
- 26482.2%Two or more races
- 5,36789.1%White alone, not Hispanic / Latino
- 27650.0%Hispanic or Latino

-
- Moved within same county
- 5549.0%White / Caucasian
- 3241.6%Black or African American
- 9811.5%Asian
- 46.7%Other race
- 4815.1%Two or more races
- 4186.9%White alone, not Hispanic / Latino
- 21138.3%Hispanic or Latino

-
- Moved within same state
- 410.7%White / Caucasian
- 10512.4%Asian
- 430.7%White alone, not Hispanic / Latino

-
- Moved from different state
- 1252.0%White / Caucasian
- 2836.4%Black or African American
- 425.0%Asian
- 8199.3%Native Hawaiian / Pacific Islander
- 20.5%Two or more races
- 1282.1%White alone, not Hispanic / Latino
- 10.3%Hispanic or Latino

-
- Moved from abroad
- 210.3%White
- 220.4%White alone, not Hispanic / Latino

Children Nativity (place of birth) in Glastonbury Center
Place of birth for residents in Glastonbury Center
![Place of birth for the foreign-born population - Regions]()
- 601Asia
- 409South Central Asia
- 386Europe
- 383Americas
- 370Latin America
- 253Caribbean
- 180Eastern Asia
- 158China
- 146Southern Europe
- 131Eastern Europe
- 70Central America
- 55Western Europe
- 52Northern Europe
- 47South America
- 12South Eastern Asia
- 12Northern America

![Place of birth for the foreign-born population - Countries]()
- 409India
- 212Dominican Republic
- 133China
- 130Italy
- 59Poland
- 55Germany
- 54Albania
- 48United Kingdom
- 45Costa Rica
- 28Colombia
- 25Panama
- 24Taiwan
- 21Korea
- 21Cuba
- 18Jamaica
- 18Ecuador
- 15Portugal
- 12Canada
- 7Vietnam
- 5Philippines
- 4Ireland

Grandparents responsible for own grandchildren in Glastonbury Center
Zip codes: 06033.