Races in Gibsonton, Florida (FL) Detailed Stats
Data:
Races - White alone (%)
Races - White alone (% change since 2000)
Races - Black alone (%)
Races - Black alone (% change since 2000)
Races - American Indian alone (%)
Races - American Indian alone (% change since 2000)
Races - Asian alone (%)
Races - Asian alone (% change since 2000)
Races - Hispanic (%)
Races - Hispanic (% change since 2000)
Races - Native Hawaiian and Other Pacific Islander alone (%)
Races - Native Hawaiian and Other Pacific Islander alone (% change since 2000)
Races - Two or more races(%)
Races - Two or more races(% change since 2000)
Races - Other race alone (%)
Races - Other race alone (% change since 2000)
Racial diversity
Place of birth - Born in state of residence (%)
Place of birth - Born in state of residence (%) - White
Place of birth - Born in state of residence (%) - Black or African American
Place of birth - Born in state of residence (%) - Asian
Place of birth - Born in state of residence (%) - Hispanic or Latino
Place of birth - Born in state of residence (%) - American Indian and Alaska Native
Place of birth - Born in state of residence (%) - Multirace
Place of birth - Born in state of residence (%) - Other Race
Place of birth - Born in other state (%)
Place of birth - Born in other state (%) - White
Place of birth - Born in other state (%) - Black or African American
Place of birth - Born in other state (%) - Asian
Place of birth - Born in other state (%) - Hispanic or Latino
Place of birth - Born in other state (%) - American Indian and Alaska Native
Place of birth - Born in other state (%) - Multirace
Place of birth - Born in other state (%) - Other Race
Place of birth - Native, outside of US (%)
Place of birth - Native, outside of US (%) - White
Place of birth - Native, outside of US (%) - Black or African American
Place of birth - Native, outside of US (%) - Asian
Place of birth - Native, outside of US (%) - Hispanic or Latino
Place of birth - Native, outside of US (%) - American Indian and Alaska Native
Place of birth - Native, outside of US (%) - Multirace
Place of birth - Native, outside of US (%) - Other Race
Place of birth - Foreign born (%)
Place of birth - Foreign born (%) - White
Place of birth - Foreign born (%) - Black or African American
Place of birth - Foreign born (%) - Asian
Place of birth - Foreign born (%) - Hispanic or Latino
Place of birth - Foreign born (%) - American Indian and Alaska Native
Place of birth - Foreign born (%) - Multirace
Place of birth - Foreign born (%) - Other Race
Residents speaking English at home (%)
Residents speaking English at home - Born in the United States (%)
Residents speaking English at home - Native, born elsewhere (%)
Residents speaking English at home - Foreign born (%)
Residents speaking Spanish at home (%)
Residents speaking Spanish at home - Born in the United States (%)
Residents speaking Spanish at home - Native, born elsewhere (%)
Residents speaking Spanish at home - Foreign born (%)
Residents speaking other language at home (%)
Residents speaking other language at home - Born in the United States (%)
Residents speaking other language at home - Native, born elsewhere (%)
Residents speaking other language at home - Foreign born (%)
Marital status - Never married (%)
Marital status - Now married (%)
Marital status - Separated (%)
Marital status - Widowed (%)
Marital status - Divorced (%)
Ancestries Reported - Arab (%)
Ancestries Reported - Czech (%)
Ancestries Reported - Danish (%)
Ancestries Reported - Dutch (%)
Ancestries Reported - English (%)
Ancestries Reported - French (%)
Ancestries Reported - French Canadian (%)
Ancestries Reported - German (%)
Ancestries Reported - Greek (%)
Ancestries Reported - Hungarian (%)
Ancestries Reported - Irish (%)
Ancestries Reported - Italian (%)
Ancestries Reported - Lithuanian (%)
Ancestries Reported - Norwegian (%)
Ancestries Reported - Polish (%)
Ancestries Reported - Portuguese (%)
Ancestries Reported - Russian (%)
Ancestries Reported - Scotch-Irish (%)
Ancestries Reported - Scottish (%)
Ancestries Reported - Slovak (%)
Ancestries Reported - Subsaharan African (%)
Ancestries Reported - Swedish (%)
Ancestries Reported - Swiss (%)
Ancestries Reported - Ukrainian (%)
Ancestries Reported - United States (%)
Ancestries Reported - Welsh (%)
Ancestries Reported - West Indian (%)
Ancestries Reported - Other (%)
Geographical mobility - Same house 1 year ago (%)
Geographical mobility - Same house 1 year ago (%) - White
Geographical mobility - Same house 1 year ago (%) - Black or African American
Geographical mobility - Same house 1 year ago (%) - Asian
Geographical mobility - Same house 1 year ago (%) - Hispanic or Latino
Geographical mobility - Same house 1 year ago (%) - American Indian and Alaska Native
Geographical mobility - Same house 1 year ago (%) - Multirace
Geographical mobility - Same house 1 year ago (%) - Other Race
Geographical mobility - Moved within same county (%)
Geographical mobility - Moved within same county (%) - White
Geographical mobility - Moved within same county (%) - Black or African American
Geographical mobility - Moved within same county (%) - Asian
Geographical mobility - Moved within same county (%) - Hispanic or Latino
Geographical mobility - Moved within same county (%) - American Indian and Alaska Native
Geographical mobility - Moved within same county (%) - Multirace
Geographical mobility - Moved within same county (%) - Other Race
Geographical mobility - Moved from different county within same state (%)
Geographical mobility - Moved from different county within same state (%) - White
Geographical mobility - Moved from different county within same state (%) - Black or African American
Geographical mobility - Moved from different county within same state (%) - Asian
Geographical mobility - Moved from different county within same state (%) - Hispanic or Latino
Geographical mobility - Moved from different county within same state (%) - American Indian and Alaska Native
Geographical mobility - Moved from different county within same state (%) - Multirace
Geographical mobility - Moved from different county within same state (%) - Other Race
Geographical mobility - Moved from different state (%)
Geographical mobility - Moved from different state (%) - White
Geographical mobility - Moved from different state (%) - Black or African American
Geographical mobility - Moved from different state (%) - Asian
Geographical mobility - Moved from different state (%) - Hispanic or Latino
Geographical mobility - Moved from different state (%) - American Indian and Alaska Native
Geographical mobility - Moved from different state (%) - Multirace
Geographical mobility - Moved from different state (%) - Other Race
Geographical mobility - Moved from abroad (%)
Geographical mobility - Moved from abroad (%) - White
Geographical mobility - Moved from abroad (%) - Black or African American
Geographical mobility - Moved from abroad (%) - Asian
Geographical mobility - Moved from abroad (%) - Hispanic or Latino
Geographical mobility - Moved from abroad (%) - American Indian and Alaska Native
Geographical mobility - Moved from abroad (%) - Multirace
Geographical mobility - Moved from abroad (%) - Other Race
Place of birth for the foreign-born population - Ireland (%)
Place of birth for the foreign-born population - Denmark (%)
Place of birth for the foreign-born population - Norway (%)
Place of birth for the foreign-born population - Sweden (%)
Place of birth for the foreign-born population - United Kingdom (%)
Place of birth for the foreign-born population - England (%)
Place of birth for the foreign-born population - Scotland (%)
Place of birth for the foreign-born population - Other Northern Europe (%)
Place of birth for the foreign-born population - Austria (%)
Place of birth for the foreign-born population - Belgium (%)
Place of birth for the foreign-born population - France (%)
Place of birth for the foreign-born population - Germany (%)
Place of birth for the foreign-born population - Netherlands (%)
Place of birth for the foreign-born population - Switzerland (%)
Place of birth for the foreign-born population - Other Western Europe (%)
Place of birth for the foreign-born population - Greece (%)
Place of birth for the foreign-born population - Italy (%)
Place of birth for the foreign-born population - Portugal (%)
Place of birth for the foreign-born population - Spain (%)
Place of birth for the foreign-born population - Other Southern Europe (%)
Place of birth for the foreign-born population - Albania (%)
Place of birth for the foreign-born population - Belarus (%)
Place of birth for the foreign-born population - Bosnia and Herzegovina (%)
Place of birth for the foreign-born population - Bulgaria (%)
Place of birth for the foreign-born population - Croatia (%)
Place of birth for the foreign-born population - Czechoslovakia (%)
Place of birth for the foreign-born population - Hungary (%)
Place of birth for the foreign-born population - Latvia (%)
Place of birth for the foreign-born population - Lithuania (%)
Place of birth for the foreign-born population - North Macedonia (Macedonia) (%)
Place of birth for the foreign-born population - Moldova (%)
Place of birth for the foreign-born population - Poland (%)
Place of birth for the foreign-born population - Romania (%)
Place of birth for the foreign-born population - Russia (%)
Place of birth for the foreign-born population - Serbia (%)
Place of birth for the foreign-born population - Ukraine (%)
Place of birth for the foreign-born population - Other Eastern Europe (%)
Place of birth for the foreign-born population - China (%)
Place of birth for the foreign-born population - Hong Kong (%)
Place of birth for the foreign-born population - Taiwan (%)
Place of birth for the foreign-born population - Japan (%)
Place of birth for the foreign-born population - Korea (%)
Place of birth for the foreign-born population - Other Eastern Asia (%)
Place of birth for the foreign-born population - Afghanistan (%)
Place of birth for the foreign-born population - Bangladesh (%)
Place of birth for the foreign-born population - India (%)
Place of birth for the foreign-born population - Iran (%)
Place of birth for the foreign-born population - Kazakhstan (%)
Place of birth for the foreign-born population - Nepal (%)
Place of birth for the foreign-born population - Pakistan (%)
Place of birth for the foreign-born population - Sri Lanka (%)
Place of birth for the foreign-born population - Uzbekistan (%)
Place of birth for the foreign-born population - Other South Central Asia (%)
Place of birth for the foreign-born population - Burma (%)
Place of birth for the foreign-born population - Cambodia (%)
Place of birth for the foreign-born population - Indonesia (%)
Place of birth for the foreign-born population - Laos (%)
Place of birth for the foreign-born population - Malaysia (%)
Place of birth for the foreign-born population - Philippines (%)
Place of birth for the foreign-born population - Singapore (%)
Place of birth for the foreign-born population - Thailand (%)
Place of birth for the foreign-born population - Vietnam (%)
Place of birth for the foreign-born population - Other South Eastern Asia (%)
Place of birth for the foreign-born population - Armenia (%)
Place of birth for the foreign-born population - Iraq (%)
Place of birth for the foreign-born population - Israel (%)
Place of birth for the foreign-born population - Jordan (%)
Place of birth for the foreign-born population - Kuwait (%)
Place of birth for the foreign-born population - Lebanon (%)
Place of birth for the foreign-born population - Saudi Arabia (%)
Place of birth for the foreign-born population - Syria (%)
Place of birth for the foreign-born population - Turkey (%)
Place of birth for the foreign-born population - Yemen (%)
Place of birth for the foreign-born population - Other Western Asia (%)
Place of birth for the foreign-born population - Eritrea (%)
Place of birth for the foreign-born population - Ethiopia (%)
Place of birth for the foreign-born population - Kenya (%)
Place of birth for the foreign-born population - Somalia (%)
Place of birth for the foreign-born population - Uganda (%)
Place of birth for the foreign-born population - Zimbabwe (%)
Place of birth for the foreign-born population - Other Eastern Africa (%)
Place of birth for the foreign-born population - Cameroon (%)
Place of birth for the foreign-born population - Congo (%)
Place of birth for the foreign-born population - Democratic Republic of Congo (Zaire) (%)
Place of birth for the foreign-born population - Other Middle Africa (%)
Place of birth for the foreign-born population - Egypt (%)
Place of birth for the foreign-born population - Morocco (%)
Place of birth for the foreign-born population - Sudan (%)
Place of birth for the foreign-born population - Other Northern Africa (%)
Place of birth for the foreign-born population - South Africa (%)
Place of birth for the foreign-born population - Other Southern Africa (%)
Place of birth for the foreign-born population - Cabo Verde (%)
Place of birth for the foreign-born population - Ghana (%)
Place of birth for the foreign-born population - Liberia (%)
Place of birth for the foreign-born population - Nigeria (%)
Place of birth for the foreign-born population - Senegal (%)
Place of birth for the foreign-born population - Sierra Leone (%)
Place of birth for the foreign-born population - Other Western Africa (%)
Place of birth for the foreign-born population - Australia (%)
Place of birth for the foreign-born population - New Zealand (%)
Place of birth for the foreign-born population - Fiji (%)
Place of birth for the foreign-born population - Micronesia (%)
Place of birth for the foreign-born population - Bahamas (%)
Place of birth for the foreign-born population - Barbados (%)
Place of birth for the foreign-born population - Cuba (%)
Place of birth for the foreign-born population - Dominica (%)
Place of birth for the foreign-born population - Dominican Republic (%)
Place of birth for the foreign-born population - Grenada (%)
Place of birth for the foreign-born population - Haiti (%)
Place of birth for the foreign-born population - Jamaica (%)
Place of birth for the foreign-born population - St. Vincent and the Grenadines (%)
Place of birth for the foreign-born population - Trinidad and Tobago (%)
Place of birth for the foreign-born population - West Indies (%)
Place of birth for the foreign-born population - Other Caribbean (%)
Place of birth for the foreign-born population - Belize (%)
Place of birth for the foreign-born population - Costa Rica (%)
Place of birth for the foreign-born population - El Salvador (%)
Place of birth for the foreign-born population - Guatemala (%)
Place of birth for the foreign-born population - Honduras (%)
Place of birth for the foreign-born population - Mexico (%)
Place of birth for the foreign-born population - Nicaragua (%)
Place of birth for the foreign-born population - Panama (%)
Place of birth for the foreign-born population - Other Central America (%)
Place of birth for the foreign-born population - Argentina (%)
Place of birth for the foreign-born population - Bolivia (%)
Place of birth for the foreign-born population - Brazil (%)
Place of birth for the foreign-born population - Chile (%)
Place of birth for the foreign-born population - Colombia (%)
Place of birth for the foreign-born population - Ecuador (%)
Place of birth for the foreign-born population - Guyana (%)
Place of birth for the foreign-born population - Peru (%)
Place of birth for the foreign-born population - Uruguay (%)
Place of birth for the foreign-born population - Venezuela (%)
Place of birth for the foreign-born population - Other South America (%)
Place of birth for the foreign-born population - Canada (%)
Place of birth for the foreign-born population - Other Northern America (%)
Place of birth for the foreign-born population - Other (%)
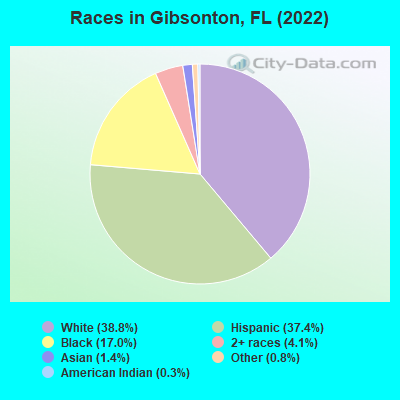
According to 2022 data, the most numerous races in Gibsonton, FL are White alone (7,152 residents), Hispanic (6,896 residents), and Black alone (3,134 residents). 66.7% of Gibsonton residents speak English at home. 15.5% of Gibsonton, FL residents are foreign-born (12.4% born in Latin America), which is 35.9% less than the foreign-born rate of 21.0% across the entire state of Florida.
Race distribution in Gibsonton
2000 2022
10,458,509 65.4% White alone 2,682,715 16.8% Hispanic 2,264,268 14.2% Black alone 261,693 1.6% Asian alone 236,954 1.5% Two or more races 42,358 0.3% American Indian alone 28,994 0.2% Other race alone 6,887 0.04% Native Hawaiian and Other
11,309,403 50.8% White alone 6,025,039 27.1% Hispanic 3,241,015 14.6% Black alone 861,630 3.9% Two or more races 623,692 2.8% Asian alone 152,054 0.7% Other race alone 22,504 0.1% American Indian alone 9,486 0.04% Native Hawaiian and Other
Income and house value in Gibsonton Median household income in 2022 $79,293 White non-Hispanic householders$94,876 Black householders$103,656 Asian householders$50,887 Some other race householders$93,763 Two or more races householders$66,121 Hispanic or Latino race householdersMedian 2022 house value $469,273 White Non-Hispanic householders$591,853 American Indian or Alaska Native householders$499,787 Some other race householders$723,376 Two or more races householders$480,321 Hispanic or Latino householders
Median age by race in Gibsonton
39.2 Median age for White residents39.7 38.5 33.4 Median age for Black or African American residents31.6 33.4 38.0 Median age for American Indian / Alaska Native residents-676,245,210.1 37.1 60.1 Median age for Asian residents59.7 51.1 -848,484,847.6 Median age for Native Hawaiian / Pacific Islander residents-776,729,559.0 -490,118,576.6 33.5 Median age for Other race residents32.8 33.9 27.3 Median age for Two or more races residents26.5 28.2 40.4 Median age for White alone residents40.2 40.5 30.8 Median age for Hispanic or Latino residents28.5 32.5
Owner/renter occupied households by race in Gibsonton
House owners and renters - White residents 2,214 68.4% Owner occupied1,022 31.6% Renter occupiedHouse owners and renters - Black or African American residents 770 84.4% Owner occupied142 15.6% Renter occupiedHouse owners and renters - American Indian / Alaska Native residents 86 86.2% Owner occupied14 13.8% Renter occupiedHouse owners and renters - Asian residents 48 82.8% Owner occupied10 17.2% Renter occupiedHouse owners and renters - Other race residents 170 33.3% Owner occupied341 66.7% Renter occupiedHouse owners and renters - Two or more races residents 1,214 80.7% Owner occupied290 19.3% Renter occupiedHouse owners and renters - White alone residents 1,969 66.0% Owner occupied1,016 34.0% Renter occupiedHouse owners and renters - Hispanic or Latino residents 1,283 65.7% Owner occupied670 34.3% Renter occupied
Language usage in Gibsonton
English speakers - Total 66.7% of residents of Gibsonton speak English at home.
28.0% of residents speak Spanish at home 3,524 72.8% Speak English very well1,315 27.2% Speak English less than very well4.1% of residents speak other language at home 453 64.2% Speak English very well253 35.8% Speak English less than very well
English speakers - Born in the United States 78.5% of residents of Gibsonton speak English at home.
19.8% of residents speak Spanish at home 1,143 94.0% Speak English very well73 6.0% Speak English less than very well1.1% of residents speak other language at home 65 100.0% Speak English very well
English speakers - Native, born elsewhere 23.9% of residents of Gibsonton speak English at home.
72.4% of residents speak Spanish at home 579 77.4% Speak English very well169 22.6% Speak English less than very well
English speakers - Foreign-born 18.9% of residents of Gibsonton speak English at home.
63.2% of residents speak Spanish at home 824 43.9% Speak English very well1,052 56.1% Speak English less than very well17.2% of residents speak other language at home 260 51.0% Speak English very well250 49.0% Speak English less than very well
White (Caucasian) - Speak only English Native:
91.9% (6,901)Foreign-born:
18.8% (67)
White (Caucasian) - Speak another language Native:
7.0% (525)Foreign-born:
75.8% (269)
Black or African American - Speak only English Native:
94.9% (2,171)Foreign-born:
66.0% (470)
Black or African American - Speak another language Native:
5.2% (118)Foreign-born:
33.6% (239)
Asian - Speak another language Native:
100.0% (38)Foreign-born:
89.0% (200)
Other race - Speak only English Native:
26.5% (260)Foreign-born:
5.6% (47)
Other race - Speak another language Native:
73.1% (719)Foreign-born:
94.5% (799)
Two or more races - Speak another language Native:
57.6% (2,289)Foreign-born:
100.0% (978)
White alone - Speak only English Native:
99.1% (6,710)Foreign-born:
50.0% (79)
White alone - Speak another language Native:
1.0% (70)Foreign-born:
51.1% (81)
Hispanic or Latino - Speak only English Native:
30.2% (1,295)Foreign-born:
2.4% (46)
Hispanic or Latino - Speak another language Native:
67.4% (2,893)Foreign-born:
97.9% (1,900)
Foreign-born residents in Gibsonton 2,848 residents are foreign born (12.4% Latin America ).
This city:
15.5%Florida:
21.1%
Marital status for residents in Gibsonton Marital status - White (Caucasian) population 15 years and over
Males 32.1% Never married42.7% Now married1.8% Separated4.1% Widowed19.3% DivorcedFemales 31.1% Never married38.1% Now married2.6% Separated6.5% Widowed21.8% DivorcedWomen who gave birth in the past 12 months Now married:
20.6% (6)Unmarried:
79.4% (23)
Women who did not give birth in the past 12 months Now married:
37.8% (790)Unmarried:
62.2% (1,300)
Marital status - Black or African American population 15 years and over
Males 34.0% Never married61.1% Now married3.4% Separated0.0% Widowed1.5% DivorcedFemales 42.4% Never married48.2% Now married2.0% Separated3.1% Widowed4.2% DivorcedWomen who gave birth in the past 12 months Now married:
27.2% (26)Unmarried:
72.8% (69)
Women who did not give birth in the past 12 months Now married:
51.2% (436)Unmarried:
48.8% (415)
Marital status - American Indian / Alaska Native population 15 years and over
Males 0.0% Never married0.0% Now married0.0% Separated100.0% Widowed0.0% DivorcedFemales 45.2% Never married23.3% Now married0.0% Separated11.0% Widowed20.5% DivorcedWomen who did not give birth in the past 12 months Now married:
34.0% (34)Unmarried:
66.0% (66)
Marital status - Asian population 15 years and over
Males 0.0% Never married100.0% Now married0.0% Separated0.0% Widowed0.0% DivorcedFemales 12.4% Never married72.4% Now married0.0% Separated0.0% Widowed15.3% DivorcedWomen who did not give birth in the past 12 months Now married:
46.0% (43)Unmarried:
54.0% (50)
Marital status - Other race population 15 years and over
Males 34.4% Never married57.9% Now married4.8% Separated0.0% Widowed2.9% DivorcedFemales 41.6% Never married42.5% Now married4.8% Separated3.9% Widowed7.2% DivorcedWomen who did not give birth in the past 12 months Now married:
41.5% (236)Unmarried:
58.5% (332)
Marital status - Two or more races population 15 years and over
Males 44.9% Never married53.1% Now married0.0% Separated0.0% Widowed2.0% DivorcedFemales 26.0% Never married60.4% Now married0.7% Separated0.0% Widowed12.9% DivorcedWomen who gave birth in the past 12 months Now married:
100.0% (40)Unmarried:
0.0% (0)
Women who did not give birth in the past 12 months Now married:
65.7% (796)Unmarried:
34.3% (415)
Marital status - White alone, not Hispanic / Latino population 15 years and over
Males 31.1% Never married42.3% Now married2.2% Separated4.3% Widowed20.1% DivorcedFemales 30.0% Never married40.4% Now married3.3% Separated7.7% Widowed18.6% DivorcedWomen who gave birth in the past 12 months Now married:
0.0% (0)Unmarried:
100.0% (16)
Women who did not give birth in the past 12 months Now married:
40.2% (740)Unmarried:
59.8% (1,103)
Marital status - Hispanic or Latino population 15 years and over
Males 38.3% Never married54.0% Now married1.3% Separated1.0% Widowed5.4% DivorcedFemales 32.3% Never married45.3% Now married1.5% Separated1.7% Widowed19.2% DivorcedWomen who gave birth in the past 12 months Now married:
75.0% (34)Unmarried:
25.0% (11)
Women who did not give birth in the past 12 months Now married:
48.8% (898)Unmarried:
51.2% (943)
Ancestries in Gibsonton
346 3.1% German307 2.7% American222 2.0% Italian176 1.6% English171 1.5% British West Indian141 1.3% Polish137 1.2% Haitian124 1.1% Irish98 0.9% British58 0.5% Guyanese55 0.5% Portuguese54 0.5% Greek54 0.5% West Indian40 0.4% French Canadian33 0.3% Nigerian28 0.2% European24 0.2% Jamaican20 0.2% French18 0.2% Trinidadian and Tobagonian16 0.1% Scotch-Irish12 0.1% Scottish11 0.10% Russian8 0.07% Slovak6 0.05% Dutch
Geographical mobility in Gibsonton Same house 1 year ago 7,061 87.6% White (Caucasian)2,792 90.4% Black or African American220 100.0% American Indian / Alaska Native281 100.0% Asian1,738 90.9% Other race5,411 97.1% Two or more races6,480 90.7% White alone, not Hispanic / Latino6,052 88.7% Hispanic or LatinoMoved within same county 630 7.8% White / Caucasian110 3.6% Black or African American66 3.5% Other race117 2.1% Two or more races425 6.0% White alone, not Hispanic / Latino457 6.7% Hispanic or LatinoMoved within same state 192 2.4% White / Caucasian98 5.1% Other race32 0.6% Two or more races158 2.2% White alone, not Hispanic / Latino187 2.7% Hispanic or LatinoMoved from different state 116 1.4% White / Caucasian244 7.9% Black or African American14 0.7% Other race9 0.2% Two or more races64 0.9% White alone, not Hispanic / Latino70 1.0% Hispanic or LatinoMoved from abroad 5 0.1% White18 0.3% Hispanic or Latino
Children Nativity (place of birth) in Gibsonton
Children under 6 years - Living with two parents Both parents native 328 100.0% NativeBoth parents foreign-born 157 100.0% NativeOne native, one foreign-born parent 92 100.0% NativeChildren under 6 years - Living with one parent Native parent 488 100.0% NativeForeign-born parent 229 100.0% NativeChildren 6 to 17 years - Living with two parents Both parents native 1,909 100.0% NativeBoth parents foreign-born 369 92.1% Native32 7.9% Foreign-bornOne native, one foreign-born parent 237 89.1% Native29 10.9% Foreign-bornChildren 6 to 17 years - Living with one parent Native parent 942 100.0% NativeForeign-born parent 412 54.5% Native343 45.5% Foreign-born
Grandparents responsible for own grandchildren in Gibsonton
Grandparents (30 to 59 years) White / Caucasian 10 25.9% Responsible for grandchildren30 74.1% Not responsible for grandchildrenBlack or African American 130 62.2% Responsible for grandchildren79 37.8% Not responsible for grandchildrenOther race 7 100.0% Responsible for grandchildrenWhite alone, not Hispanic / Latino 13 100.0% Responsible for grandchildrenHispanic or Latino 15 34.5% Responsible for grandchildren29 65.5% Not responsible for grandchildrenGrandparents (60 years and over) White / Caucasian 42 29.5% Responsible for grandchildren101 70.5% Not responsible for grandchildrenBlack or African American 106 100.0% Not responsible for grandchildrenWhite alone, not Hispanic / Latino 41 31.5% Responsible for grandchildren90 68.5% Not responsible for grandchildrenHispanic or Latino 20 25.8% Responsible for grandchildren57 74.2% Not responsible for grandchildren